Topological study about failure behavior and energy absorption of honeycomb structures under various strain rates
2023-07-04YuhenWeiMengjieTinChunyngHungShowuWngXingLiQinrnHuMengqiYun
Yu-hen Wei , Meng-jie Tin , Chun-yng Hung ,b, Sho-wu Wng , Xing Li ,Qin-rn Hu , Meng-qi Yun ,*
a State Key Laboratory of Explosion Science and Technology, Beijing Institute of Technology, Beijing,100036, China
b Chongqing Innovation Center, Beijing Institute of Technology, Chongqing, 400044, China
c State Grid Anhui Electric Power Research Institute, Hefei, 230601, China
Keywords:Honeycomb structures Impact loading Negative Poisson's ratio Titanium alloy Dynamic response
ABSTRACT
1. Introduction
The protective equipment of national defense and civil air defense projects is a key factor in determining the protective effect.Lightweight design has always been the key research direction of protective equipment design and scientific research.On the basis of ensuring the strength, rigidity and stability of the protective equipment, the structure is optimized to maximize the protection efficiency [1—4].
The lightweight honeycomb structure has excellent mechanical properties, including high specific strength, impact resistance and energy absorption [5,6]. Therefore, the honeycomb structure has been increasingly used in national defense projects. The microscopic deformation mechanism of a honeycomb structure involves an indentation response and mean crushing stress[7,8].The effects of geometric parameters and structural materials on the deformation mechanism and collapse mode of such structures have been studied systematically [9—12]. Qi et al. [13]. experimentally and numerically studied the impact and close-in blast response of honeycomb-cored sandwich panels, the honeycomb sandwich plates were found to absorb energy by 2.5-fold compared with steel plate. Lan et al. [14] designed a novel cylindrical sandwich panel,which was found to be able to reduce deflection and increase energy absorption per unit mass. Meng et al. [15]. examined the compression characteristics of combined honeycomb structure under explosion experimentally and through simulations. It was shown that the energy absorption and compressive strain decrease with the increasing scaling distance. The honeycomb structures show excellent performance in energy absorption.
With the in-depth research on honeycomb structure,Lakes[16]discovered for the first time a Negative Poisson's ratio honeycomb structure,which exhibits an inward depression when compressed,which violates the traditional structural design.Liu et al.[17]found that the yield strength, stiffness, and energy absorption of a material were enhanced by Negative Poisson ratio effects. The theoretical, FE and experimental methods were adopted by many researchers to study the crushing deformation,crushing stress and energy absorption of re-entrant hexagonal honeycombs [18,19]under static loads.Wan et al.[20]proposed a theoretical approach for calculating Poisson's ratio of honeycombs based on large deflection theory. Zhang et al. [21] analyzed the nonlinear deformation behavior of cellular materials with an re-entrant lattice structure and gave the geometric parameters governing the deformation of the material.Evans et al.[22]found that geometric sensitivity was vitally important to controlling unit structures.Also,the relationship between structure geometry and performance,including the influence of the cell wall aspect ratio and the angle of re-entrant honeycombs under static loads were studied well. Li et al.[23]fabricated the re-entrant honeycomb cores with different cell-wall thicknesses by selective laser melting (SLM), and found the local Negative Poisson's ratio deformation in honeycomb core.Zheng et al. [24] used a combination of analytical, numerical, and experimental methods to gain a deep understanding of the elastic behavior of the new honeycomb and examined its dependence on the geometric parameters. Alomarah et al. [25] conducted quasistatic tensile tests on polymers and aluminum alloys. It was found that re-entrant honeycomb structures had higher tensile properties and growth effects compared with conventional ones.However, the results from these studies could only provide a reference for the study of honeycomb structures under dynamic loads.
Simulation and theoretical analysis are well established on the study of re-entrant honeycombs under dynamic loadings. Zhang et al.[26]theoretically evaluated the nonlinear transient responses of a negative Poisson ratio honeycomb sandwich plate under impact dynamic loading.Hu et al.[27]predicted the NPR effect and the crushing stress of the re-entrant hexagonal honeycomb under dynamic load theoretically. Fang et al. [28] studied the negative Poisson's ratio(NPR)effect on shrinkage deformation and crushing stress of metallic auxetic re-entrant honeycomb under low, medium and high-velocity compression, and found the NPR effect could enhance the inertial effect during dynamic compression.Zhang et al. [29] explored the contributions of the total thickness,core thickness ratio, Poisson ratio, cell inclination angle, and blast type to the transient responses of a plate. Li et al. [30] studied the structure response of end-clamped sandwich beam with auxetic reentrant hexagonal aluminum honeycomb core locally subjected to foam projectile with high-velocity impact by experiment and simulation. Zhang et al. [31] proposed a re-entrant arc-shaped honeycomb (RAH) model by the concept of bio-inspired structure design. The in-plane impact resistances and absorbed-energy characteristics of bio-inspired auxetic RAHs subjected to a constant velocity crushing are numerically studied by using ABAQUS/EXPLICIT. Wu et al. [32] analyzed the effects of impact velocity,honeycomb micro-topology types, and honeycomb microtopology-type distribution in sub-domains on the deformation mode, plateau stress, load uniformity, and energy absorption capacity of composite honeycomb structures. The results show that the honeycomb micro-topology-type distribution in sub-domains is of importance to affect the mechanical properties of composite honeycomb structures under dynamic loads.
Limited attention has been paid to the comprehensive effect on multiple parameters of the honeycomb structure under high-speed impacts.Stanczak and Khoa et al.[33,34]also studied the structural properties of thin-walled hexagonal aluminum honeycombs subjected to blast loading. The folding properties of the honeycomb deformation formed in axial compression distribute the initial loading over a period of time,which is considered to be an effective method of energy dissipation. Therefore, the macroscopic energy absorption and impact resistance of various parameters on reentrant honeycombs should be further elucidated.
In order to study the energy absorption of honeycomb structures under the impact loadings, the re-entrant hexagonal structure, regular hexagonal structure and regular quadrilateral structure were designed in the paper.Selective laser melting(SLM)printing technology was used to fabricate titanium alloy(Ti—6Al—4V)honeycomb samples with various design parameters.The effect of cell topological shapes, cell heights, cell angles and relative density of honeycomb structures were explored. Quasistatic compression experiments were performed, and dynamic impact experiments were carried out at four strain rates. The critical compaction strain, non-dimensional peak stress and energy absorption density were then calculated from the measured stressstrain curves.The results enabled the production of a structure with optimal parameters, which could maximize the energy absorption density and peak stress under different impact loads; such structures demonstrate potential applicability in shock wave protection applications.
2. Geometric design and sample preparation
2.1. Geometry and fabrication of honeycomb structures

Fig. 1. Schematic of geometry and dimension of the 3D printed Ti—6Al—4V samples with different geometric parameters:(a)Regular quadrilateral honeycomb;(b)Regular hexagon honeycomb and (c) Re-entrant hexagon honeycomb with different heights and angles.
Fig.1 illustrates the specific geometric parameters of the studied topological shapes. Each honeycomb cell has five design parameters:the height of the vertical axis of the cell(l1;mm);the length of the horizontal axis (h2; mm); the length of the inclined edge (l2;mm);the angle between the inclined edge and the vertical axis(θ;◦);the cell wall thickness(t;mm).In addition,h1(mm)represents the overall height of the sample. For all samples,l1was defined to 2.58, 3.40, 4.22, or 5.05 mm, respectively; meanwhile, a cell angle(θ)that was too large would lead to cell wall overlap,and an angle that was too small may eliminate the re-entrant properties.Therefore, the cell angle was set as 20◦, 22.5◦, 30◦, or 40◦to limit negative effects,twas set to 0.2 mm, andh1was set to 10 mm.
Table 1 describes the samples designed for this study; these samples varied in terms of their topological shape, cell angle, cell height and relative density. A labeling system was created to facilitate the analysis and comparison of results: SM1 is the reference sample,such that all other samples have the same geometric parameters and material; SMT, SMA, and SMH labels represent honeycomb structures with varying topological shapes,cell angles,and cell heights,respectively.Topological shape refers to the shape of the honeycomb structure unit cells, and was either a re-entrant hexagon, a regular quadrilateral, or a regular hexagon. Samples with the same topology were conducted quasi-static compression experiments and dynamic impact experiments for three times,which makes 15 copies of samples under the same topology.
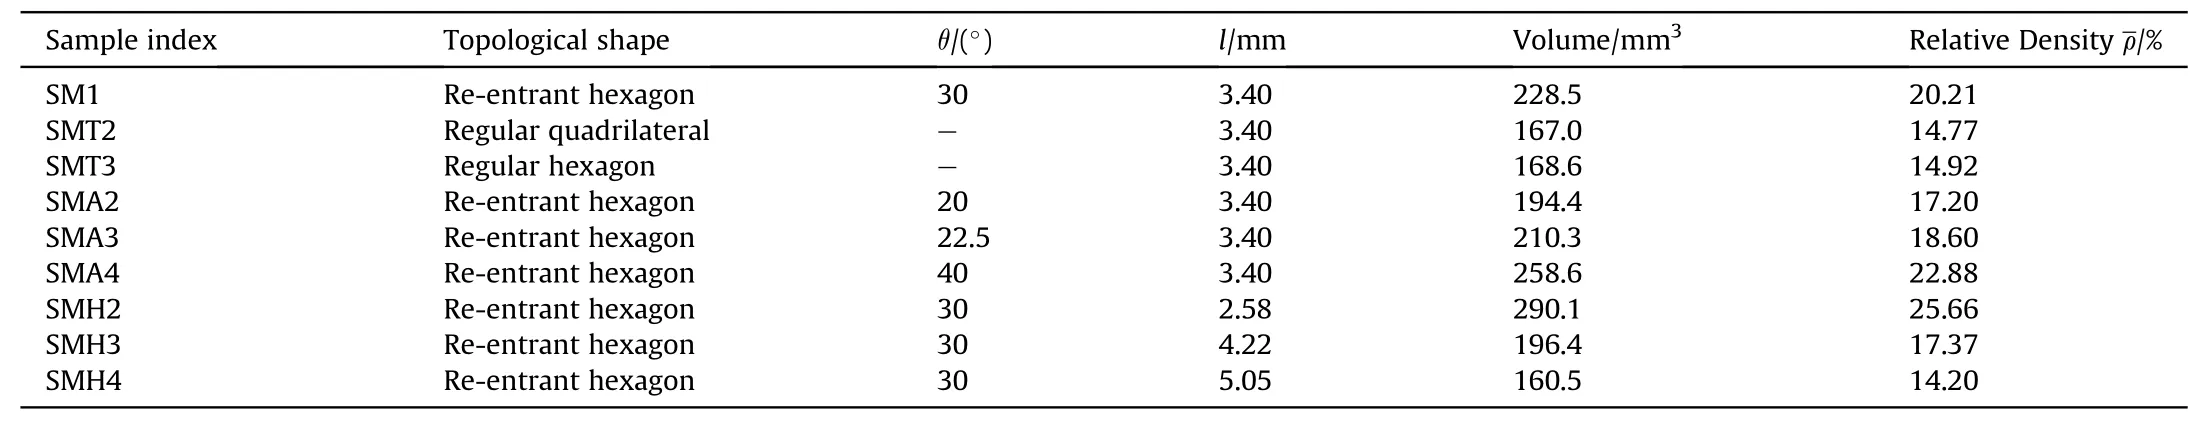
Table 1Honeycomb structure specifications.
2.2. Parent material
2.2.1. Material tests
The specimens were manufactured on a SLM machine from HunanFarsoon High-Technology Co.,Ltd., type FS273 M. The SLM machine was equipped with a 500 W disk laser with a beam diameter of 90 μm. The layer thickness was kept at 30 μm. The particle size of the Ti—6Al—4V (TC4) powder ranges from 20 to 60 μm. The scanning speed was approximately 0.9 m/s. Posttreatments were conducted to enhance the mechanical properties of the printed samples.Annealing was carried out to minimize the residual stresses in the samples. The specimens were heated to 800◦C(+10◦C)in a vacuum environment for 2 h then cooled in the furnace.
Owing to the differences between metal 3D printing technology and traditional metal casting, the established performance of TC4 cannot accurately characterize 3D-printed TC4.To characterize the TC4 parent material, quasi-static (uniaxial) tension tests were carried out on 3D printed standard specimens and determined the yield stress,yield strain,fracture strain and the Lankford coefficient of the printed TC4. Each experiment was repeated three times according to ISO 52921[35].Fig.2(a)and Fig.2(b)show the flat plate typed tension specimen dimensions.The stress-strain curve of the printed bulk TC4 is shown in Fig. 2(c), which presented four regions: the elastic region, the perfectly plastic yielding region, the necking region, and the fracture region. Here, stress indicates the amount of force applied per unit area,and strain indicates the ratio of deformation to original size.
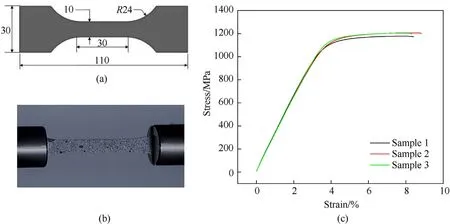
Fig. 2. Parent material testing: (a) 3D printed TC4 sample size; (b) 3D printed standard specimen; (c) Quasi-static stress-strain curves until fracture of tensile test samples taken from a die-cast plate.
The corresponding mechanical properties are summarized in Table 2. The Lankford coefficient (r-ratio) is often used to quantify the plastic anisotropy of a material, which is defined as the logarithmic plastic width to length strain ratios as follows:whereL0is 30 mm,b0is 10 mm,Landbare the length and width with the stretching process. In the experiment, the width and length changes during the stretching process were obtained by photo shooting and using DIC.Notice thatr=1 can be served as a reference value (this would correspond to an isotropic material),and a greater deviation tor=1 would indicate stronger anisotropy.

Table 2Mechanical properties of the 3D-printed TC4 material.
2.2.2. Tensile fracture
The fracture surface of sample from the TC4 plate is shown in Fig. 3. Fig. 3(a) gives an overview of the total area, while Fig. 3(b)illustrates the dimple structure acquired within the white circle marked in Fig. 3(a). The SLM material features a large number of dimples (10—20 μm). The sample undergoes a large plastic deformation and produces microscopic cavities in the micro-zone range.These microscopic cavities went through the nucleation, growth,aggregation and finally interconnection and fracture.

Fig. 3. Fracture surface of a typical tensile test specimen showing (a) an overview the white circle showing a dimpled fracture surface, (b) a higher magnification from inside.
3. Experimental setup
Quasi-static compression and dynamic impact experiments were conducted to explore the compression response behavior of each sample under low/high-velocity impact loading, and the fracture mode of each sample was observed using scanning electron microscopy(SEM).Each experiment was repeated three times,which resulted in a total of 135 measurements, and the average value and error value were obtained.
3.1. Quasi-static compression experiments
Fig. 4(a) shows the MTS universal testing machines that was used to subject samples to quasi-static compression[36].The lower grip was fixed, but the upper grip moved at a velocity of 0.5 mm/min with a corresponding nominal strain rate of 0.0008 s-1.Signals were recorded using a digital oscilloscope with a sampling rate of 50 Hz. Strain and stress histories were measured using linear variable displacement transducers.
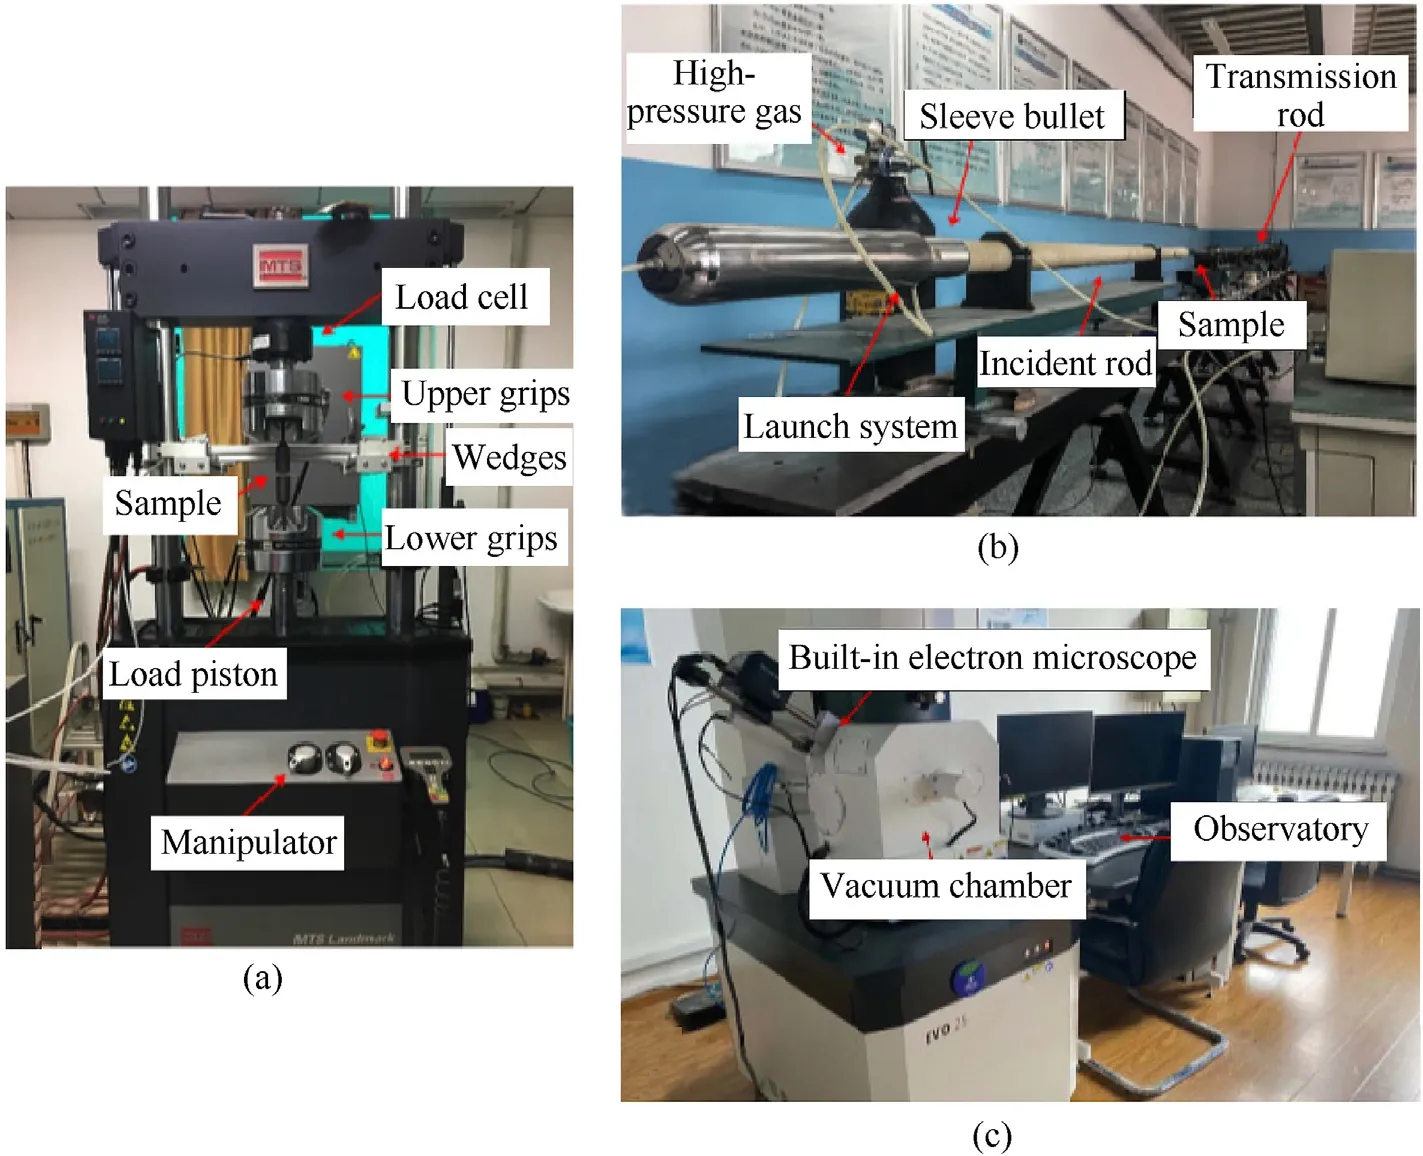
Fig. 4. Experimental setup: (a) MTS landmark machine; (b) Hopkinson rod (SHPB); (c) Zeiss EVO25.
3.2. Dynamic impact experiments
Fig. 4(b) gives an overall view of the SHPB (Split Hopkinson Pressure Bar) apparatus used to subject samples to dynamic impacts. The launch system was used to control the high-pressure gas,which pushed the sleeve bullet,thereby causing it to move,hit the incident rod,and generate a loading wave propagating into the incident rod.A strain gauge attached to the surface of the incident rod recorded the incident signal (εi) and the reflected signal (εr),and the strain gauge attached to the transmission rod recorded the transmission signal (εt). The strain signal was amplified by the super dynamic strain gauge,stored and recorded by the oscilloscope,and ultimately transferred to the computer through the interface for processing. The Hopkinson rod (SHPB) apparatus was used at four strain rates(900,1100,1300,and 1500 s-1)by controlling the air chamber pressure change between 0.1 and 0.25 MPa[36].Each rod had a nominal diameter of 15 mm and was made of highstrength steel with a Young modulus of 210 GPa and an elastic wave velocity of 5000 m/s. The sleeve bullet (length = 200 mm)was accelerated using an air pump. The incident rod and the transmission rod were both 1200 mm long. The sample was sandwiched between the incident and transmission rods, with a strain gauge mounted on each rod[37].
In addition, a brass disc with a thickness of 2 mm was glued to the center of the front end of the incident rod, which served as a pulse shaper. In these experiments, the pulse shaper was first hit and then yielded,thereby reducing the amplitude of the waveform oscillation and achieving stress equilibrium. The waveform was clarified by processing two strain gauge signals, and experimental results were processed using the three-wave method [38].
3.3. SEM experiments
Fig. 4(c) shows the equipment used for SEM (Zeiss EVO25) experiments. The device resolution reached 0.5 nm, and it had a magnification of 5 to 105times (continuously adjustable). The present study investigated the microscopic morphology of the section after-shock using secondary electron imaging.
4. Results and discussion
4.1. Evaluation criteria of impact resistance
The compression modulus (Es), non-dimensional peak stress(Pmax), peak strain (εP), critical compaction strain (εd), energy absorption density (SEAv), and dynamic enhancement factor (DIF)were calculated based on the experimental results to evaluate the impact resistance of each sample. The compression modulus (Es)was defined experimentally from the slope of the starting segment of the stress-strain curve. To eliminate the effect of dimensional effects, the mechanical properties of the structure are analyzed by non-dimensional peak stressduring the entire impact,which was defined by Eq. (2)
wherePmaxis the maximum value in the stress-strain curve,and it reflected the resistance to deformation. σyis the yield strength of the parent material,is the relative density of samples [40]. The peak strain is defined as the strain corresponding to the peak stress in a material or structure and reflects the deformation capacity of the structure or material.The higher the peak strain,the higher the deformation capacity of the sample. The widely used method for determining the critical compaction strain is the energy absorption efficiency method, which avoids the arbitrariness of human selection to a certain extent. Based on the energy absorption efficiency method, the critical compaction strain (εd) can be determined by Eq. (3)
whereEis the energy absorption efficiency of the multicellular material, which could be defined as the ratio of the energy absorbed at a given nominal strain to the corresponding nominal stress by Eq. (4).
In fact, there are many local maxima in the energy efficiency curves of multi-cell materials. In this paper, the nominal strain corresponding to the last maximum point(i.e.,the point where the energy efficiency curve starts to decrease rapidly)is defined as the critical compaction strain.
The energy absorption density during compression was obtained by integrating the stress-strain curve. The range of strain is from 0 to critical compaction strain [37]. In the field of impact dynamics, the dynamic enhancement factor is commonly used to quantitatively characterize the impact of the loading rate on the mechanical properties of materials and structures. The DIF can be calculated using Eq. (5).
where σdrepresents the strength of the structure under dynamic impact,and σprepresents the strength of the structure under static compression.
4.2. Effect of topological shapes
Samples SM1, SMT2 and SMT3 were studied to determine the effects of the honeycomb topological shape on the impact resistance of a honeycomb structure under quasi-static(0.0008 s-1)and dynamic compression (900 s-1,1100 s-1,1300 s-1,1500 s-1).
4.2.1. Quasi-static compression results
Fig. 5 shows the quasi-static stress-strain curves for the SM1,SMT2, and SMT3 samples. Each curve of quasi-static compression was averaged from three repeated tests. It can be found that the deformation failure modes of the three structures are different.Compression modulus and peak stress are the key factors to consider when analyzing the mechanical properties of honeycomb structures.The compression moduli of SM1,SMT2,and SMT3 were 30.94 MPa,180.34 MPa, and 30.4 MPa, and the peak stresses were 2.74 MPa,6.42 MPa,and 2.19 MPa,respectively.The peak strains of SM1,SMT2,and SMT3 were 9.45%,3.64%,and 8.42%,and the critical compaction strains were 44.5%, 52.4%, and 46.9%, respectively.Under quasi-static compression,the stress-strain curves of samples SMT2 and SMT3 are double-humped, which is caused by the damage mode of the samples failing layer by layer. In the critical compaction strain range, the collapse of the two-layer structure was achieved, so the double-hump shape was formed.

Fig. 5. Stress—strain curve, corresponding energy efficiency—strain curve and deformation process under quasi-static compression: (a) SM1; (b) SMT2; (c) SMT3. (Graph includes compressive modulus, peak stress, peak strain, critical compaction strain).
Fig. 5(a) presents the deformation process of SM1 under quasistatic compression. The re-entrant hexagon structure formed a dense band along the diagonal of the sample after about ε = 15%,and the inclined sides of each cell tended to gather on the horizontal side;then,as the compression proceeded,a“X"-shaped zone appeared on the sample at around ε=30%.Finally,at the end of the compression process, the overall structure failed, and the central part was mainly compacted at around ε=45%.Fig.5(b)shows the deformation process of SMT2 under quasi-static compression. The bottom of the regular quadrilateral structure was unstable during the initial stage of compression,and the structure first tilted to one side (in ε = 15%). As the compression progressed, the bottom cells were compacted,and the middle cells were tilted.This failure mode propagated layer by layer through the cell structure.Therefore,two humps appear on the stress-strain curve.At the end of compression(in ε=45%),the structure had severe fractures and failures.Fig.5(c)shows the deformation of SMT3 under quasi-static compression.At around ε = 15%, the cells of the regular hexagonal structure expanded outward, the upper and lower beams of the cell contacted, and a “I”-shaped dense zone was ultimately formed. The upper cells of the inclined zone deformed in the same manner,and overlapped with the first deformed cell at around the sixth minute.By ε=45%,the cells in the middle of the structure were completely dense,and the cells in the upper-left and lower-right corners were deformed to a lesser extent.In contrast to the regular quadrilateral structure and the regular hexagonal structure, the re-entrant hexagonal structure gathered inward during the impact process, thus making it more resistant to deformation.
Since the experimental sample was fabricated using 3D printing,making it distinct from the traditional TC4 material, the fracture analysis of the sample (SMT2) that broke after the impact was investigated (Fig. 6). The performance and failure mode of the sample were evaluated based on the macroscopic and microscopic morphology of the fracture. Experimental observations revealed that random round particles were present on the surface of the structure (Fig. 6(a)), i.e., the free surfaces of the TC4 powder, indicating the nature of industrialized SLM:the surface was not perfect.Fig. 6(b) shows that the fracture surface had a plastic fractured dimple-derived surface and a fracture propagation tearing edge,indicating that the regular quadrilateral structure experienced a composite fracture in the compressed state. The necking phenomenon is depicted in Fig.6(c)during the fracture process,which is not observed macroscopically. This phenomenon indicated that this part of the regular quadrilateral structure was in a stretched state during compression.Fig.6(d)shows the fracture morphology of the root of the flute of the regular quadrilateral structure. It is clear that the root exhibited a cliff-like shear fracture phenomenon,which appeared in a relatively short period of time.
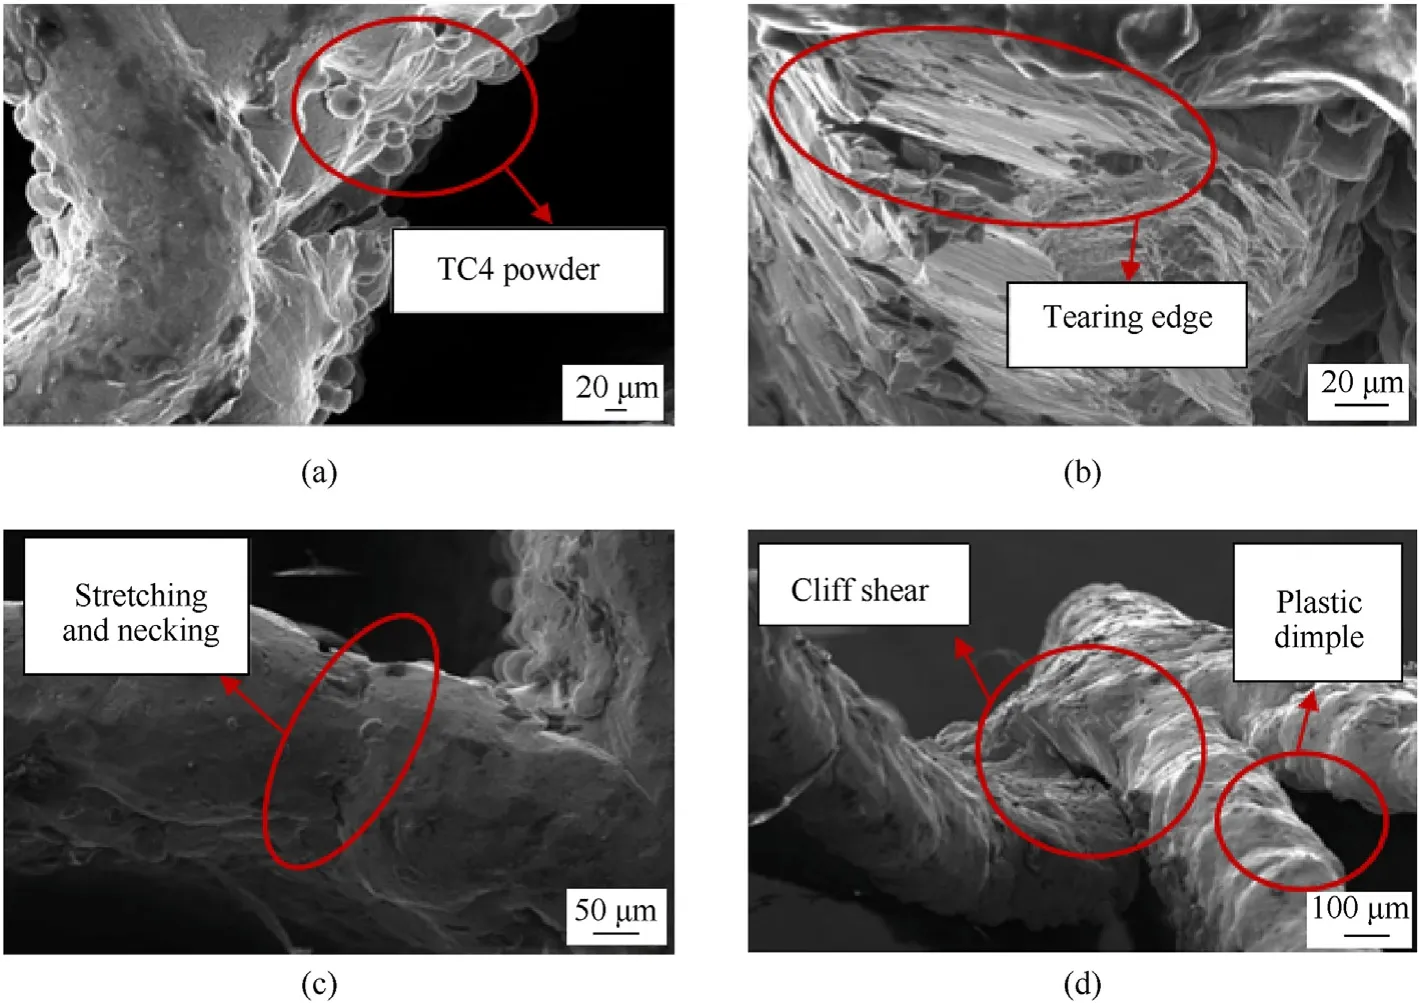
Fig. 6. SEM images showing the micro morphology of the regular quadrilateral structure (SMT2): (a) 3D-printed TC4powder; (b) Compound fracture pattern; (c) Necking phenomenon; (d) Shearing phenomenon.
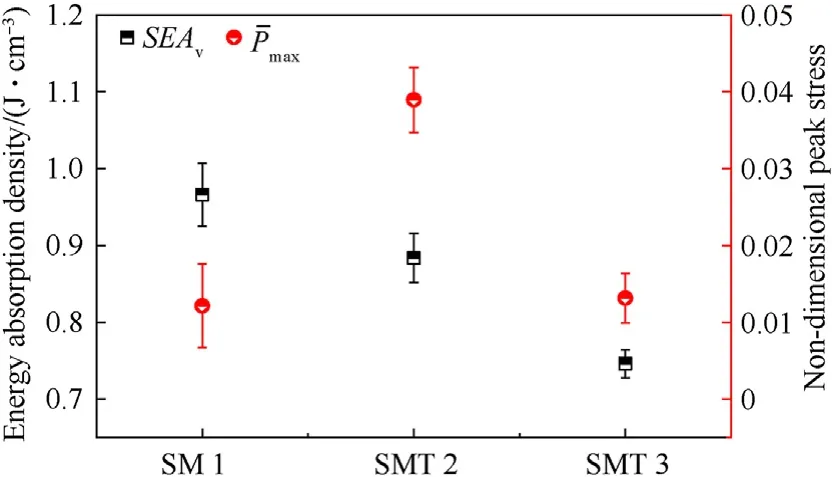
Fig.7. Non-dimensional peak stress and energy absorption density of three structures(SM1/SMT2/SMT3) under quasi-static compression.
Fig. 7 shows the non-dimensional peak stress and energy absorption density for the SM1, SMT2, and SMT3. Sample SMT2 had the maximum non-dimensional peak stress. The support beam in SMT2 is parallel to the compression direction and has the maximum resistance. Sample SM1 had the highest energy absorption density after integrating the curves. Samples SM1, SMT2,and SMT3 had energy absorption densities of 0.966 J/cm3, 0.884 J/cm3and 0.746 J/cm3,respectively.The energy absorption density of SM1 was 29.5% higher than that of SMT3. The energy absorption efficiency of the structure is determined by its strength and stroke[39]. The SMT2 sample resisted vertically when compressed, suggesting high strength; however, the morphing pattern of SMT2 indicated that the structure broke prematurely and could not maintain stable energy absorption.When SMT3 was compressed,it expanded outwards,indicating low structural strength.When SM1 was compressed,a concave effect was observed,which signaled an increase in the equivalent surface density of the structure, i.e., an increase in strength. Sample SM1 could maintain stable deformation.SM1 exhibited both excellent mechanical strength and a long energy absorption time;therefore,its energy absorption efficiency was deemed the best among those tested.
4.2.2. SHPB dynamic impact results
Two kinds of mesoscopic failure mechanisms for honeycomb are existed, e.g. the in-plane shear failure with lower strength and larger displacement, and the out-of-plane wall buckling with higher strength and lower displacement. It is of great significance to investigate the buckling behaviors of honeycomb structures when the strain at the collapse state is relatively lower. Comparisons of stress-strain curves of samples with different topologies at strain rates of 900 s-1,1100 s-1,1300 s-1, and 1500 s-1are illustrated in Fig. 8. Each curve of dynamic compression was averaged from three repeated tests.Fig.8 reveals that the stress-strain curves of samples SM1 and SMT3 maintain lower strength and larger displacement compared to SMT2,moreover,the strength of sample SM1 is higher than SMT3.
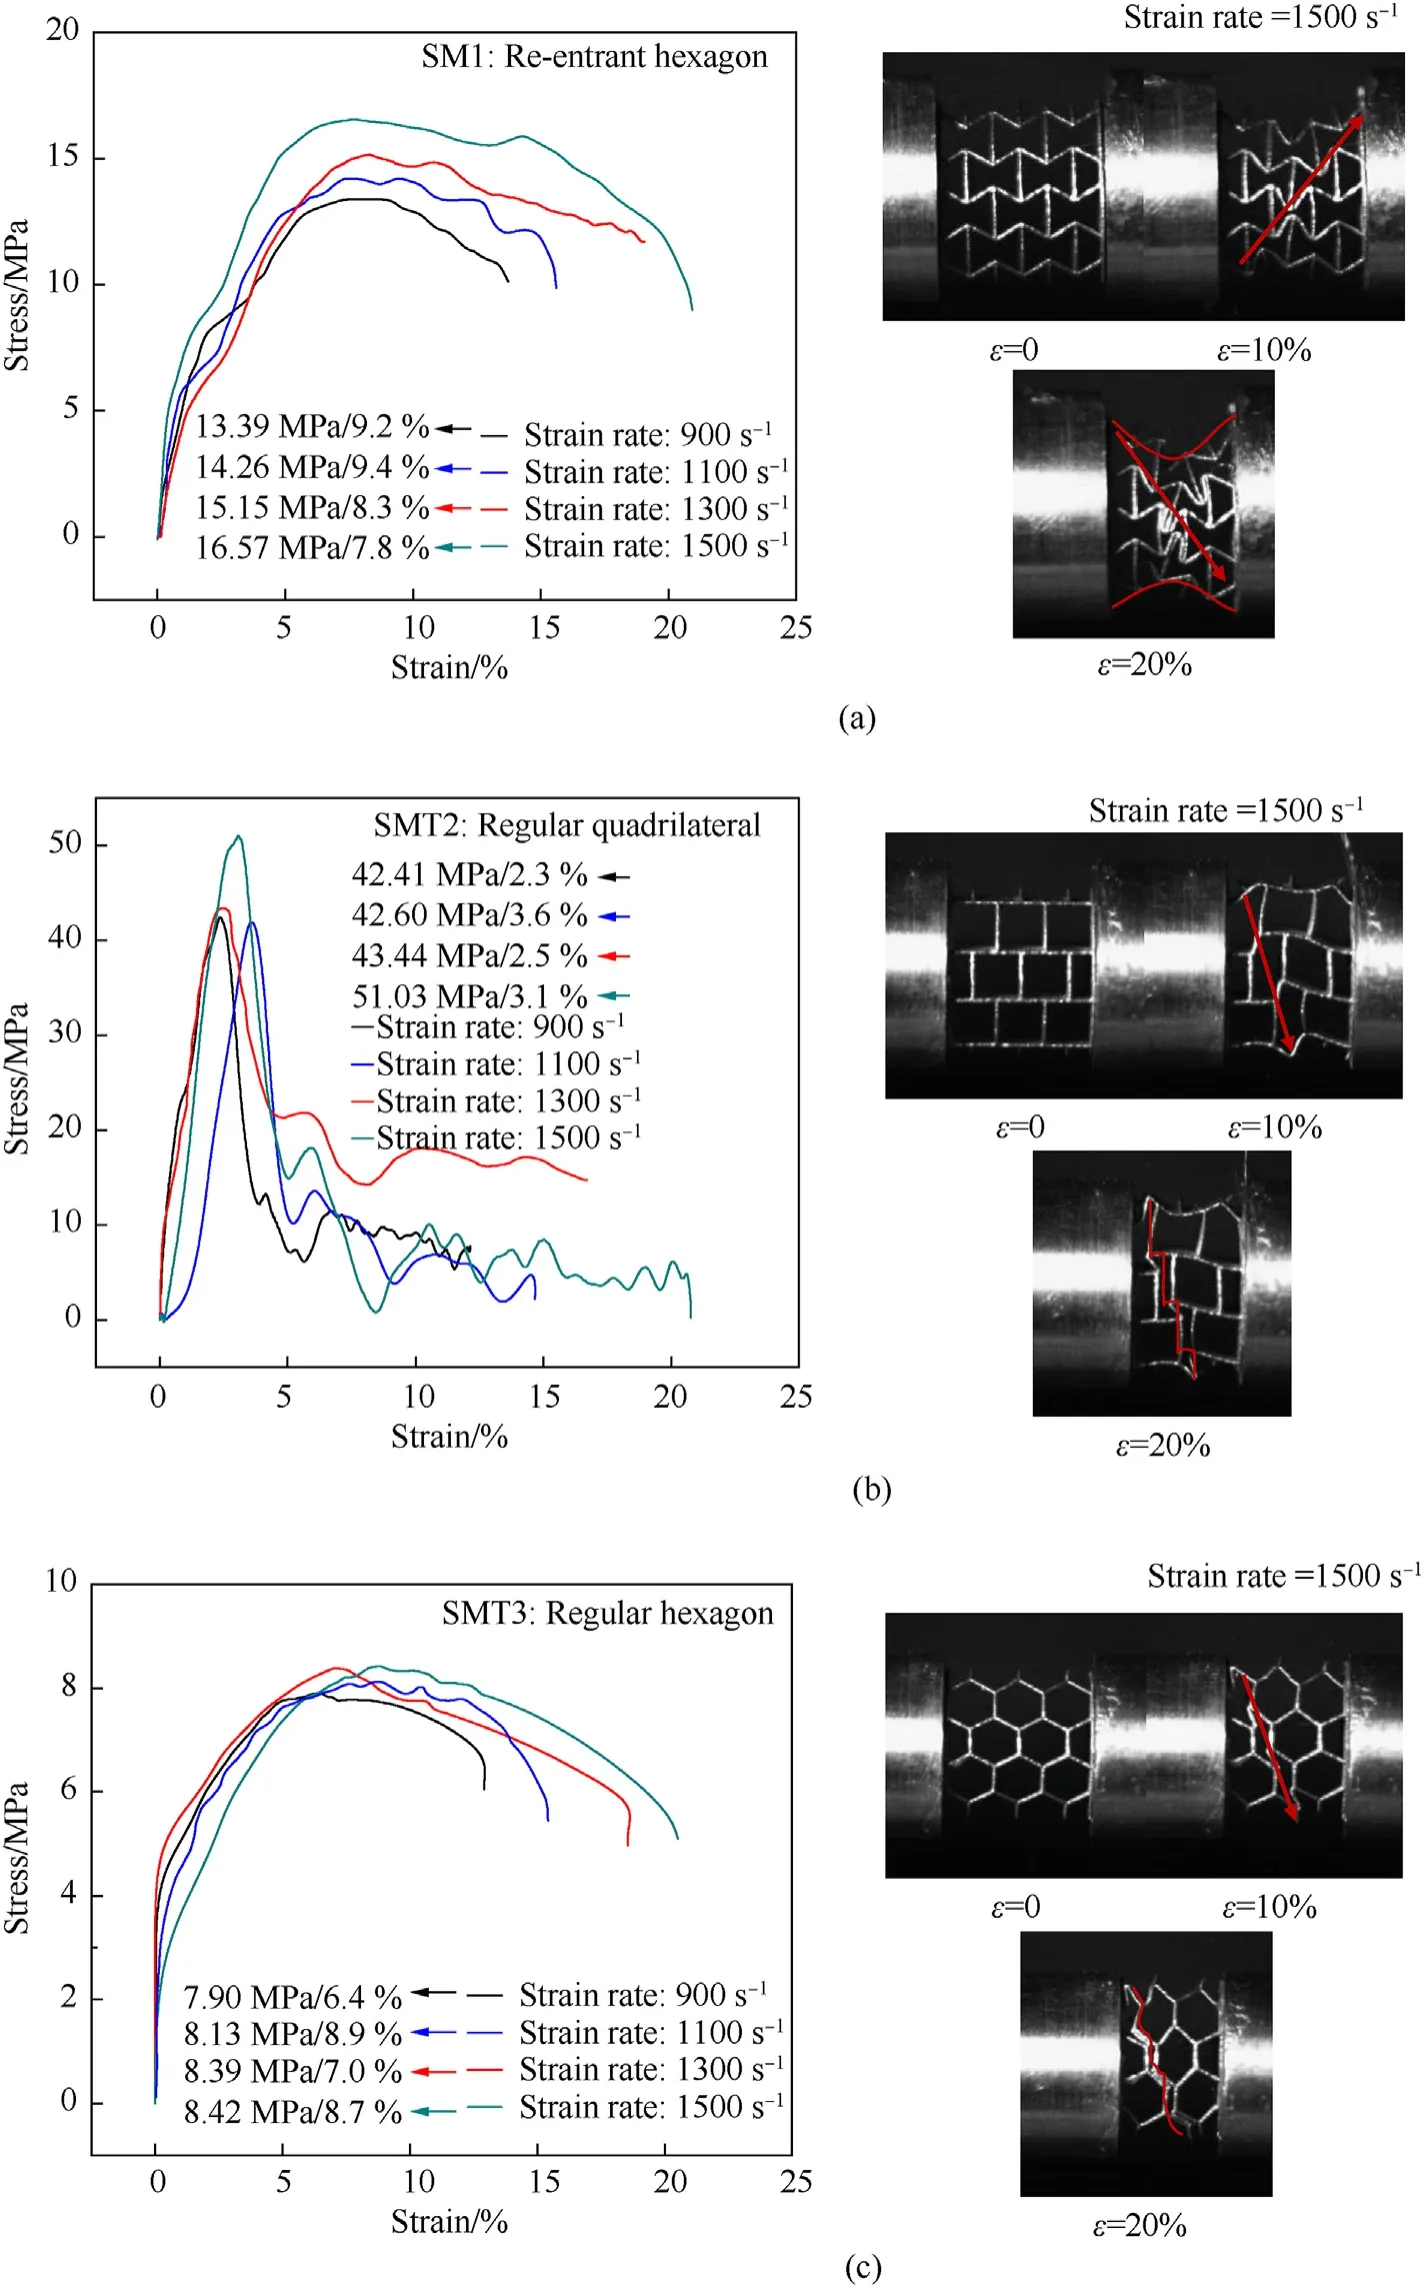
Fig. 8. Stress-strain curves and deformation processes under dynamic compression: (a) SM1; (b) SMT2; (c) SMT3. (Graph includes peak stress, peak strain).

Fig.9. Non-dimensional peak stress and energy absorption density of three structures(SM1/SMT2/SMT3) under dynamic compression.
The photos of SM1,SMT2,and SMT3 under high-speed impacts were captured by a high-speed camera. Fig. 8(a) presents the impact of SM1. At ε = 10%, SM1 formed a diagonal compression zone,and as the strain reaches 20%,a“X”-shaped zone occurred in the other diagonal direction.The overall structure gathered toward the center, generating a negative Poisson's ratio effect.
The images in Fig. 8(b) and Fig. 8(c) show the deformation behavior of SMT2 and SMT3,respectively,under dynamic impacts.It is clear that these two sampled exhibited similar failure modes.At ε = 10%, the sides of SMT2 and SMT3 expanded outward under the impact and deformed in a rhombus shape with sharp corners.At ε=20%,the upper and lower surfaces of the rhombus formed by SMT2 or SMT3 came in contact with one another and formed a“I”-shaped zone.
Overall, in contrast to the observed quasi-static experimental phenomenon,SM1,SMT2,and SMT3 did not experience failure and fracture under dynamic impacts because metal deformation is a time-dependent process that develops at a finite rate (i.e., a ratetime-dependent rheological process). The applied quasi-static compression time was long enough to cause the failure and fracture of TC4,whereas the dynamic impact time was extremely short,and there is a relaxation phenomenon involved in the failure of TC4.Therefore,the failure modes under quasi-static and dynamic shocks are distinct.
The non-dimensional peak stress and energy absorption density are presented in Fig. 9. Higher the peak stress, higher the vertical resistance of the structure. The non-dimensional peak stresses were ranked as SMT2>SM1>SMT3, with SMT2 having the highest vertical resistance. Under four strain rates, the energy absorption densities of SM1,SMT2,and SMT3 increased with increasing strain rate shown in Fig.11.The energy absorption density of SM1,SMT2,and SMT3 increased from 1.48—2.89 J/m3, 1.37—2.6 J/m3, and 0.91—1.42 J/m3, respectively, with the percentage increment of 95.3%, 89.8%, and 56.04%. TC4 titanium alloy is a strain ratesensitive material that shows an enhancement effect when the impact strength is increased.The energy absorption density of SM1 was greater than that of SMT2 and SMT3 at all four strain rates,which is related to the different deformation modes of the three structures,seen Fig. 8.
4.3. Effect of cell angles
Samples SM1, SMA2, SMA3 and SMA4 were studied to determine the effects of the honeycomb cell angle on the impact resistance of a re-entrant structure under quasi-static (0.0008 s-1)and dynamic compression (900 s-1,1100 s-1,1300 s-1,1500 s-1).
4.3.1. Quasi-static compression results
Fig. 10 shows the quasi-static stress-strain curves for SM1,SMA2, SMA3 and SMA4,which all had the same topological shape as a re-entrant hexagon. The compression moduli of SM1, SMA2,SMA3 and SMA4 were 30.94 MPa, 51.59 MPa, 44.03 MPa and 28.59 MPa, and the peak stresses were 2.74, 3.54, 3.32 and 2.36 MPa, respectively. The peak strains of SM1, SMA2, SMA3 and SMA4 were 9.45%, 6.81%, 7.48% and 9.01%, and the critical compaction strains were 44.5%, 46.6%, 41.4% and 38.8%, respectively. It was determined that as the cell angle increased, the compressive modulus and peak stress of the structure decreased,while the critical compaction strain gradually rose.
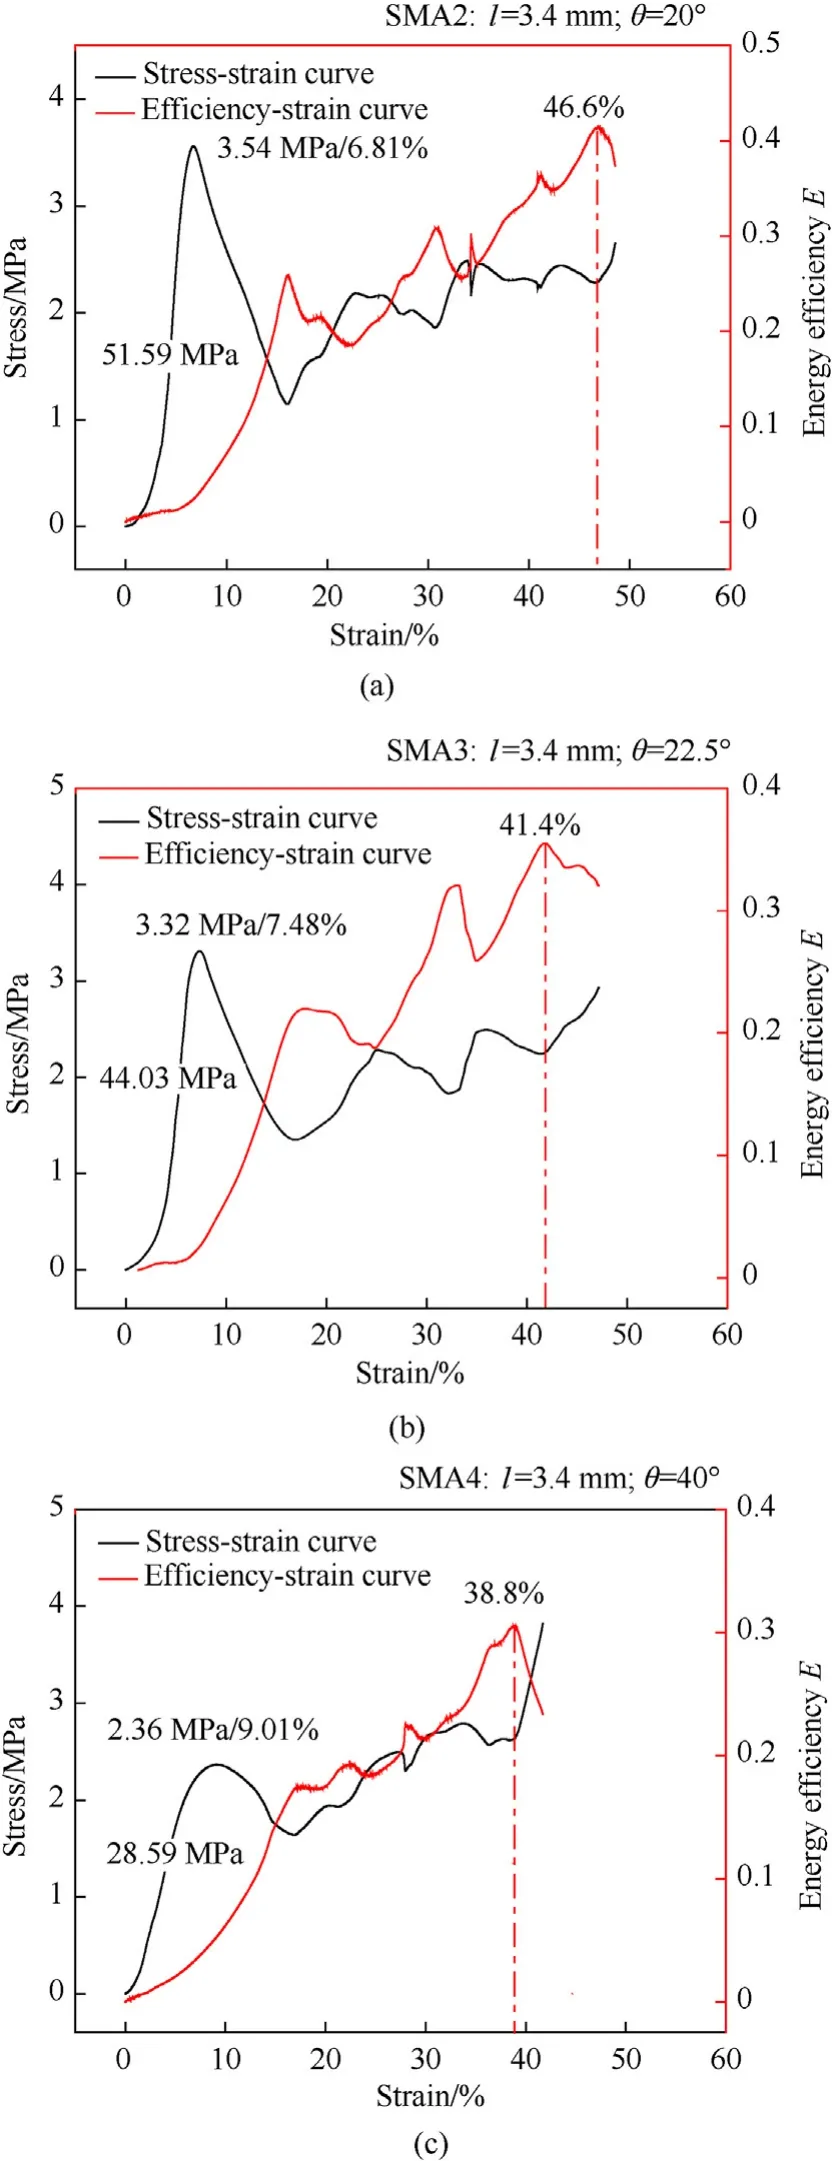
Fig. 10. Stress-strain curves of samples with different angles under quasi-static compression: (a) SMA2; (b) SMA3; (c) SMA4. (Graph includes compressive modulus,peak stress, peak strain, critical compaction strain).
4.3.2. SHPB dynamic impact results
Stress-strain curves of samples with different cell angle under dynamic compression are illustrated in Fig. 11. The dynamic deformation processes of four kinds of samples(SMA2,SMA3,SM1,SMA4) are similar. The peak stress of four kinds of samples were 18.2 MPa, 16.21 MPa, 16.57 MPa, and 13.57 MPa, and the peak strains were 3.2%,8.2%,7.8%,and 6.2%at strain rate 1500 s-1.When the cell angle increases from 20◦to 40◦,the peak stresses decrease by 34%.Since the honeycomb structure is a negative Poisson's ratio structure, during the compression process, a partial force perpendicular and parallel to the compression direction will be generated on the inner concave structure. When the angle increases, the partial force parallel to the compression direction decreases,which makes the resistance in the vertical direction decrease and the peak stress decreases.

Fig. 11. Stress-strain curves of samples with different angles under dynamic compression: (a) SMA2; (b) SMA3; (c) SMA4. (Graph includes peak stress and peak strain).
The plots in Fig.12 show the relation of non-dimensional peak stress to relative density of SM1SMA2SMA3and SMA4When only the cell angles are different, the non-dimensional peak stress of the structure gradually decreases with the increase of the relative density.This is caused by the angle of the inner concave structure, the larger the angle, the smaller the force of the structure perpendicular to the direction of impact. When relative density increases from 17.2% to 22.88%,the non-dimensional peak stress decreases about 0.0414 at strain rate 1500 s-1, which is 4.5 times compared to quasi-static compression. When the strain rates increase from 0.0008 to 1500 s-1,the non-dimensional peak stress increase 4.14 times for sample SMA2,3.98 times for sample SMA3,5.04 times for sample SM1,and 4.75 times for sample SMA4.
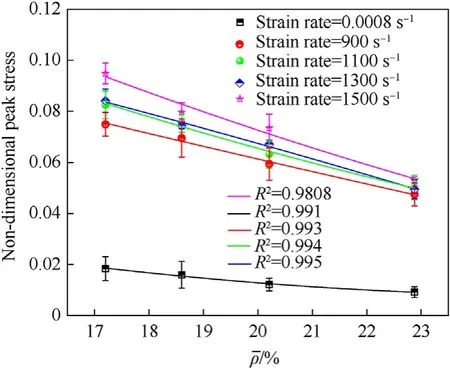
Fig.12. The relation of non-dimensional peak stress toρ (Cell height = 3.4 mm, cell angle = 20◦/22.5◦/30◦/40◦).
The energy absorption densities of SM1 (ρ =20.21%), SMA2SMA3and SMA4at the four tested strain rates are presented in Fig.13.When the strain rate was 1500 s-1, SM1, SMA2, SMA3 and SMA4 reached their maximum energy absorption densities were 2.89 J/cm3,2.34 J/cm3,2.99 J/cm3and 2.28 J/cm3, respectively.The energy absorption density curves indicate that under the four strain rates, the magnitude of the change in SM1 ranges from 0.966 to 2.89 J/cm3, corresponding to 199%; that of SMA2 ranges between 0.94 and 2.34 J/cm3(149%);that of SMA3 ranges between 0.99 and 2.991 J/cm3(202%);that of SMA4 ranges between 0.89 and 2.28 J/cm3(156%). The energy absorption density of SMA3 is larger than that of SMA2, SM1 and SMA3.In the re-entrant hexagonal structure,the structure has the best energy absorption density at an angle of 22.5◦and a relative density of about 18.6% for the same height of the cell.
4.4. Effect of cell heights
Samples SM1, SMH2, SMH3 and SMH4 were studied to determine the effects of the honeycomb cell height on the impact resistance of a re-entrant structure under quasi-static(0.0008 s-1)and dynamic compression (900 s-1,1100 s-1,1300 s-1,1500 s-1).
4.4.1. Quasi-static compression results
The cell height in re-entrant hexagonal honeycomb structures is an important parameter that can affect the impact resistance of the overall material [40]. Fig. 14 shows the quasi-static stress-strain curves for samples SM1,SMH2,SMH3,and SMH4.In general,SMH2 had the highest stress for a given strain and the steepest slope in the linear region. The compression moduli of SMH2, SM1, SMH3,and SMH4 were 95.42 MPa,30.94 MPa,27.95 MPa,and 18.78 MPa,respectively, and their peak stresses were 6.25 MPa, 2.74 MPa,1.71 MPa,and 1.22 MPa.The parameters characterizing SMH2 were more than twice of SM1.The peak strains of SM1,SMH2,SMH3 and SMH4 were 9.45%, 6.54%, 9.31%, and 9.78%, and the critical compaction strains were 44.5%, 41.08%, 46.3%, and 42.87%, respectively.It was therefore concluded that as the cell height increased,the compression moduli and peak stress decreased, and the peak strain of the structure gradually increased.As the height of the cell increased, the hollow part of the structure increased within the same volume of the overall structure,thus reducing the strength of the structure so that failure and collapse were more likely to occur.This was because the increasing cell height created a growing space between the upper and lower surfaces of the cell;meanwhile,there was a larger deformation space relative to the structure with a small cell height, which postponed the structure's peak strain.
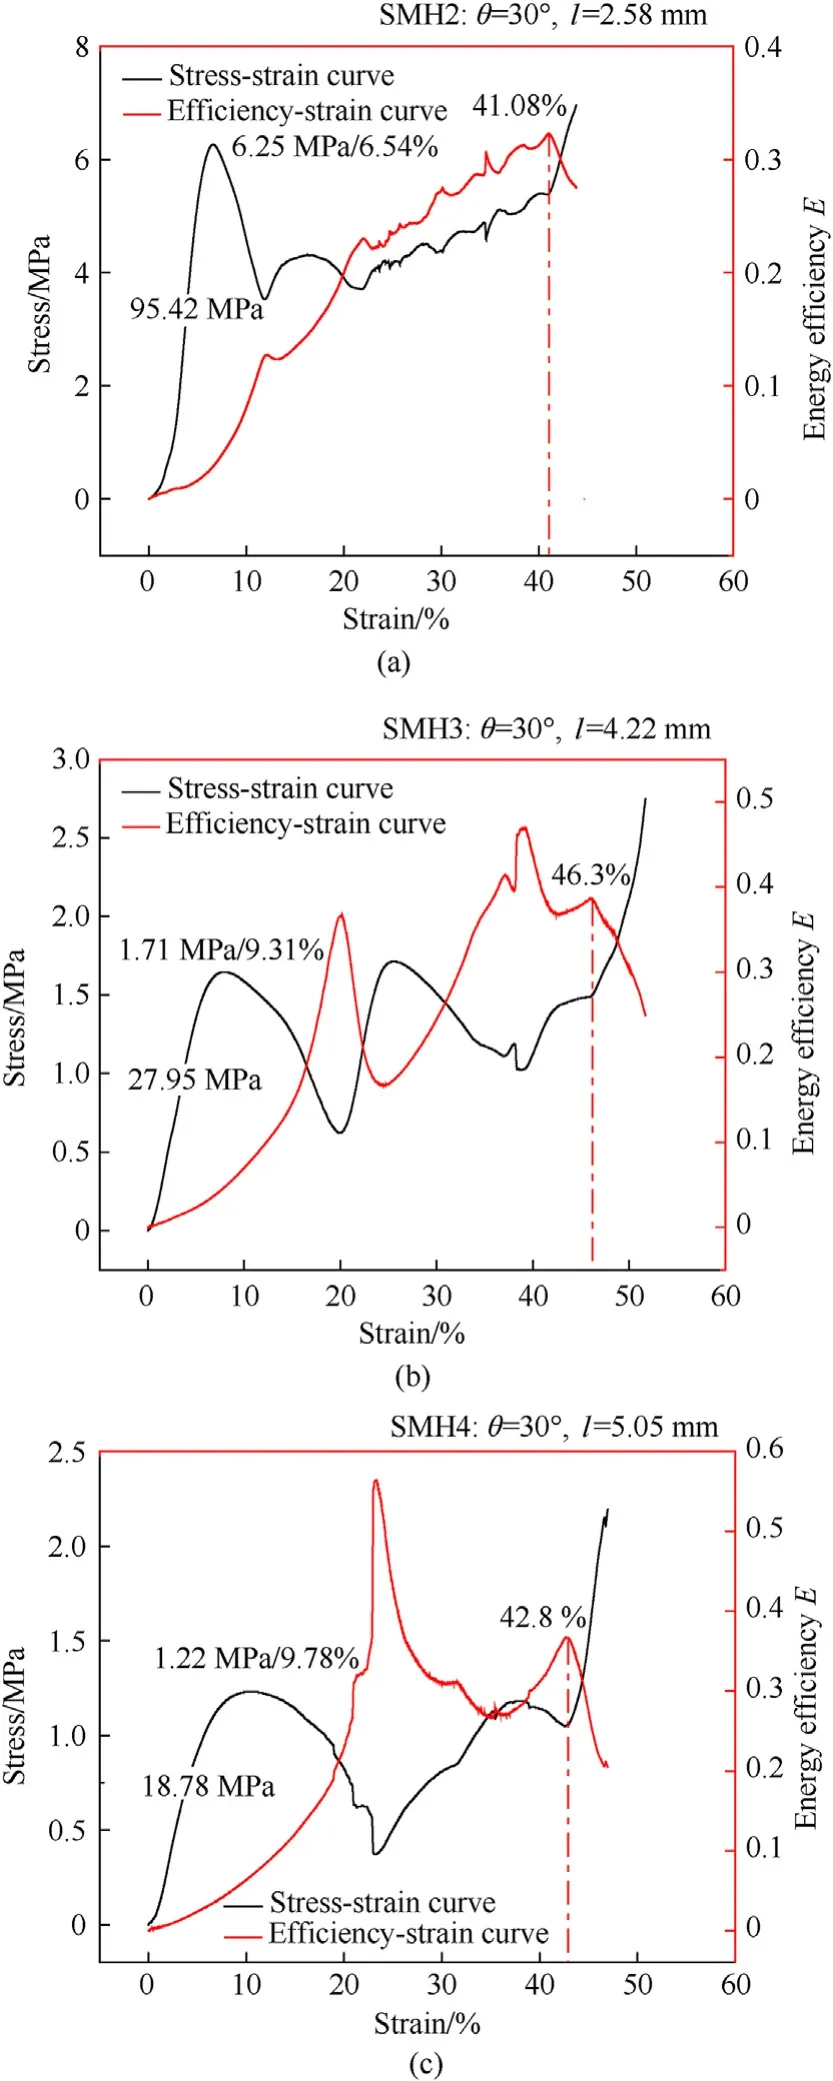
Fig. 14. Stress-strain curves of samples with different angles under quasi-static compression: (a) SMH2; (b) SMH3; (c) SMH4. (Graph includes compressive modulus,peak stress, peak strain, critical compaction strain).
4.4.2. SHPB dynamic impact results
Fig. 15 presents the stress-strain curves of samples with different cell height at strain rates of 900 s-1,1100 s-1,1300 s-1,and 1500 s-1. When strain rate 1500 s-1, the peak stresses are 25.44 MPa for sample SMH2,16.57 MPa for sample SM1, 7.96 MPa for sample SMH3,and 6.07 MPa for sample SMH4,respectively.As the cell height increases, the strength of the structure gradually decreases. This conclusion remains similar to the results at quasistatic.

Fig. 16. The relation of non-dimensional peak stress to (Cell angle = 30◦, cell height = 2.58/3.4/4.22/5.05 mm).
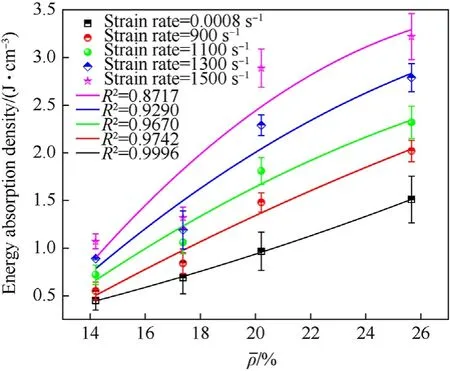
Fig. 17. The relation of energy absorption density to (Cell angle = 30◦, cell height = 2.58/3.4/4.22/5.05 mm).

Fig.18. Dynamic enhancement factor (DIF).
The plots in Fig.16 show the relation of non-dimensional peak stress to relative density of SM1SMH2SMH3and SMH4When the other design parameters of the structure are the same and the cell heights are different, the non-dimensional peak stress of the structure gradually increases with the increase of the relative density. Whenincreases from 14.2% to 25.66%, the non-dimensional peak stress increases about 0.0515 the strain rate 1500 s-1,which is 3.65 times compared to quasi-static compression. When the strain rates increase from 0.0008 s-1to 1500 s-1, the non-dimensional peak stress increase 3.1 times for sample SMH2, 5.05 times for sample SMH3,5.04 times for sample SM1,and 3.97 times for sample SMA4.
Fig.17 shows the energy absorption of these four structures at four strain rates.At 1500s-1, the structures reached the maximum energy absorption values of 3.22 J/cm3, 2.89 J/cm3,1.32 J/cm3and 1.07 J/cm3, respectively, and the energy absorption efficiency was ranked as SMH2>SM1>SMH3>SMH4,indicating that the energy absorption efficiency of the structure gradually increased with the increase of the cell height.The potential causes of this observation have been analyzed. One is the structural effect: the larger the simultaneous deformation, the stronger the structural energy absorption effect, and the longer the time to enter the dense phase.Another is the matrix material,which is rate-related,meaning that the higher the strain rate,the sooner the metal material enters the plastic flow and depends on plastic deformation to consume impact energy.
4.5. Effect of strain rates
Fig. 18 summarize the DIF of the honeycomb structures with different shapes and design parameters at different strain rates.The DIF values increased with increasing strain rate due to the substrate material TC4,which is a material with significant strain rate effect.The DIF values of SM1, SMT2, and SMT3 fluctuated between 4.88 and 6.05, 6.61—7.95, and 3.61—3.84, respectively. The dynamic enhancement relationship of the three structures was:SMT2 > SM1 > SMT3. This result indicated that the regular quadrilateral structure and the re-entrant hexagonal structure experienced clear strain rate effects, while the regular hexagonal structure experienced no obvious strain rate effect. There are two main reasons for this result;the first is related to the base material TC4, which is a strain rate-related metal with aDIF> 1.6. The second reason is the structural failure mode. During dynamic impact,the beams of SMT2 were in the same direction as the impact,thus instantaneously enhancing its strength.The reason for the dynamic enhancement of SM1 was that this structure shrank inward when it was impacted, which increased the equivalent density of the material and enhanced its overall vertical resistance. The dynamic enhancement of SMT3 was less significant than those corresponding to SMT2 and SM1. When subjected to an impact, SMT3 expanded outwards, and the overall vertical resistance of the structure was small,so its dynamic enhancement effect was small.
5. Conclusions
In this study, the strengths and energy absorption densities of honeycomb structures were experimentally investigated and compared. The effects of the topological shape, cell angle, and cell height of the honeycomb structures were also analyzed,leading to the following conclusions:
(1) The re-entrant hexagonal shape effectively enhanced the energy absorption and impact resistance of the material.The effect of a negative Poisson ratio facilitated the compression in both the vertical and horizontal directions under impact loading.The equivalent density increased as the cells formed an “X"-shaped compact zone, queered, and shrunk toward the crushing area. This deformation mechanism supported the in-plane impact resistance of the honeycomb structure.
(2) When the cell height is fixed and the cell angle is changed,the energy absorption of the structure increase and then decrease as the relative density increase. The mechanical properties of the structure are optimal when the relative density is about 18.6% and the cell angle is 22.5◦. When the cell angle is fixed and the cell height is changed, as the relative density increases, the energy absorption of the structure gradually increases.
(3) Under various impact strain rates, the structure exhibited different response characteristics,and the design parameters of the structure also affected its response mechanism.Compared with the regular hexagonal structure,the regular quadrilateral and the re-entrant hexagonal structures'strengths experienced more obvious strain rate effects.
Future studies regarding structural designs for high-speed impact, the re-entrant hexagonal honeycomb represents the preferred mechanical structure. In addition, such structures are most likely to exhibit excellent mechanical properties when the cell angle is 22.5◦and the cell height is minimized to meet the lightweight requirements.
Declaration of competing interest
The authors declare that they have no known competing financial interests or personal relationships that could have appeared to influence the work reported in this paper.
Acknowledgments
This work was supported by the National Natural Science Foundation of China (Grant No. 51874041); and the National Outstanding Youth Science Fund Project of National Natural Science Foundation of China (Grant No.52202012).
杂志排行

Defence Technology的其它文章
- A review on lightweight materials for defence applications: Present and future developments
- Study on the prediction and inverse prediction of detonation properties based on deep learning
- Research of detonation products of RDX/Al from the perspective of composition
- Anti-sintering behavior and combustion process of aluminum nano particles coated with PTFE: A molecular dynamics study
- Microstructural image based convolutional neural networks for efficient prediction of full-field stress maps in short fiber polymer composites
- Modeling the blast load induced by a close-in explosion considering cylindrical charge parameters