Modeling the blast load induced by a close-in explosion considering cylindrical charge parameters
2023-07-04YiFnLiChenZhnLiHengboXingQinFng
Yi Fn , Li Chen , Zhn Li , Heng-bo Xing , Qin Fng
a State Key Laboratory of Disaster Prevention&Mitigation of Explosion&Impact,Army Engineering University of the PLA,Nanjing,Jiangsu,210007,China
b Engineering Research Center of Safety and Protection of Explosion & Impact of the Ministry of Education, Southeast University, Nanjing,Jiangsu, 211189,China
Keywords:Cylindrical charge Secondary peak overpressure Aspect ratio Orientation Detonation initiation point Blast loading model
ABSTRACT
1. Introduction
The characteristics of blast loading play a key role in structural damage,which has long been a concern in the design of protective structures[1—3].
Yet current methods for the design of protective structures such as UFC 3-340-02 [4] (referred to as UFC in this paper) still essentially assume that the charges are either spherical (for free-air bursts) or hemispherical (for surface bursts), and that all detonations are centrally initiated.However,many explosive charges used in military and civilian applications are cylindrical or rectangular rather than spherical[5].Indeed,conventional weapons are mostly shaped as slender cylinders with typical aspect ratios(defined asL/D,whereLis the length of the cylinder andDis its diameter)of 2—6 up to a maximum of 10 [6], as shown in Fig. 1. Moreover, nonspherical charge geometries will produce different spatial distributions of overpressure and impulse than spherical charge geometries of the same mass, especially within the close-in range. The“close-in explosion” has been defined as the detonation of an explosive charge at a scaled distance Z < 1.2 m/kg1/3[7,8] or Z<1.054 m/kg1/3[9],in which Z can be obtained as R/W1/3,where R is the standoff distance from the center of the charge to the face of the structure and W is the charge mass.

Fig.1. Cylindrical aerial bomb.
Thus, considerable research has been dedicated to the blast loadings generated by cylindrical charges; such research has primarily been conducted through physical experimentation. However, the experimental approach for the investigation of blast loading is typically quite expensive and risky, and the tests are affected by complex factors, so the results generally exhibit considerable scatter that is unfavorable for analysis and subsequent conclusions[6].However,with the advent of high-speed,low-cost computing technologies, finite element software has increasingly been employed to study the properties of blast loading and provide insights into the conclusions drawn by experimental studies.Thus,experimental and numerical analysis results can verify and complement each other.
The differences in the shapes of cylindrical and spherical explosive charges have been observed to result in considerable differences in the characteristics of the resulting blast waves[10],as shown in Fig. 2. The overpressure—time history curves generated by cylindrical charges have frequently been observed to include secondary shocks [6], a behavior that differs from the typically assumed Friedlander curve for spherical charge detonations.Knock et al. [11] reported that blast tests using single-end detonated cylindrical PE4 explosive charges with L/D = 4 produced secondary shock waves in the axial direction (0◦), and found that it was very difficult to predict the secondary peak overpressure from the existing test data.

Fig. 2. Charge shape has a significant effect on the blast loading.
The secondary shock wave phenomenon has also been reported in numerical analysis results by Sherkar et al. [12], Xiao et al. [13],and Gao et al. [14] using cylindrical charges withL/D= 1—5,1—5,and 1—8,respectively,at Z=0.53—4.22,0.5—10,and 0.3—10 m/kg1/3,respectively.However,note that Sherkar et al.[12]and Gao et al.[14]did not account for the secondary shock waves in their impulse calculations, whereas Xiao et al. [13] did. Furthermore, only the maximum values of the primary and secondary peak overpressures(Pcyland P2nd, respectively) were discussed by Sherkar et al. [12],Xiao et al.[13],and Gao et al.[14]in their analyses of the effects of the secondary shock waves. Sherkar et al. [12] found that the axial peak overpressure and impulse associated with the secondary shock wave exceeded those associated with the primary shock wave for cylindrical charges with L/D= 2—5 when Z> 3.9 m/kg1/3.
As a cylinder is symmetrical about its longitudinal axis, the resulting blast loadings are the same regardless of the angle relative to this axis at the same scaled distance. Existing research on the blast loading induced by cylindrical charges at different orientations has therefore focused on the blast loading along various angles in the axial plane of symmetry (plane XOY in Fig. 2).Furthermore, most previous studies, especially those including experimental investigations, only reported results obtained at a small range ofZvalues. Their conclusions may therefore be different or contradictory.
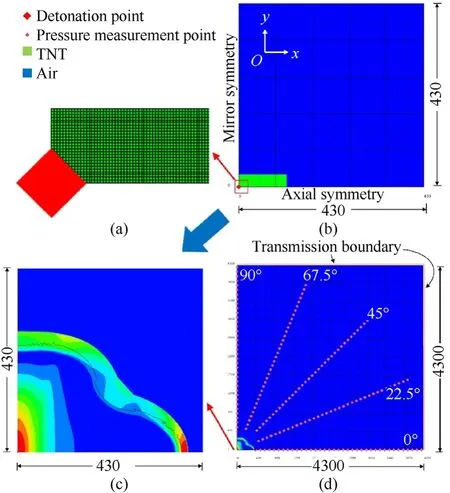
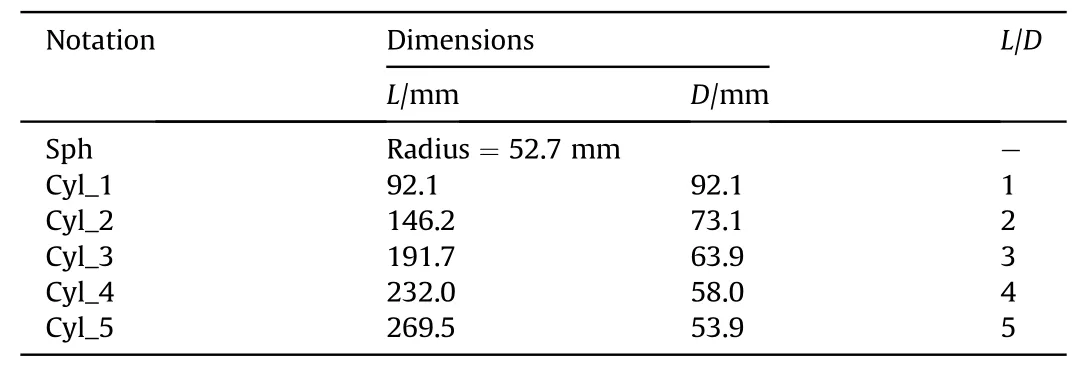
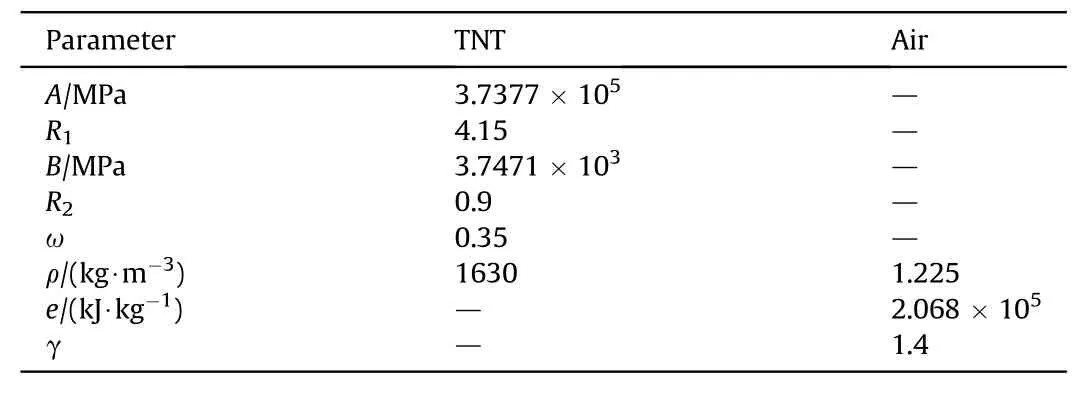
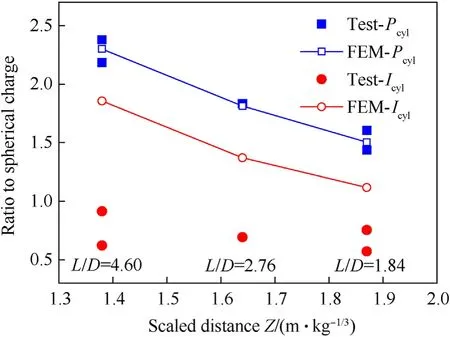
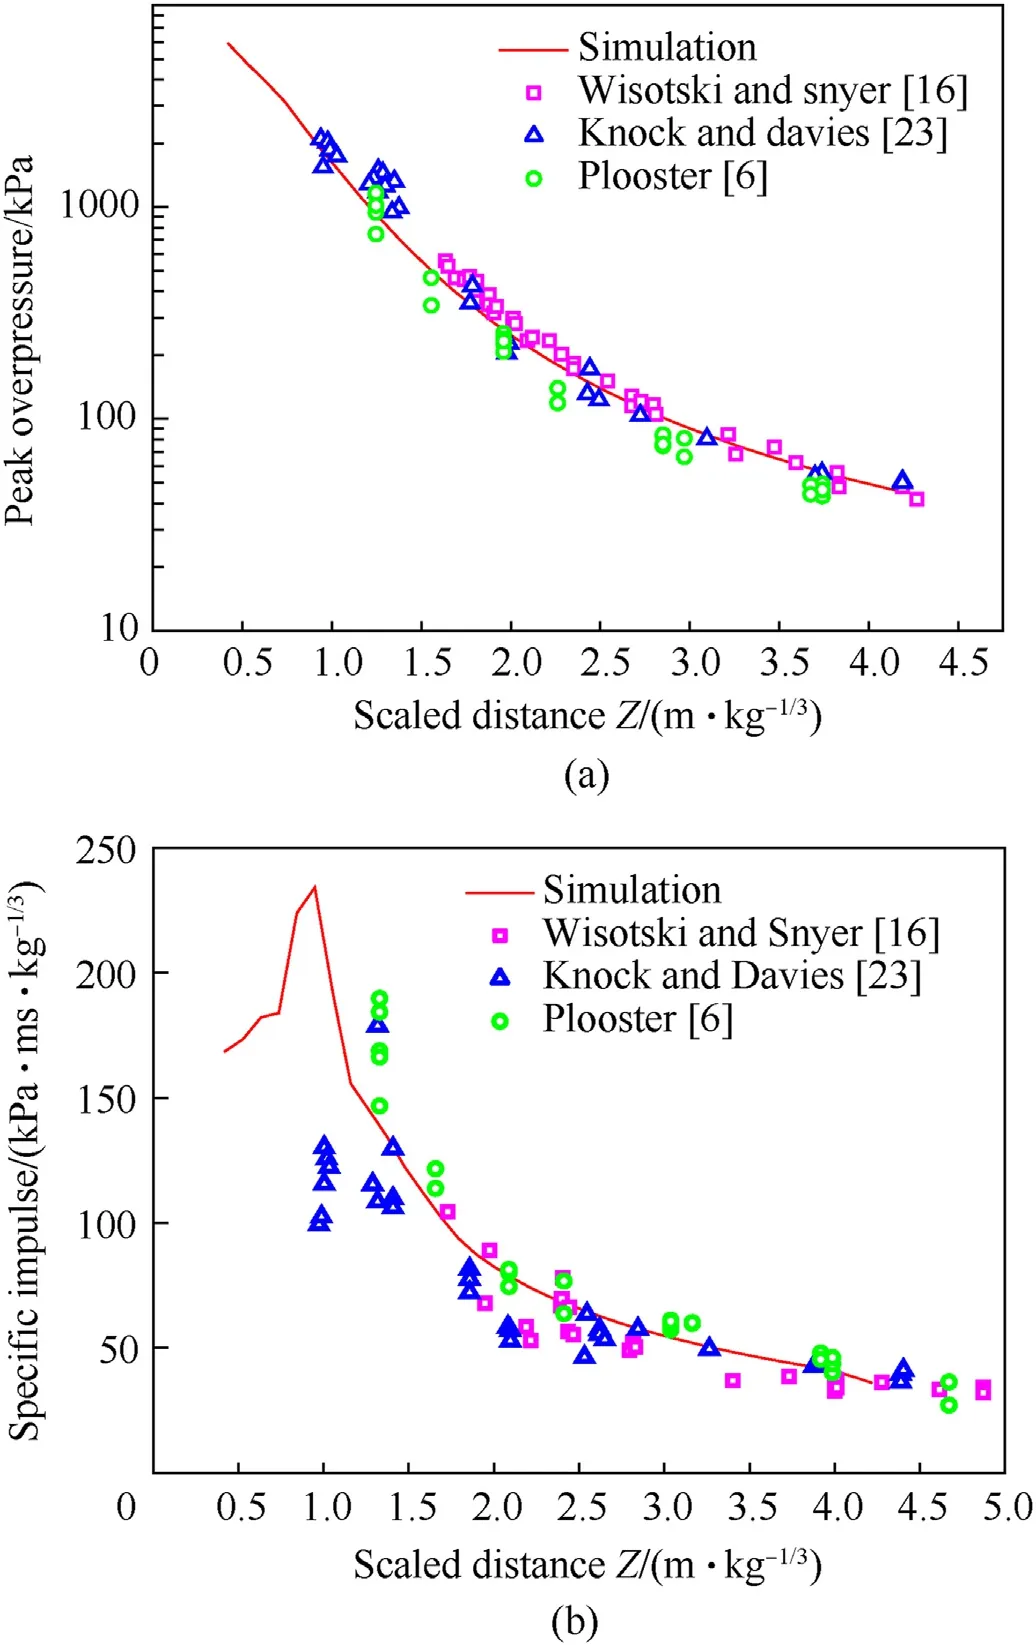
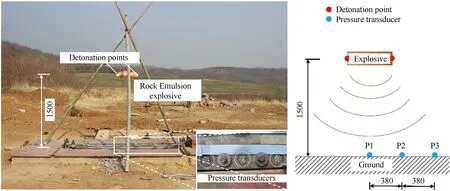
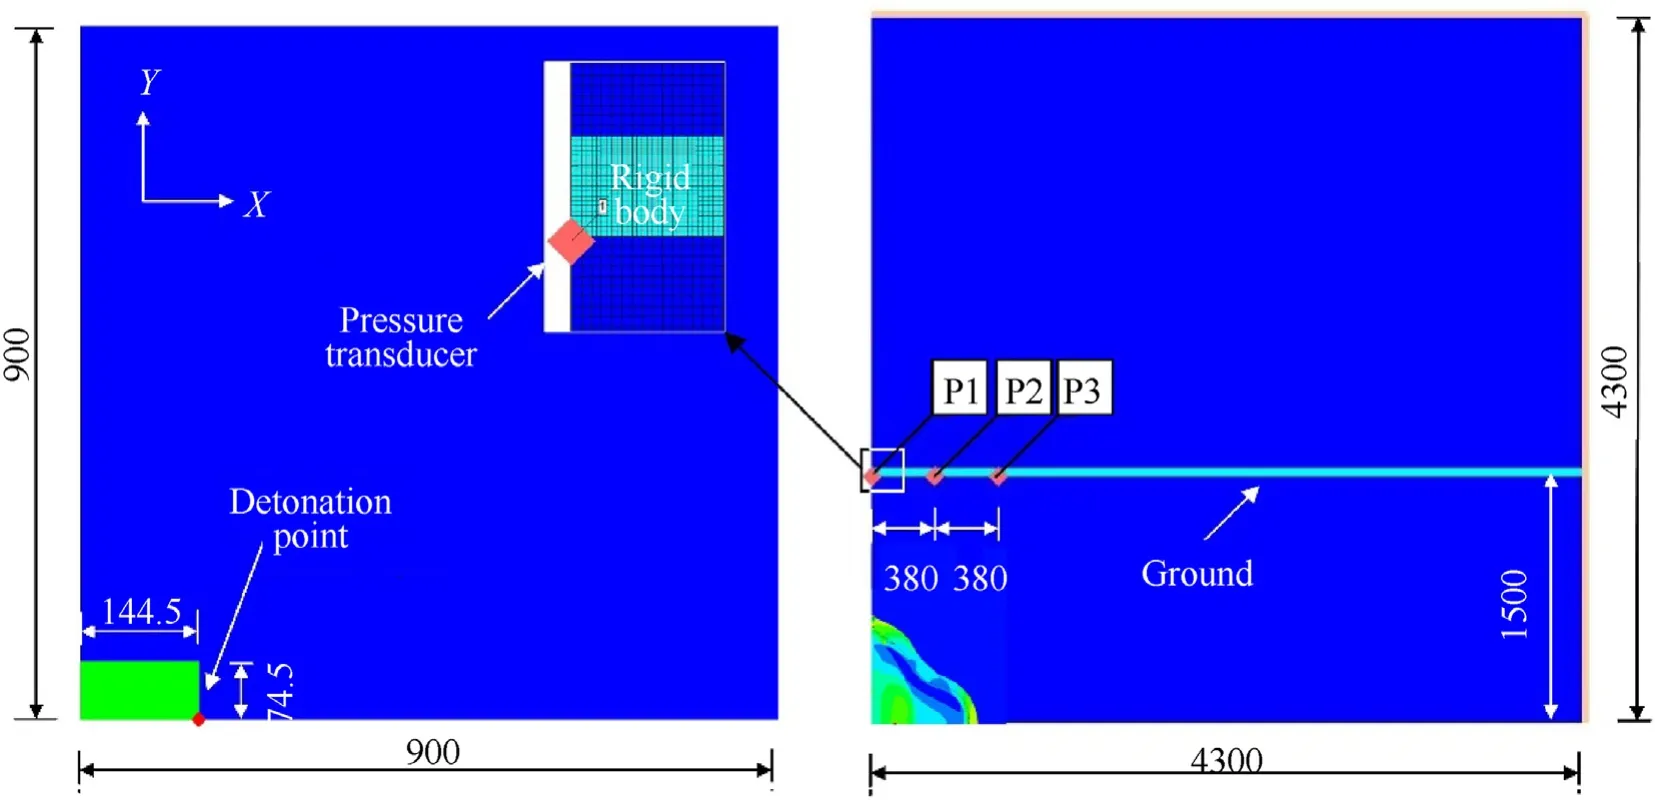
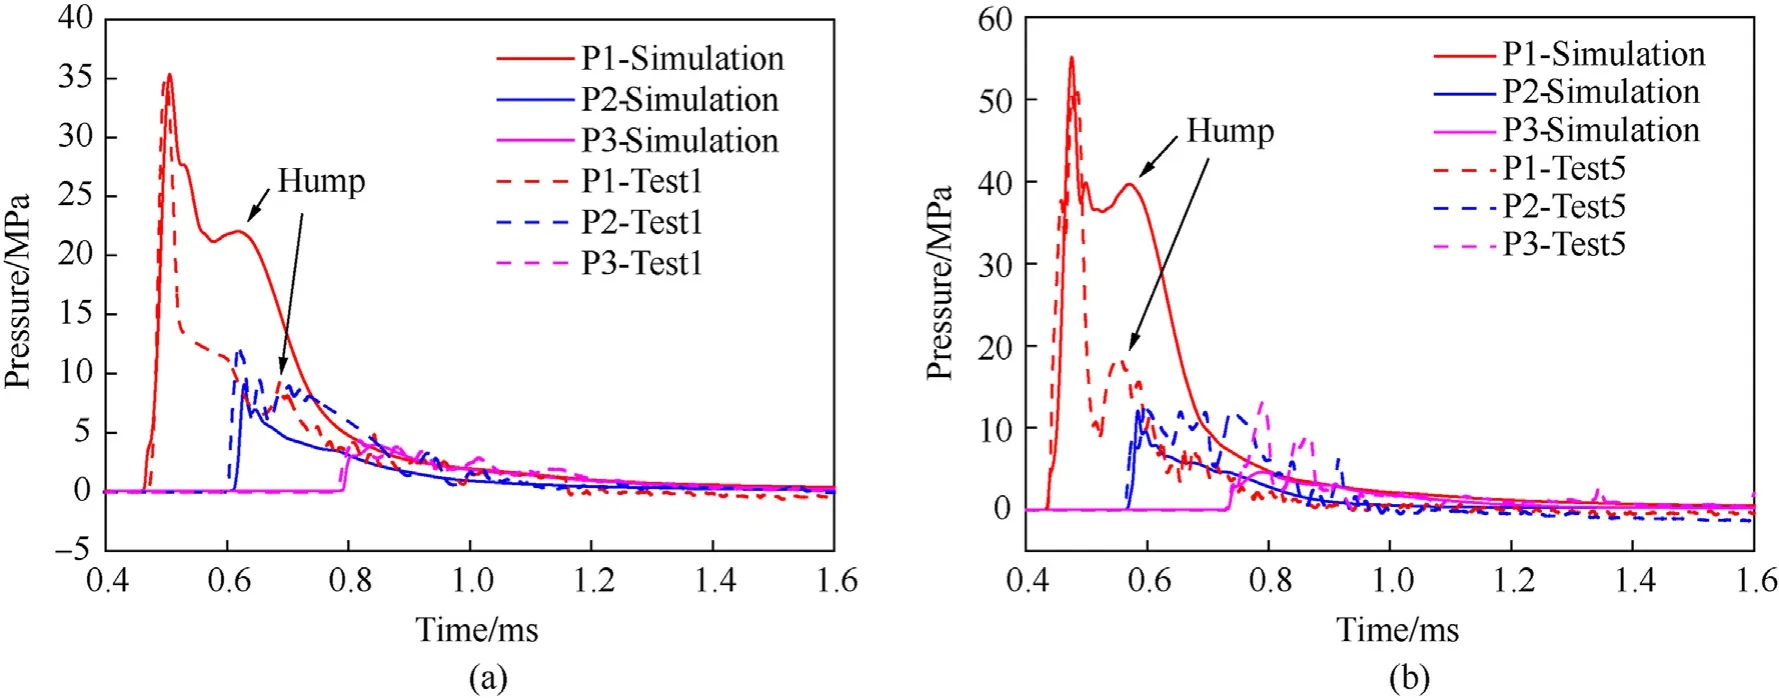
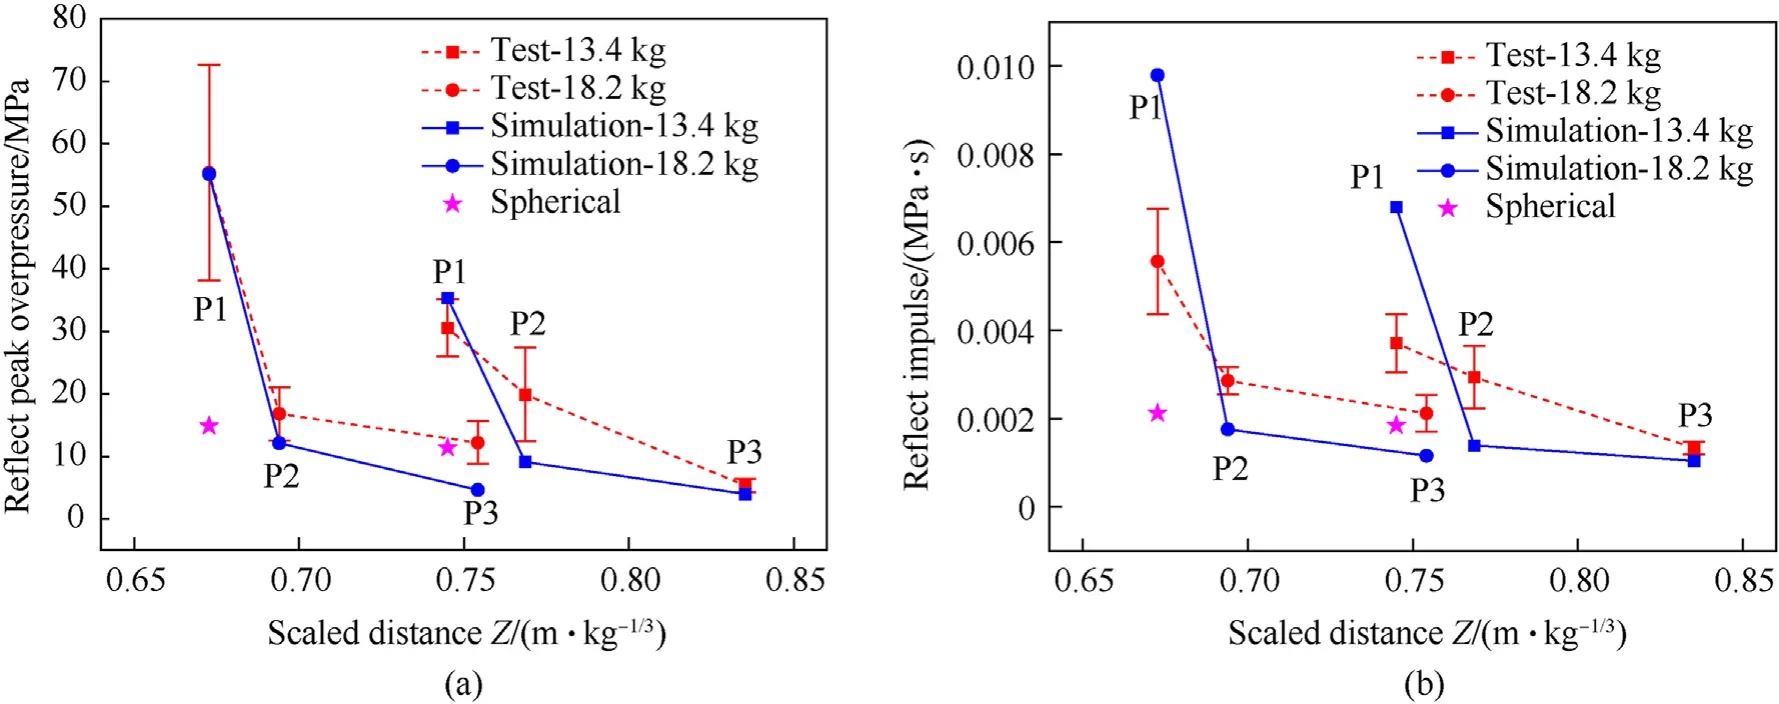
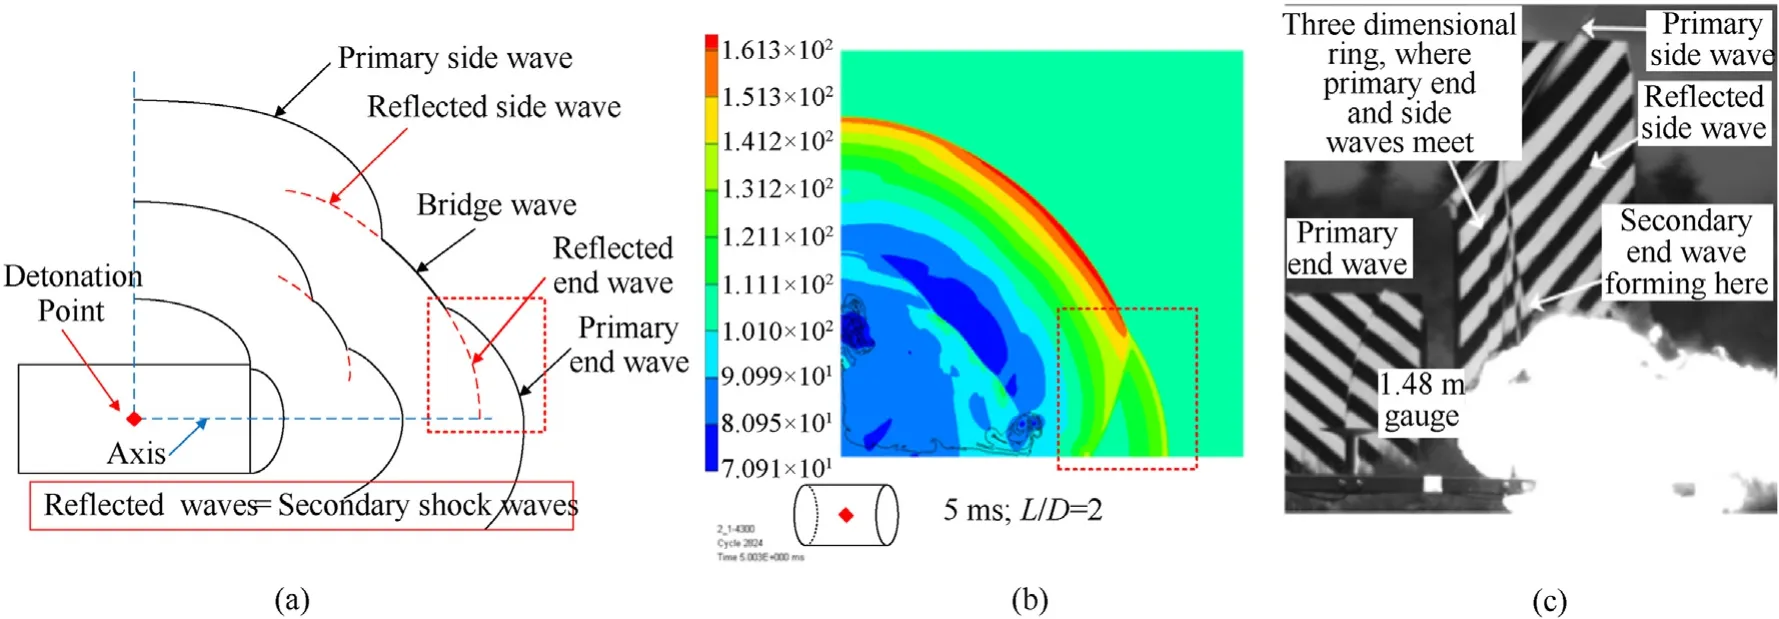
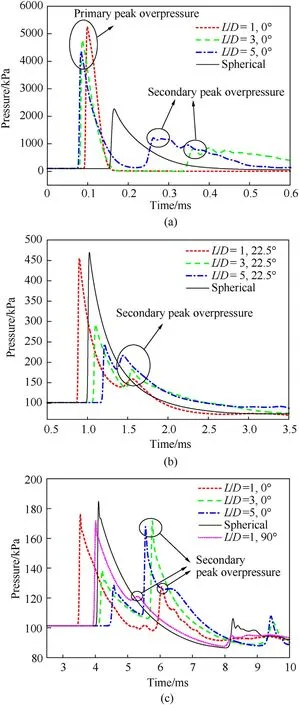
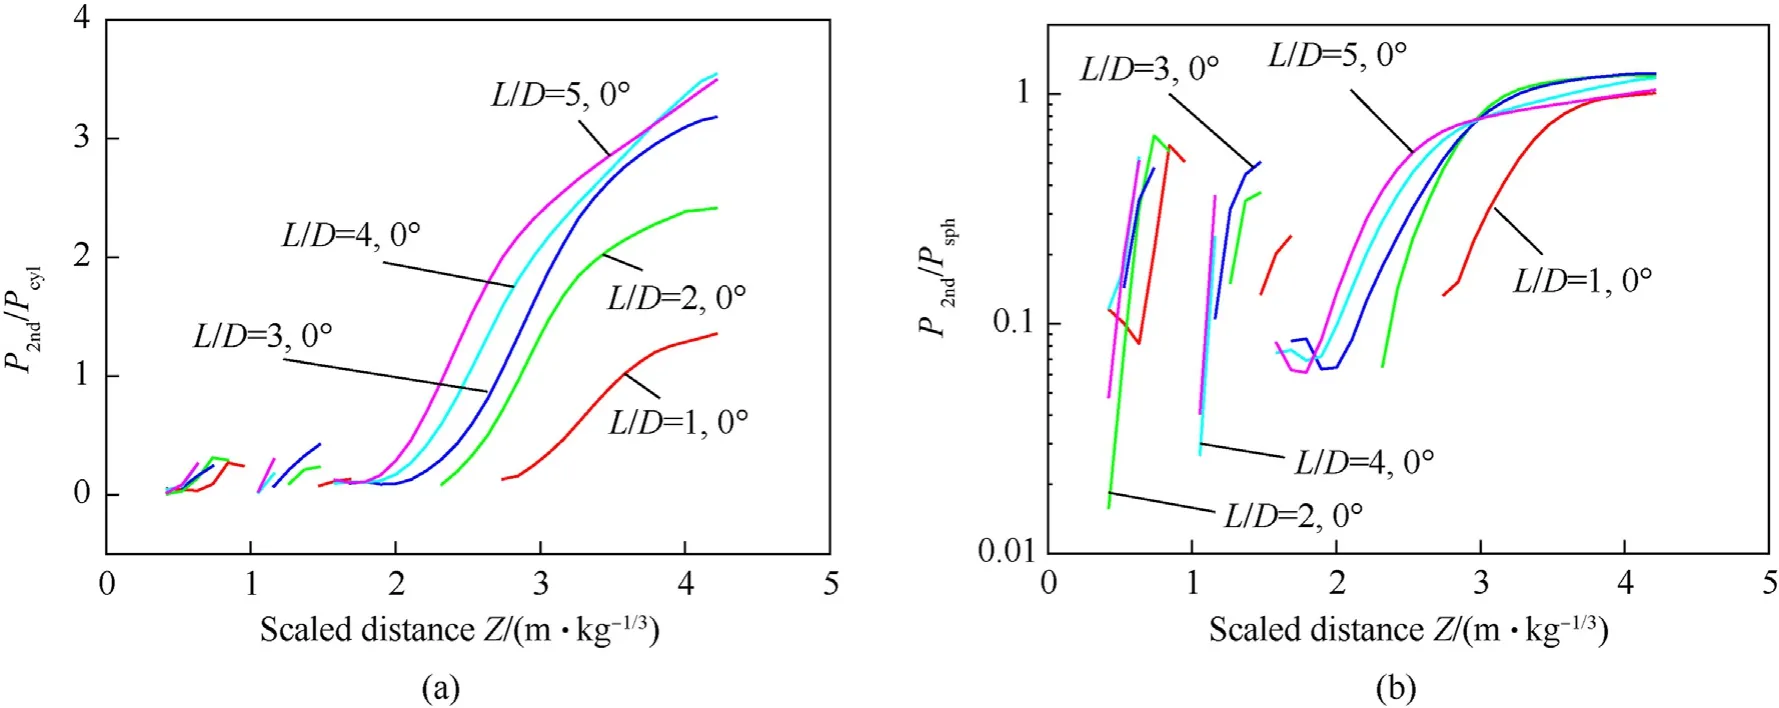
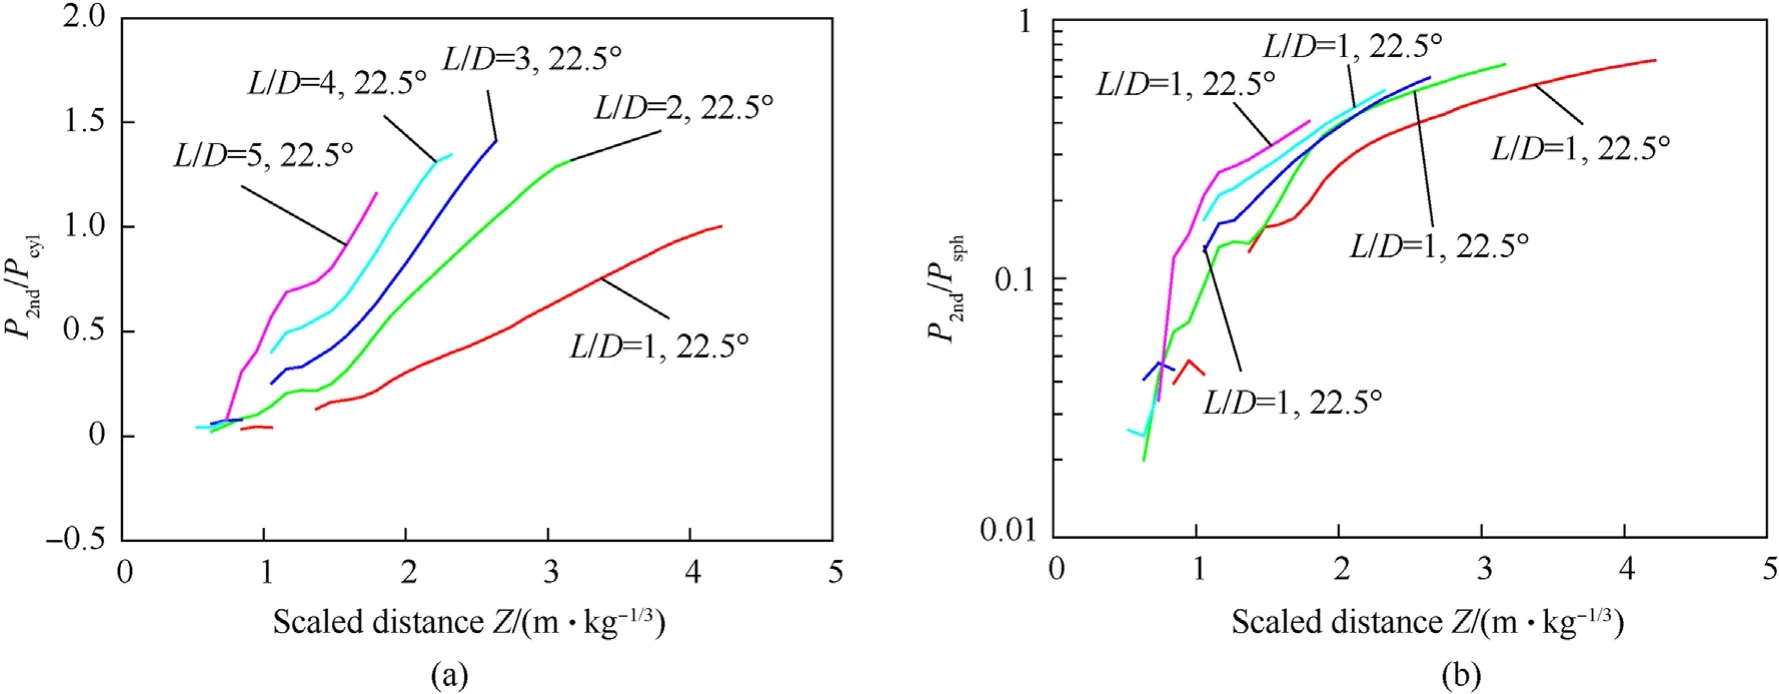
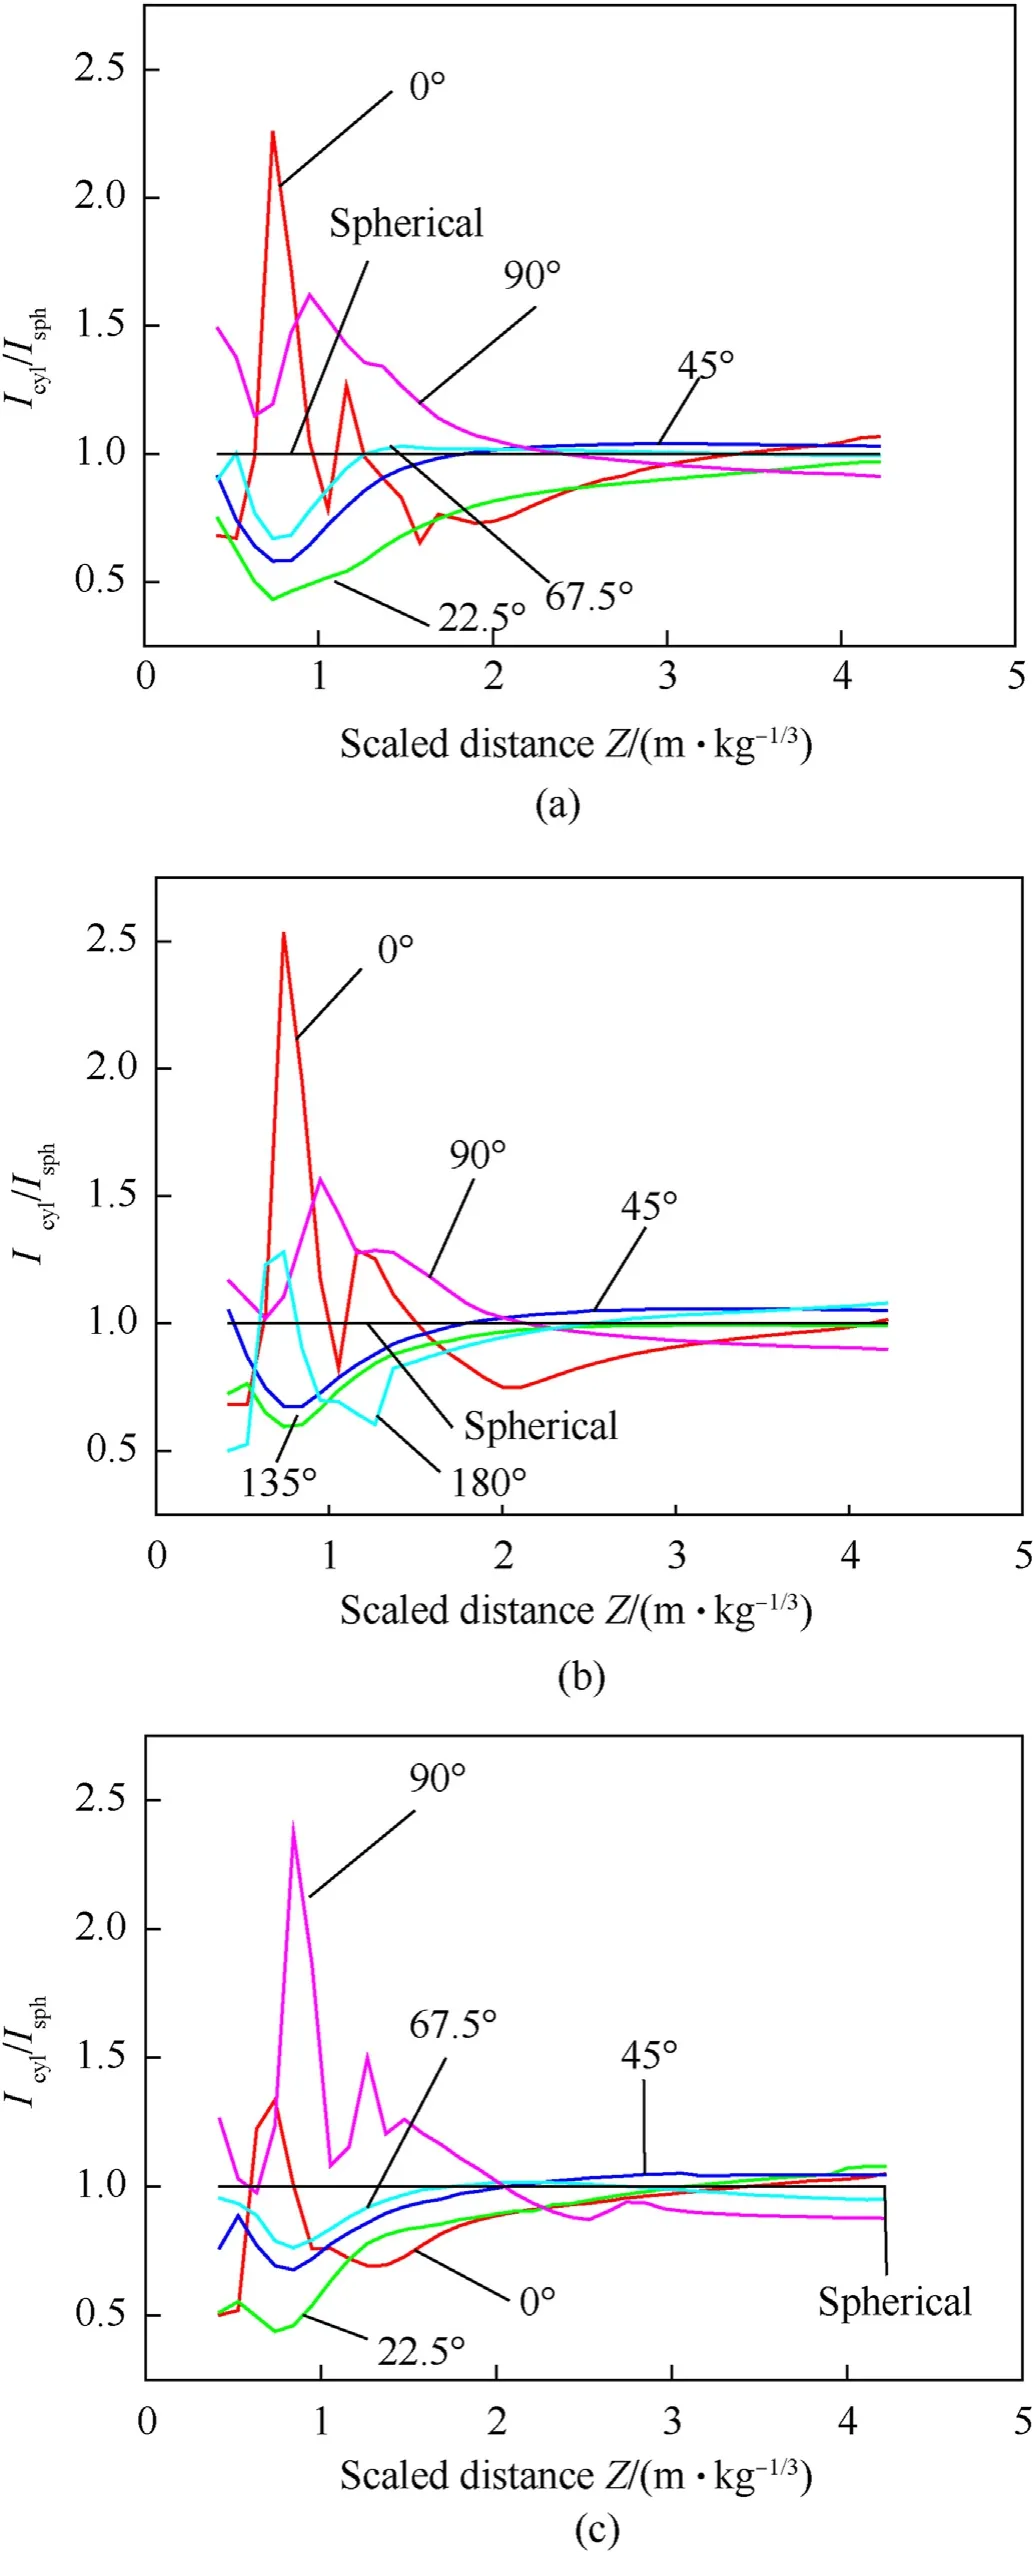
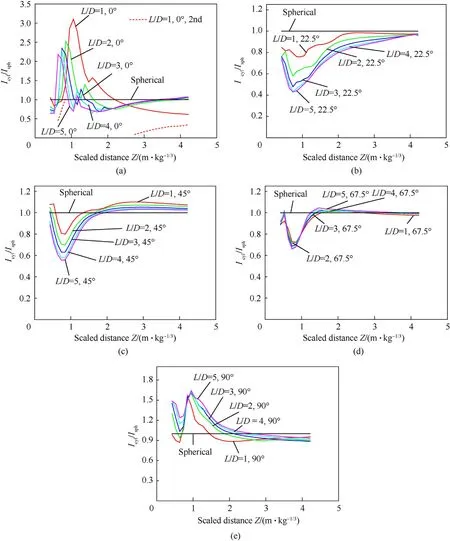
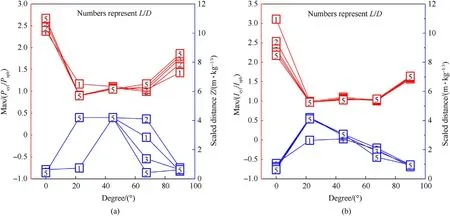
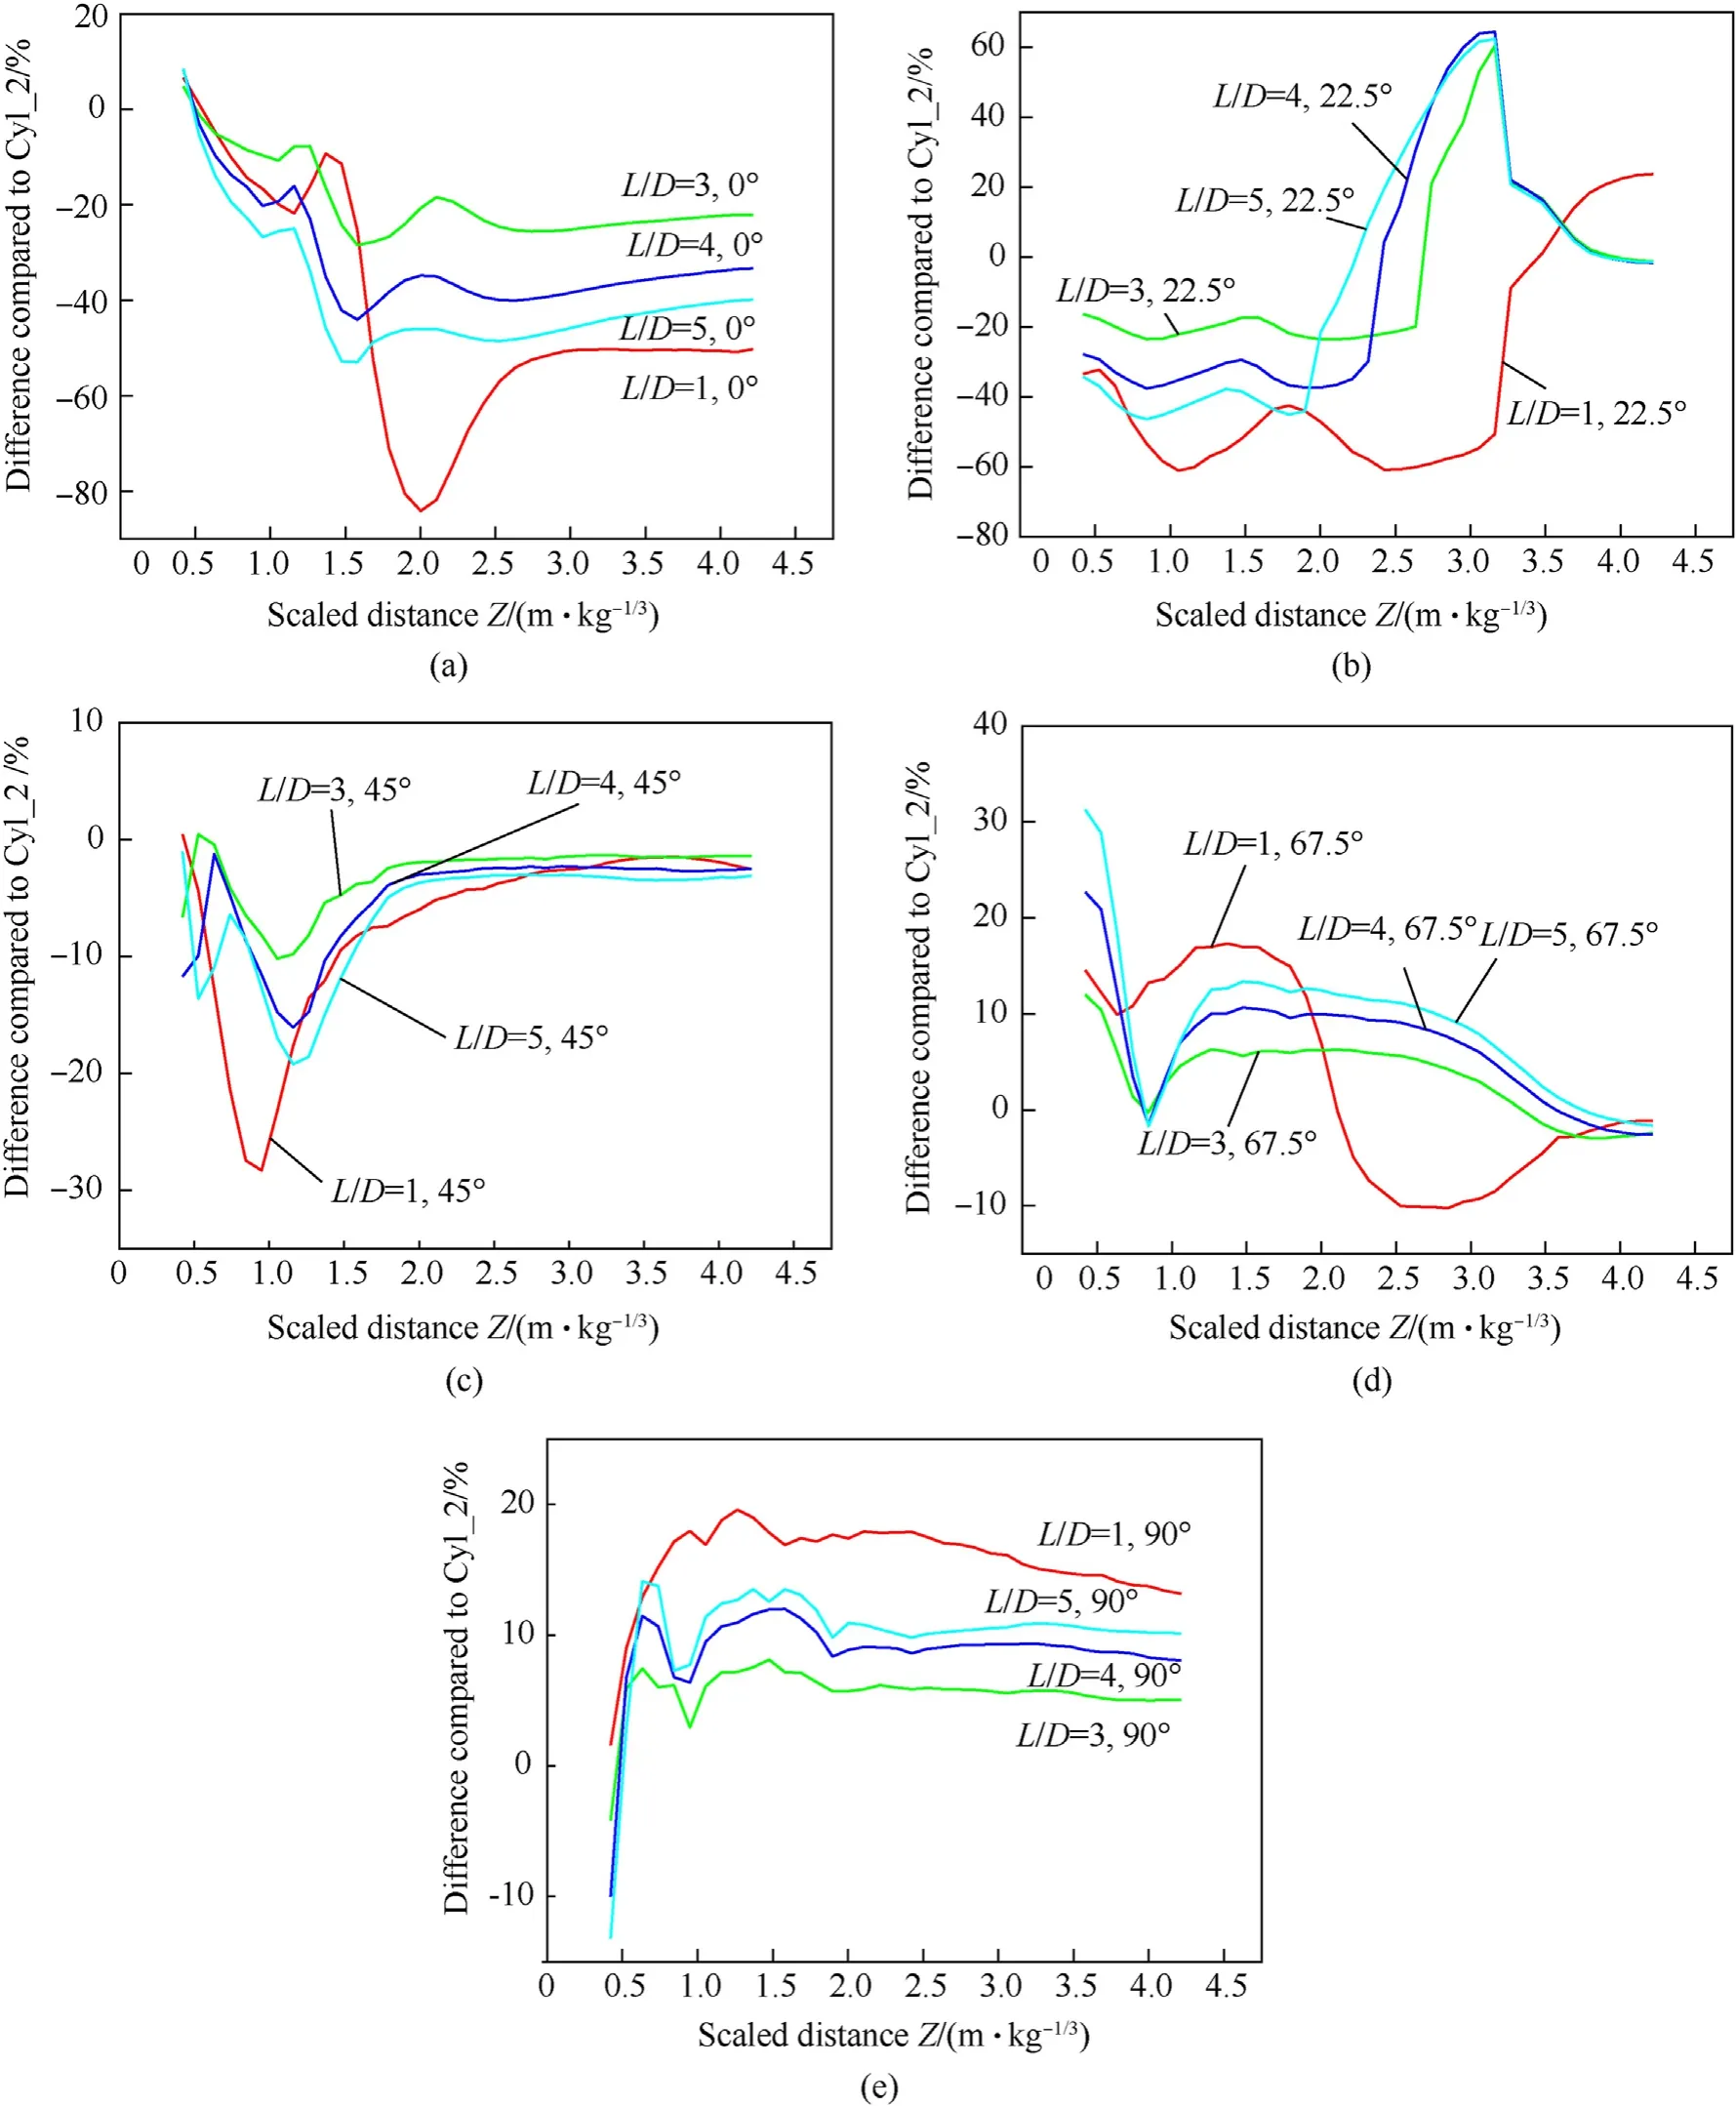
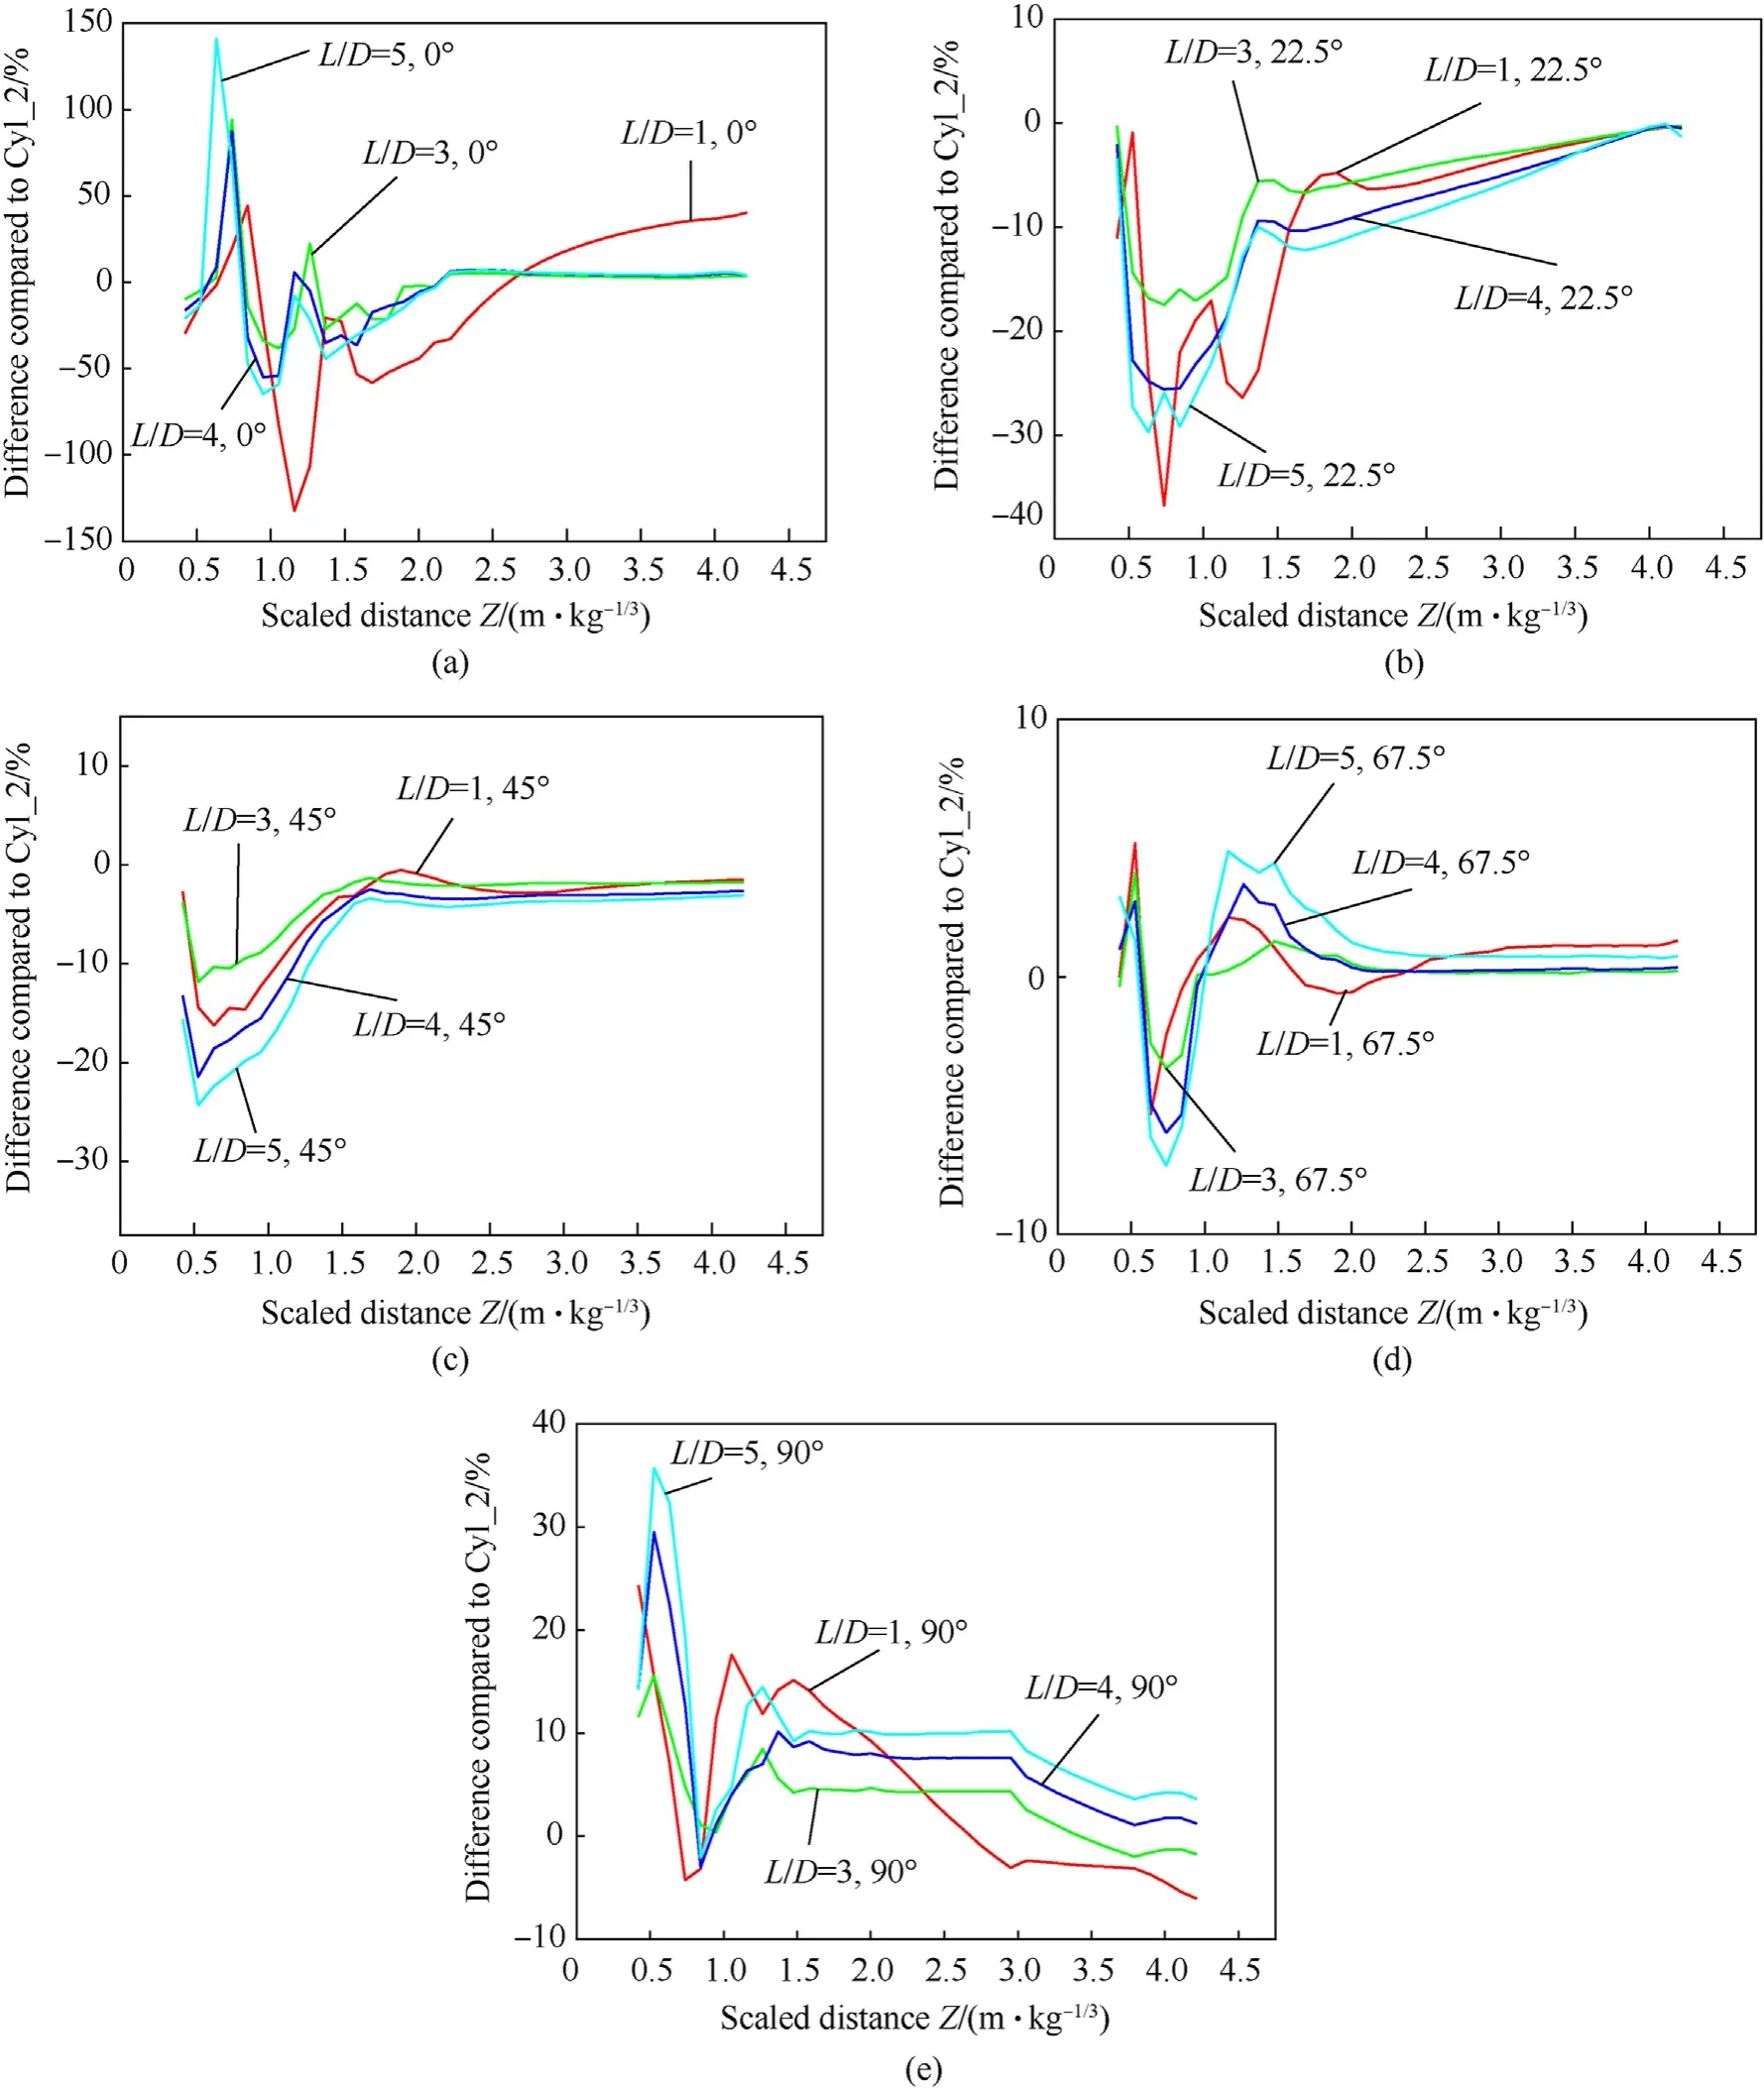
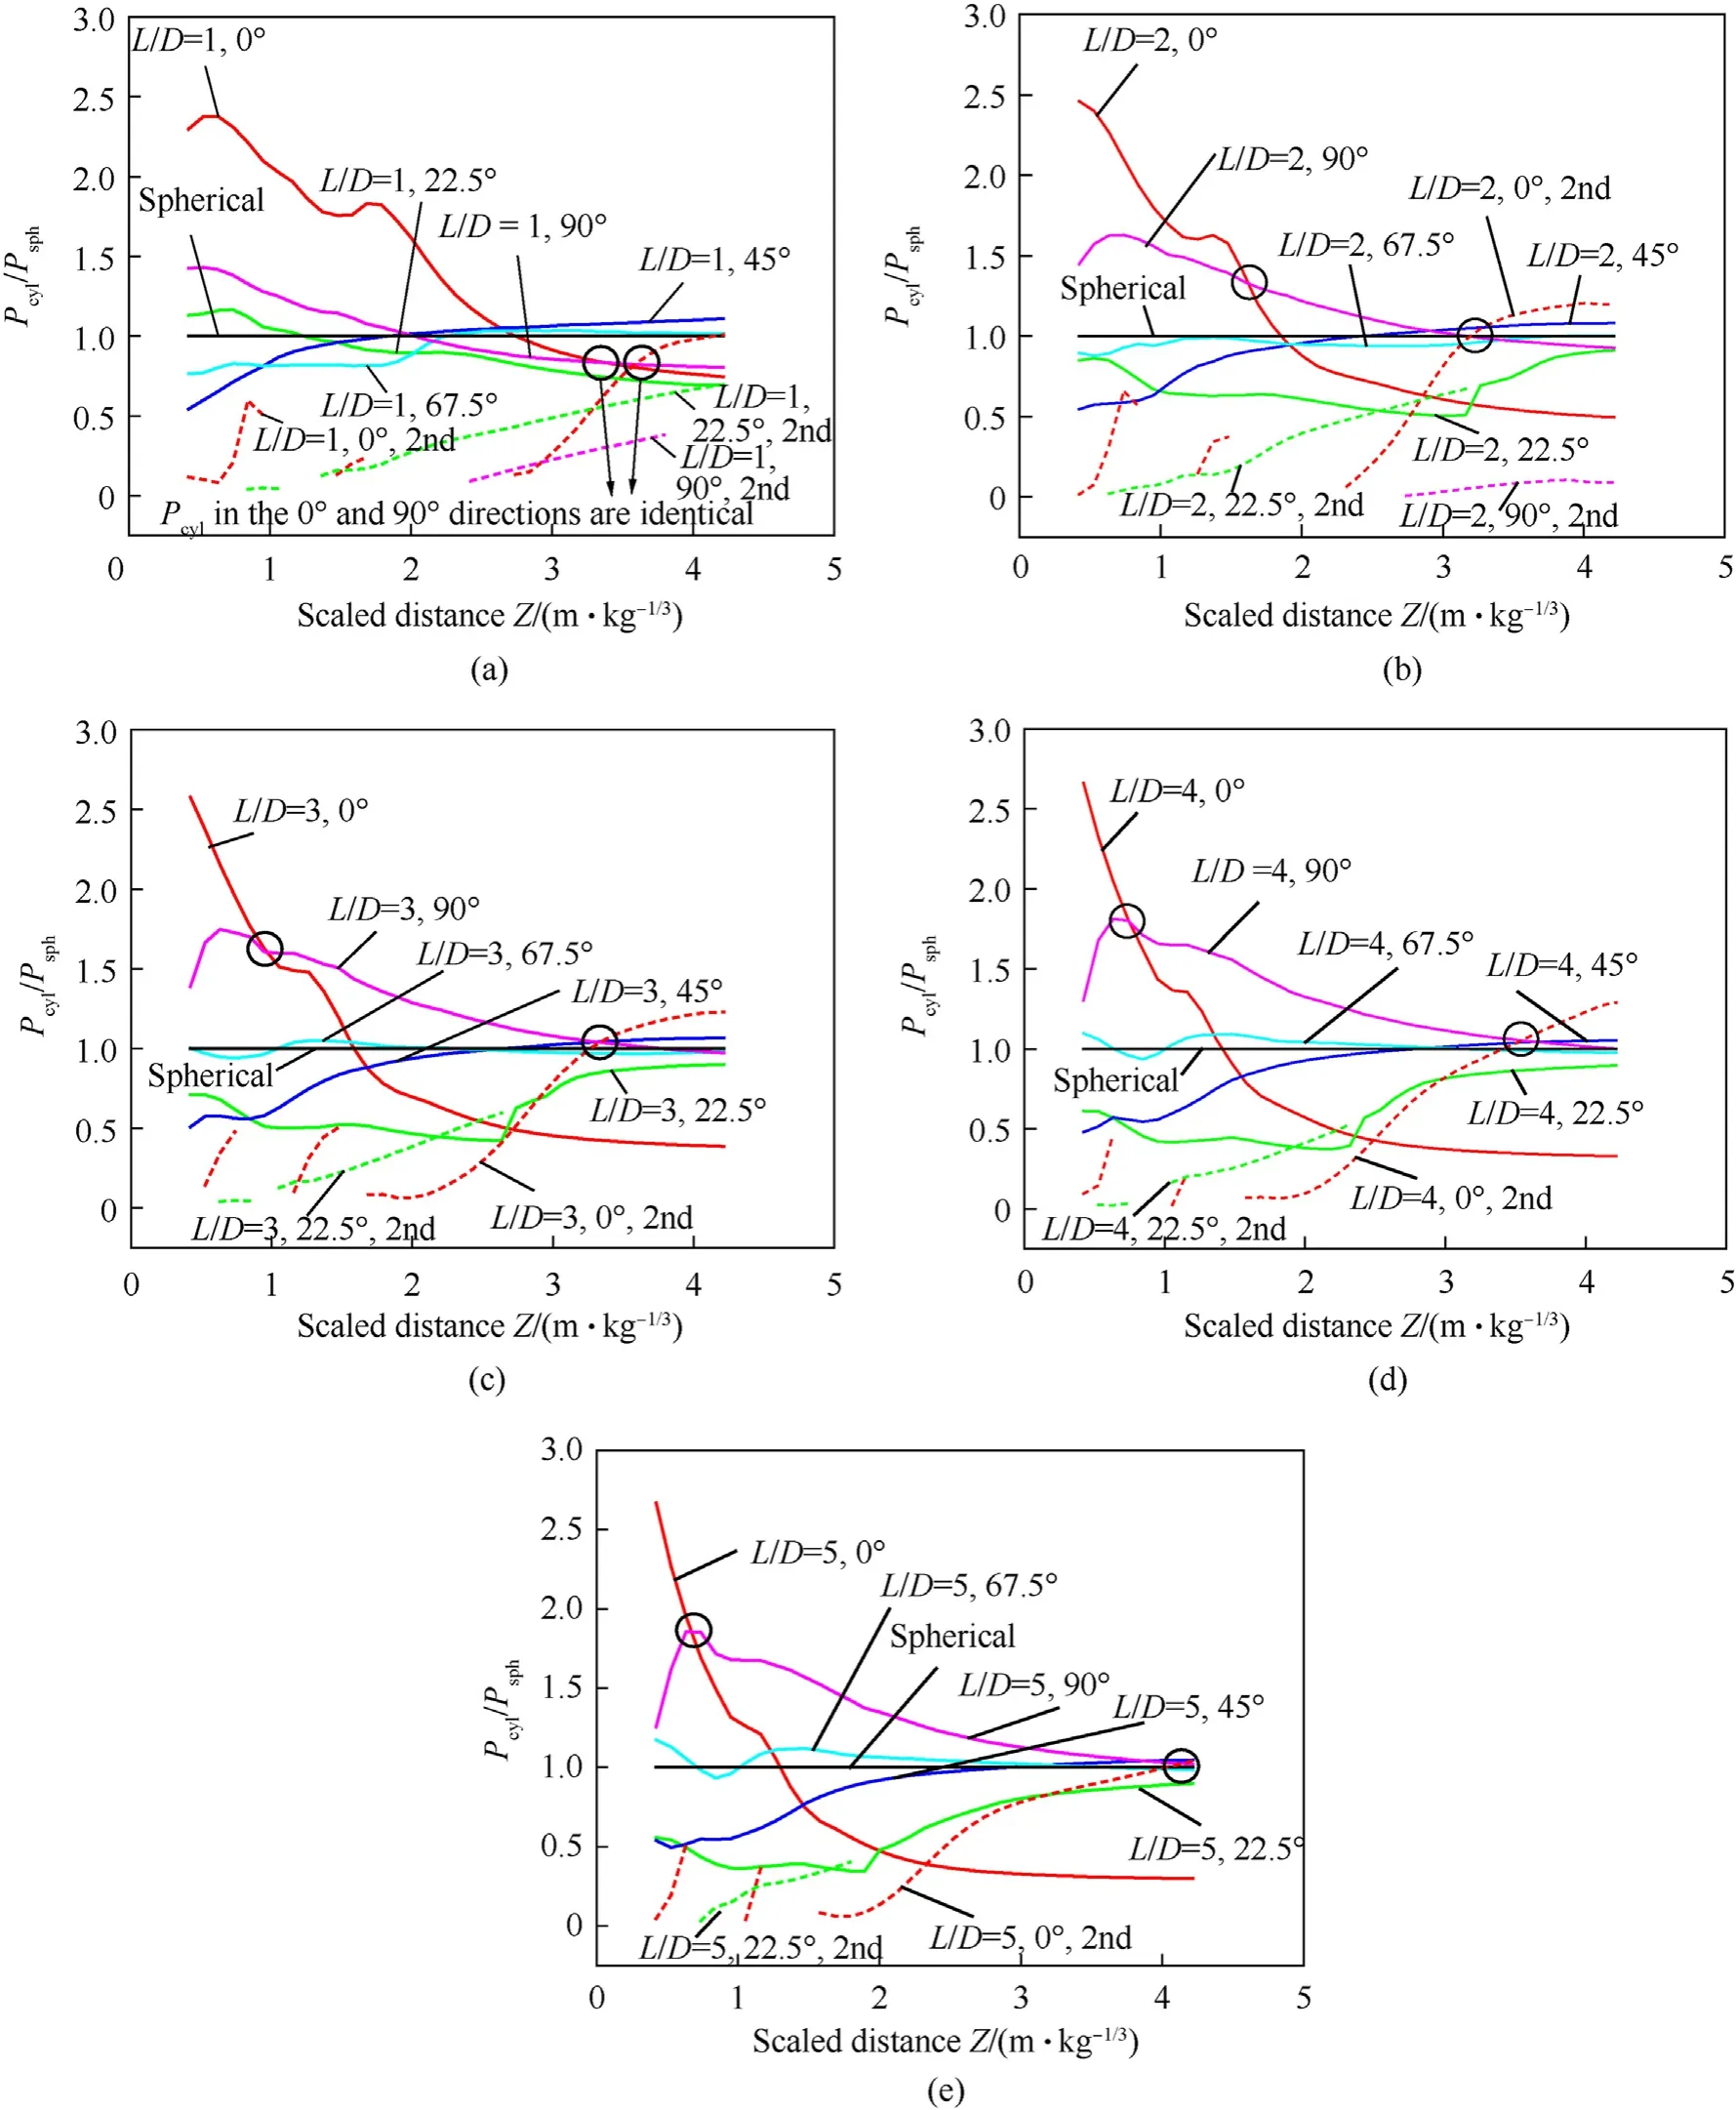
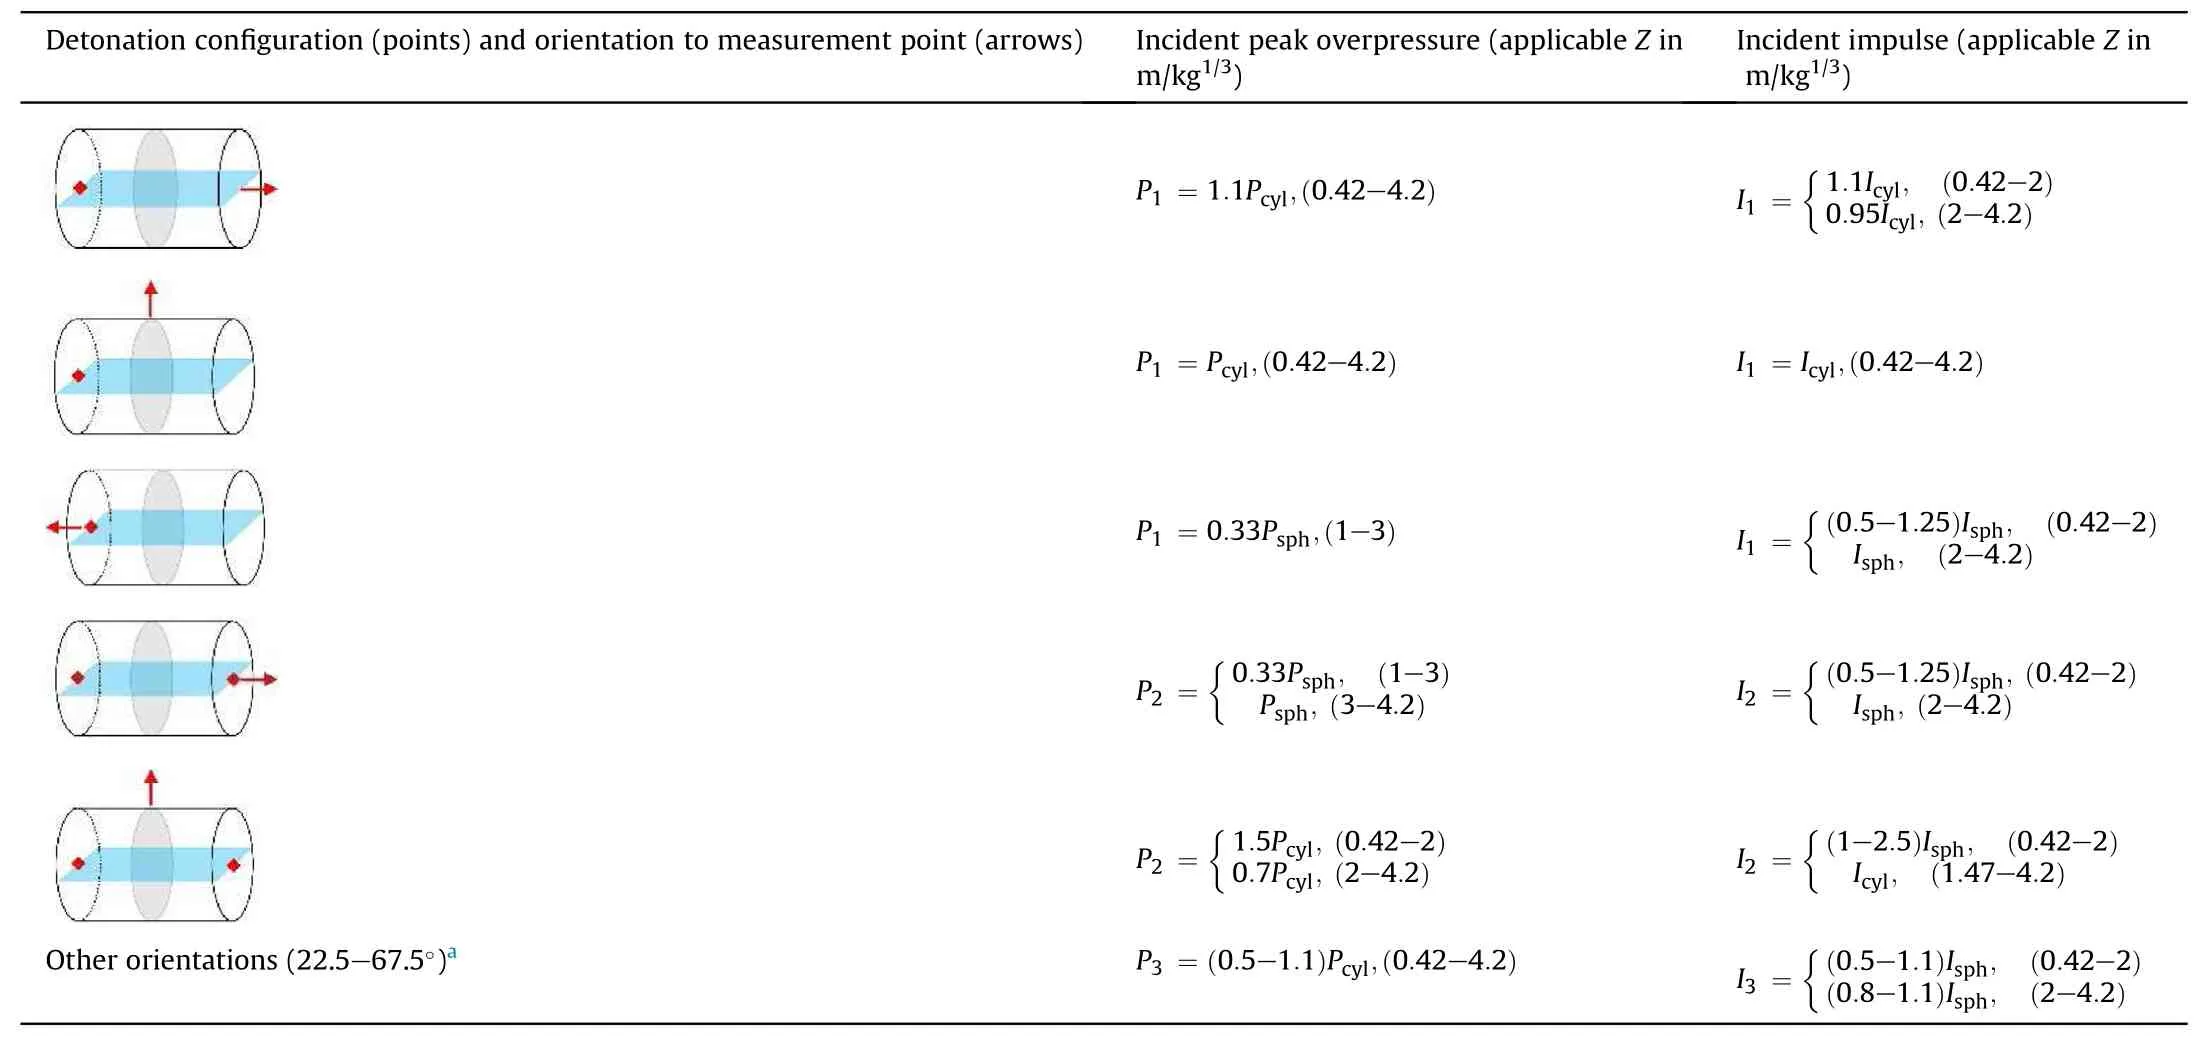
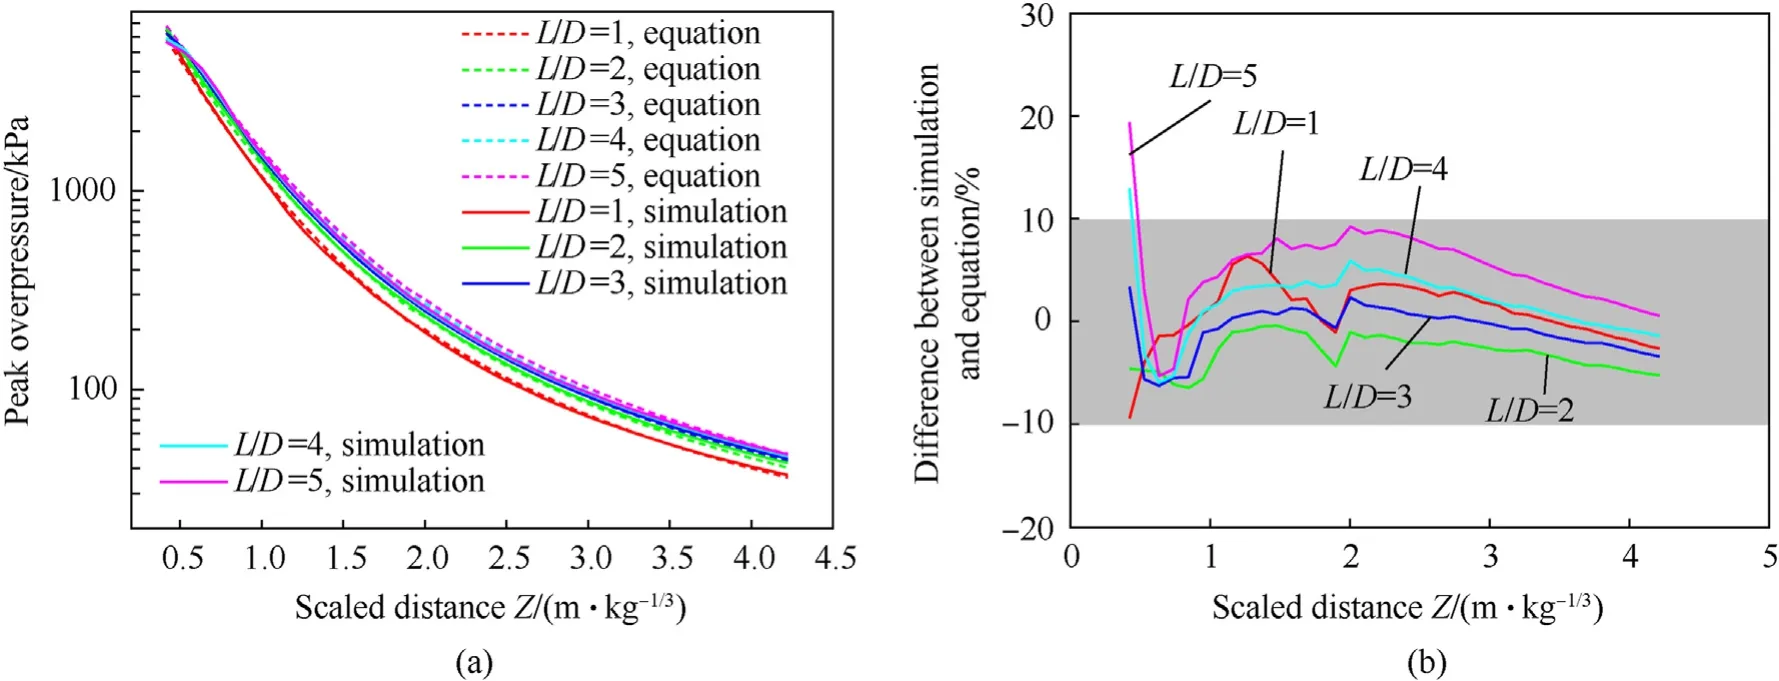
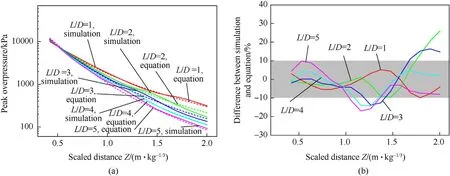
Some studies have found that for cylindrical charges with largeL/Dvalues, more energy is directed in the radial direction (90◦),whereas for those smallL/Dvalues,more energy is directed in the axial direction(0◦)[1].Plooster[6]and Esparza[15]measured the pressure and impulse data along eight angles in the axial plane in 22.5◦increments for single-end detonated cylindrical explosives withL/D=0.25,0.5,1,2,3,4,and 6 at 1.39 Indeed, there have been many studies investigating the blast loading produced by cylindrical charges oriented in the axial and radial directions; however, the blast loading produced in other directions also requires attention. Plooster [6] and Esparza [15]accordingly recorded the pressure—time history curves produced by cylindrical charges in various orientations. Furthermore, Xiao et al. [13] and Gao et al. [14] conducted simulations to compare cylindrical charge blast loadings according to their orientation. All four studies found that the blast loading decreased at measurement angles farther from the axial and radial directions at the same scaled distance. The effect of detonation configuration has also been studied.Cylindrical charges are most easily (and therefore most often)detonated from one end. Wu et al. [1] and Plooster [6] observed that the pressure field resulting from single-end detonation was not symmetrical andPcylwas higher on the end opposite the detonator.Anastacio and Knock[20]found that thePcylin the radial direction resulting from the double-end detonation of cylindrical charges with 0.27 ≤L/D≤5.75 at 1.4 ≤Z≤5.5 m/kg1/3were 1.6 times those resulting from the single-end detonation of the same charges, whereasIcylwas consistent irrespective of configuration.Tham[21]performed simulations of the experiments conducted by Held [18] to predict the interactions of blast waves produced by single-end and double-end detonated cylindrical charges and compared the results, finding that different detonation times at each end of the explosive charge attenuated the maximum impulse.Fan et al. [22] found the maximum amplification ratio of thePcylinduced by a double-end detonation to that induced by a central detonation was around 1.6 at 90◦forZ= ~1 m/kg1/3. Thus, the blast loading produced by a cylindrical charge is determined by itsL/D, orientation, and detonation configuration,especially in the close-in range. Yet there exists a criticalZvalue beyond which these influence factors can be neglected and the blast loads can instead be determined according to a spherical charge with equal mass. Therefore, the influence range of these factors have been numerically investigated in many studies. Sherkar et al.[12]found that the effects of charge shape and detonation configuration can be neglected atZ> 3 m/kg1/3, though orientations at angles between the radial and axial directions were not examined. Xiao et al. [13] found that the effect of charge shape onIcyl(Pcyl)can be neglected atZ>5.7(3.2)m/kg1/3,while the effect of detonation configuration onIcyl(Pcyl) can be neglected atZ> 5.7(3.9)m/kg1/3.Gao et al.[14]found that asL/Dincreased from 2 to 5,the range of influence of charge shape onPcyldecreased toZ<5 m/kg1/3; this critical distance should be more accurate. Furthermore,they found that the effects of charge shape onIcylcan be neglected forL/D≥2 atZ> 3 m/kg1/3. However, these models were not verified using experimental data describing the detonations of cylindrical charges,and only the central detonation configuration was studied. Critically, different conclusions were drawn from these three studies [20—22] owing to the different approaches they employed to consider the effects of the secondary shock wave, as discussed previously in this section. Previous studies have focused on the influence of explosive chargeL/D, orientation, and detonation configuration on blast loading. However, few empirical equations have been proposed to predict the blast load produced by cylindrical charges and even fewer have considered the influence of the chargeL/Dand orientation in their equations, likely owing to the large dispersion and small quantity of test data.Knock et al.[11,20,23—25]proposed the equationPcyl=a/Z+b/Z2+c/Z3to predict thePcylin the axial and radial directions,wherea,b,andcare constants obtained from the least-square fitting of the equation to experimental data. Furthermore, reference [25] replacedZin Knock et al.’s equation withZ(L/D)-1/9to consider the effect ofL/D. Another equation consideringL/Din the prediction of the radialPcylwas developed in Ref. [26] (cited in Ref. [27]), but it employs the ratio ofPcylto the overpressure induced by an equivalent spherical charge asPcyl/Psph=5˙53(L/D)0˙308/Z0˙998+(Z-L/D)/24˙99.Gao et al.[14]developed an extremely complex equation for predicting thePcylandIcylthat considers the influences of bothL/Dand orientation:when fitting the pressure (impulse) data curves,90 (30) constants must be determined, and the fitting error is quite evident at some distances, particularly in the close-in range. In addition, the impulse fitting equation is unable to consider any orientations from 0 to 25◦owing to the complexity of the data. As shown in the above literature review, the effects ofL/D,orientation, and detonation configuration on the blast loading distribution around a cylindrical charge are complex but crucial,and must especially be considered in the close-in range. The shortcomings in the existing research can be broadly summarized as follows. (1) The conclusions drawn by experimental studies in the past may be not completely accurate. Finite element simulations can be used to analyze these conclusions,but the model must undergo rigorous experimental verification to ensure sufficient accuracy. (2) Existing studies typically focused only on distinguishing between the blast behaviors of cylindrical and spherical charges; quantitative comparisons of the differences among the blast loadings induced by cylindrical charges with differentL/Dvalues are currently lacking. (3) There is presently no systematic quantitative description of the magnitude and extent ofP2ndinfluence. (4) A simple and practical method for the prediction of blast loading considering the different relevant influencing factors is still unavailable. This study therefore developed a high-fidelity finite element model (FEM) using AUTODYN and validated it using the data collected from two close-in blast tests of single-end and doubleend detonated cylindrical charges, as well as previously published test data. Next, intensive finite element simulations were conducted to evaluate the mechanism governingP2nd, and its magnitude and distribution were quantitatively estimated.The influences ofL/D, orientation, and detonation configuration on the distributions of incident overpressure and impulse were then investigated at 0.42 Hydrocode AUTODYN has remapping capabilities[28]that allow for the first stage of the detonation process to be modeled at extremely high mesh resolutions, realizing accurate and efficient computation. Thus, AUTODYN was employed in this study to conduct intensive calculations modeling the detonation of cylindrical charges. An overview of the two-dimensional (2D) FEM constructed in AUTODYN is shown in the example in Fig. 3, which represents a cylindrical charge withL/D= 4. TheX-axis andY-axis were respectively defined as the axial and radial directions,upon which the axial and mirror symmetry conditions were respectively imposed to represent the three-dimensional cylinder,allowing the computation time to be further reduced by modeling only half of the axisymmetric charge and air domains. Transmission boundary conditions were imposed on all other planes. Central, single-end,and double-end detonation configurations were evaluated using the model;the central detonation configuration(i.e.at the origin of the model,X= 0 andY= 0) is shown in Fig. 3. Fig. 3. AUTODYN model (1 kg TNT, L/D = 4): (a) explosive charge model mesh and detonation point;(b)first stage detonation model;(c)first stage detonation result;and(d) second stage detonation model with first stage remap. (dimensions in mm). The remapping methodology in AUTODYN was performed in two stages.In the first stage,a fine mesh resolution was employed to simulate the initial 0.07 ms of the explosion, during which the shock wave front traveled a distance approximately three times the maximum size of the charge [12]. At this time, a remap file was created containing the mesh data from the first stage simulation.In the second stage,the data from this remap file was fed into a larger 2D computational domain defined using a coarser mesh at a lower resolution to simulate the explosion in the later stages. The incident overpressures and impulses were monitored at 0.42 Table 1Dimensions and L/D of charges in FEM simulations. AUTODYN contains its own material library [29] with default parameters for various equations of state.In the present model,the air was modeled as an ideal gas with an initial pressure of 101.3 kPa by specifying an initial temperature of 288 K (15◦C). The air pressure is related to the energy by where γ is a constant, ρ is the air density, andeis the specific internal energy. The Jones—Wilkins—Lee(JWL)state equation was used to model the TNT, and describes a pressure—volume relationship given by wherepis the pressure; v is the relative volume;eis the specific internal energy;andA,B,R1,R2,and ω are constants calibrated from test data.The multi-material Eulerian solver was used for both the air and explosive.The detailed model parameters of the air and TNT are listed in Table 2. Table 2Model parameters of TNT and air in the FEM [29]. The simulation results will be strongly influenced by the resolution of the model mesh owing to the extremely short duration of the blast wave and the energy transmission between different meshes. Thus, a mesh resolution that is acceptable for one blast case might not be suitable for another; for example, a sufficiently fine mesh when predicting the blast overpressure at a largeZmight be too coarse at a smallZ. Though an excessively coarse mesh will inevitably lead to errors and makes it difficult to capture higher load peak characteristics [30], it is sometimes impossible to use a sufficiently fine mesh owing to limitations of the computer or software. Furthermore, as AUTODYN-2D only supports the use of rectangular meshes for Eulerian models, differences will arise between shockwaves propagating in different directions (i.e., along directions at different angles relative to the vertexes of the rectangular mesh)[31]because the shockwave will pass through different numbers of cells along the same physical distance. Though these differences were not considered in previous simulation analyses[12—14],a sufficiently fine mesh was applied in this study to reduce their impact. To this end, unlike previous researchers [12—14] who established one-dimensional (1D) models during the first stage to conduct their mesh convergence studies, this study employed 2D models in the mesh convergence studies of both the first and second stages using spherically shaped charges, as shown in Fig. 4.Mesh resolutions of 0.25 mm, 0.5 mm,1.0 mm, and 2.0 mm were evaluated in the first stage,while resolutions of 5 mm,10 mm,and 20 mm were evaluated in the second stage. During the first stage,measurements were collected at two points equally distant from the center of the charge along the 0◦and 45◦directions. Theoretically, the difference resulting from the adoption of a rectangular mesh would be the largest between these two directions. The distribution of measurement points in the second stage was similar to that in the first stage, with three measurement points in each direction at different distances, as shown in Fig. 4. Subsequently,the sensitivity of the simulation results to the mesh resolution was assessed by comparing the resulting pressure—time history curves,Psph, and Isphto determine a suitable resolution. Fig. 4. FEM used in mesh resolution evaluation: (a) first stage; (b) first stage result; (c) second stage with first stage remap (dimensions in mm). Fig. 5. Simulated pressure—time history curves according to mesh resolution at Z values of: (a) Z = 0.32 m/kg1/3; (b) Z = 1 m/kg1/3; (c) Z = 2 m/kg1/3; and (d) Z = 3 m/kg1/3. The pressure—time history curves resulting from the simulated detonation of the spherical charges are shown in Fig.5,in which the rising sections of the curves grow steeper with finer mesh resolutions, and the arrival time of Psphdecreases accordingly. Moreover,Psphcan be observed to arrive sooner in the 45◦direction than in the 0◦direction when the mesh resolution and measurement distance are the same. The relationship between the blast loading(PsphandIsph)and the mesh resolution is depicted according toZin Fig. 6, in which the mesh resolution exerted a greater influence onPsphthanIsph.ThePsphandIsphat all measurement points converged as the mesh resolution decreased. The figure shows that the predictions obtained using mesh resolutions of 0.25 mm and 0.5 mm were nearly identical in the first stage, with a maximum difference of only 2.9%, as were the predictions obtained using mesh resolutions of 0.5 mm and 1 mm,with a maximum difference of only 5.5%. Considering both the numerical accuracy and computation cost,a mesh resolution of 0.5 mm was tentatively selected for the first stage. In the second stage, the maximum difference between the predictions obtained using mesh resolutions of 5 mm and 10 mm was only 7.1%. Therefore, a mesh resolution of 10 mm was tentatively selected for the second stage considering computational costs, although a mesh resolution of 5 mm would produce more accurate predictions. Fig. 6. Simulated (a) Psph and (b) Isph according to mesh resolution at different Z values. Fig. 7. Test of single-end detonated cylindrical charge (4.1 kg, L/D = 1.84). However, Fig. 6 shows that a significant difference existed between the simulation predictions in the 0◦and 45◦directions,and this difference decreased as the mesh resolution became finer.When a mesh resolution of 0.5 mm was used in the first stage,the maximum difference between the simulation predictions in the 0◦and 45◦directions was only 4.3%. When a mesh resolution of 10 mm was used in the second stage, the maximum difference between the predictions in the two directions was 14.5%, which is relatively large,but the difference was only 7.3%when using a mesh resolution of 5 mm. Thus, final mesh resolutions of 0.5 mm and 5 mm were selected for use in the first and second stages,respectively, of the simulations conducted in this study. For comparison,Sherkar et al.[12]and Gao et al.[14] also used AUTODYN to perform their simulations. Both studies used a mesh resolution of 5 mm in the first stage and resolutions of 12.5 mm and 10 mm, respectively, in the second stage. The results of the mesh resolution study presented herein indicate that these resolutions were not fine enough to ensure accuracy. To validate the developed FEM, two close-in blast tests were conducted using single- and double-end detonated cylindrical charges. The resulting data were used together with previously published data describing cylindrical charge explosions to validate the constructed FEM. 3.1.1. Test scheme and FEM Blast tests of five different single-end detonated cylindrical charges were conducted. Each cast TNT explosive cylinder was supported by a light wooden rod that elevated the centroid of the cylinder 1500 mm above the ground,as shown in Fig.7.A PCB B102 pressure transducer was mounted on a steel frame at the same height as the centroid of the cylinder to measure the resulting pressure—time history curves. The axis of the cylindrical TNT charge was kept perpendicular to the ground,and the detonation was initiated at its top end using an electric detonator. The diameter of the charge cylinder was maintained at 120 mm whileL/Dwas varied from 1.84 to 4.60 by changing only the cylinder heightL. Information pertaining to the parameters of the test program is summarized in Table 3. Table 3Test program parameters. An axisymmetric 2D FEM consisting of 1,479,200 elements was constructed based on the blast test parameters and is shown for Test 1 and Test 2 in Fig. 8. To reduce the computational cost, the ground and steel frame were modeled as rigid bodies,and the blast wave interactions with these rigid bodies were controlled by the fluid—structure interaction algorithm in AUTODYN. The other aspects of the model were the same as those shown in Fig. 3. Fig. 8. First stage (left) and second stage (right) of the single-end detonated cylindrical charge simulation (4.1 kg TNT, L/D = 1.84). 3.1.2. Comparison and verification The experimentally observed pressure—time history curves are compared in Fig.9 with those generated by the corresponding FEM.The ratios of the reflected Pcyland Icylinduced by the cylindrical charge in the test and FEM to those of an equivalent spherical charge from Ref.[4]at same distance are compared in Fig.10.The differences in the reflected Pcylratios obtained by the test and FEM were less than 10%, indicating that the proposed model can adequately reproduce the overpressure peaks.However,the calculated reflected Icylratios were up to 198.3%higher than the test results because the steel frame in this FEM was represented as a 2D approximation of a large,3-m diameter cylinder for consistency with the axisymmetric modeling approach.In the actual tests,however,the steel frame was a square column, the edges of which rapidly relieved the initial reflected pressure through wave diffraction.Therefore,it is reasonable that the Icylvalues measured in the tests were lower than those indicated by the simulation results[32]. Fig.9. Comparison of experimentally and numerically obtained pressure—time history curves for TNT charge quantities of (a) 4.1 kg; (b) 6.1 kg; and (c) 10.2 kg. Fig.10. Ratios of reflected Pcyl and Icyl from the tests and the FE models to those of an equivalent spherical charge. Further, Fig.10 shows that the blast loadings generated by the cylindrical charges were all greater than those generated by the spherical charges, with ratios up to 2.5 for anL/D= 4.6 atZ= 1.38 m/kg1/3in the radial direction. 3.1.3. Comparison with existing test data To further verify the reliability of the model,the axial and radialPcylandIcylobtained by the FEM were compared with previously published test data. The developed axisymmetric 2D model is shown in Fig.11,the shape of which is same as that of model Cyl_4 detailed in Table 1.The other aspects of the model were the same as those shown in Fig. 3. Fig.11. First stage (left) and second stage (right) simulation of single-end detonated cylindrical charge (1 kg TNT, L/D = 4). Plooster [6], Knock and Davies [23], Wisotski and Snyer [16](cited in Ref. [23]), and Knock et al. [11] reported various test data for single-end detonated cylindrical charges, as listed in Table 4.The TNT equivalents of the different explosives forPcyl(EP)andIcyl(EI) are also provided according to UFC [4]. Fig. 12 compares the simulated changes in incidentPcylandIcylaccording toZin the radial direction with the previously published test data. Table 4Existing test data. As shown in Fig. 12, the test data forPcylandIcylare evenly distributed around the simulated curve, indicating that the developed FEM can accurately reproduce the radial incidentPcylandIcylregistered across a wide range ofZvalues.Further,Fig.12(b)shows that the radialIcylinitially increased and then decreased asZincreased. This trend can also be observed in the calculations of Sherkar et al. [12] and Xiao et al. [13]. Fig.12. Comparison between simulated and previously reported (a) Pcyl and (b) Icyl obtained in the radial direction. In the axial direction,the test data obtained by Plooster[6]and Knock et al. [11] were employed to validate the results from the developed FEM,all of which are compared in Fig.13.The solid and dashed lines in Fig. 13(a) representPcylandP2nd, respectively, as obtained by the simulation. The secondary shocks are caused by bridge waves generated along the axial direction of the cylindrical charge. Fig. 13(a) shows that theP2ndvalues obtained by the experiment and simulation both initially increased rapidly, then slowly decreased atZ> 2 m/kg1/3. AdditionalP2ndvalues can be observed in the simulation results within a range ofZ= ~0.5—2.0 m/kg1/3; however, they are not present in the test data. This is because the experimental pressure—time history curves in Refs. [6,11] showed multiple overpressure peaks, especially at small Z values, making it impossible to accurately determine the true P2ndvalue. Fig.13. Comparison between simulated and previously reported (a) Pcyl and (b) Icyl obtained in the axial direction. As shown in Fig. 13(b), the differences between the test data obtained by both Knock et al. [11] and Plooster [6] and the simulated results were less than 20% in most cases. Therefore, the simulation results agreed well with the test data. 3.2.1. Test scheme and FEM Six tests using double-end detonated cylindrical charges were conducted atZ< 1 m/kg1/3, as shown by the test configuration in Fig.14.As summarized in Table 5,two quantities of cylindrical rock emulsion explosives (13.4 kg and 18.2 kg) with different dimensions were detonated in the blast tests. The cylindrical charge was suspended 1.5 m above the ground and its axis was strictly parallel to the ground. One electric detonator was located at each end of the cylinder;the two detonators were adjusted precisely to ensure simultaneous initiation. Three PCB B102-series pressure transducers,P1,P2,and P3,were spaced 0.38 m apart on the ground surface to record the reflected pressure—time history curves, with P1 mounted at the projection of the center of the cylindrical charge onto the ground. Table 5Test program parameters. Fig.14. Test of double-end detonated cylindrical charge. Fig.15. First stage (left) and second stage (right) simulation of double-end detonated cylindrical charge (8.2 kg TNT, L/D = 1.94). The FEM was constructed as shown in Fig. 15, in which the ground was modeled as a rigid body,1.5 m away from the cylindrical explosive.The rock emulsion explosive was converted to TNT according to an average TNT equivalent of 0.609 [2], with the conversion results listed in Table 5. 3.2.2. Comparison and verification The simulated pressure—time history curves are compared with the experimental results in Fig.16, and the averages and standard deviations of Pcylare presented in Fig.17(a). The figures show that the differences between the average test results and the simulation results were less than 6%at P1,and only slightly higher at P2 and P3,remaining in an acceptable range. Fig.16. Comparison of simulated and experimentally obtained pressure—time history curves for (a) Test 1 (13.4 kg rock emulsion) and (b) Test 5 (18.2 kg rock emulsion). Fig.17. Comparison of simulated and experimentally obtained (a) reflected peak overpressure and (b) reflected impulse. Points report the average of two tests and bars show the standard deviations of their results. As shown in Fig. 17(b), however, there were considerable differences in the reflectedIcyl, which could be caused by the use of different explosives (rock emulsion and TNT). As shown in Fig.16,an evident “hump” following the primary peak exists in the pressure—time history curves for the TNT explosives, especially at P1;the magnitude of this“hump”is much higher than that for the rock emulsion explosives.This results in a larger simulated Icylat P1 than the test results indicated. Further, Fig.17 shows that the blast loadings generated by the double-end detonated cylindrical charges were all greater than those generated by equivalent spherical charges [4]; cylindrical charge to spherical charge peak overpressure(impulse)ratios of up to 3.7 (2.6) can be observed forL/D= 2 atZ= 0.67 m/kg1/3in the radial direction. Thus, the developed FEM can be confidently used to reproduce the blast loads generated by close-in cylindrical explosives detonated using either the single-end or double-end configurations. Existing studies on the phenomenon of secondary shock waves were briefly discussed in the introduction, and the characteristics ofP2ndwere described in section 3.1.3. In this section, the mechanism of secondary shock wave formation is introduced and the magnitude and distribution of the associatedP2ndvalues are quantitatively analyzed. The complex interaction of the shock waves generated by the detonation of a cylindrical charge is shown in Fig.18(a);they have been observed in various numerical and experimental investigations, as shown in Fig. 18(b) and Fig. 18(c). First, primary spherical waves are generated in both the radial and axial directions, denoting the primary side wave and primary end wave,respectively.As the shock waves expand outward,the primary side and end waves meet and reflect off of each other, forming bridge waves between them and reflected waves behind them in each direction. These reflected waves are known as secondary shock waves [16]. Thus, the presence of secondary shock waves can be explained by the interaction of energy: when two shock waves meet, their energies are either reflected or transmitted across the boundary between them, with the stronger shock wave transmitting its energy across the collision interface. Generally, the shock wave in the direction of the maximum presented area is the strongest, and for a cylindrical charge withL/D> 1, the curved surface has the largest presented area. Thus, the energy will be transmitted from the radial direction to the axial direction when the two shock waves meet. Hence, secondary shock waves can be clearly observed in the axial direction of a cylindrical charge withL/D> 1 [16]. Fig.18. Shock waves induced by a cylindrical charge at 0◦: (a) development of shock waves(adapted from Ref. [16]), (b) pressure contour, and (c) high-speed video still (adapted from Ref. [11]). A series of pressure—time history curves from the detonations of spherical and cylindrical charges in the close-in and far-field ranges are presented in Fig. 19. The curves generated by the cylindrical charges include secondary shock waves that differ from those generated by the spherical charges. Indeed, there are significant differences between the arrival times, peak overpressures, and curve shapes for the spherical charge and for the cylindrical charges with different L/D values. Critically, the simulation results presented in this paper demonstrate that secondary shock waves were present only at 0◦and 22.5◦in the axial plane(with the exception of Cyl_1, for which secondary shock waves were also present at 90◦). Fig. 19. Pressure—time history curves for centrally detonated cylindrical charges according to L/D at (a) 0◦and Z = 0.63 m/kg1/3, (b) 22.5◦and Z = 1.48 m/kg1/3, and (c)0◦and Z = 3.06 m/kg1/3. Fig.20(a)shows that the ratioP2nd/Pcylat 0◦was less than 0.25 atZ<2 m/kg1/3in most cases but increased up to 3.5 with increasingZ> 2 m/kg1/3. Furthermore,P2nd/Pcylincreased withL/Dfor the sameZ.Similarly,Sherkar et al.[12]found thatP2nd/Pcyl>1 withL/D= 2—5 when Z > 3.9 m/kg1/3, which can also be observed in Fig. 20(a). Fig. 20(b) shows that the ratio of P2ndto the peak overpressure of the spherical charge (Psph) at 0◦was less than 0.73 at Z<2 m/kg1/3and gradually increased beyond 1 as Z increased.The difference between P2ndand Psphwas less than 20%at Z> 3.55 m/kg1/3. Fig. 20. (a) P2nd/Pcyl at 0◦; (b) P2nd/Psph at 0◦. Fig.21(a)and Fig.21(b)show that the change trends ofP2nd/PcylandP2nd/Psphat 22.5◦were similar to those at 0◦.However,for the sameL/D, the greatestZat whichP2ndwas observed at 22.5◦was smaller than that at 0◦.Furthermore,both ratios were consistently smaller at 22.5◦than at 0◦given the sameL/Dat the sameZ.Finally,Fig. 21(b) shows thatP2ndwas less thanPsphat allZvalues. RadialP2ndwas only observed in the simulation of Cyl_1 atZ= 2.42—3.79 m/kg1/3, as shown in Fig. 19(c), where P2nd/Psphranged from 0.1 to 0.4 and P2nd/Pcylranged from 0.1 to 0.47. Fig. 21. (a) P2nd/Pcyl at 22.5◦; (b) P2nd/Psph at 22.5◦. The impulse is also influenced by the complex waveforms surrounding the cylindrical charges upon detonation. Negative pressures existed between the two peak overpressures in several of the pressure—time history curves showing a P2ndat 0◦and 22.5◦.In this case, independent primary and secondary impulses (Icyland I2nd,respectively) should be considered in the analysis. The I2ndwas mainly located at the individual measurement points at Z < 1 m/kg1/3, and its magnitude was nearly equal to that generated the spherical charge at the same Z.However,I2ndonly existed in the farfield range for Cyl_1 at 0◦, as shown in Fig.19(c). Note that when analyzing the results in section 5,I2ndwill be added to Icylfollowing the approach taken by Xiao et al.[21].In other conditions,however,the impulse associated with the two overpressure peaks cannot be clearly distinguished,as shown in Fig.18. Finally, note that the dynamic response of the structure under explosive load is directly related to the shape of the pressure—time history curve [3]. Thus, when using cylindrical explosives, the influence of the secondary shock waves on the shape of the load curve must be considered, so it is insufficient to consider only the difference in the magnitudes of Pcyland Icylrelative to a reference spherical charge (Psphand Isph, respectively). A 10%difference is generally considered of little consequence to the overall design in engineering applications [12]. Sherkar et al.[12] proposed that the effect of charge shape could be neglected whenPcylandIcylwere no more than 10%greater thanPsphandIsph,as did Xiao et al.[13].However,theP2ndat 0◦of Cyl_2 in this study was ~20% greater thanPsphatZ= 4.2 m/kg1/3, and theIcylat 0◦of Cyl_5 was over 30% less thanIsphatZ= 2.1 m/kg1/3. Thus, the conclusion based on the investigation conducted by Sherkar et al.[12] should not be considered strictly applicable to all scenarios.Indeed, the influences ofP2nd,I2nd, and orientation should be discussed and analyzed in detail. Therefore, the results of this study suggest that the effect of charge shape can be neglected when the absolute value of the differences between the peak overpressures and impulses of the cylindrical and spherical charges in all directions are less than 10%, as proposed by Gao et al. [14]. Several FEMs of cylindrical explosives with 1.84 ≤L/D≤4.6 were established in section 3 to preliminarily analyze the influence of the detonation configuration(single-end and double-end)on the blast loading. Furthermore, Sherkar et al. [12] analyzed the blasts generated by single-end detonated cylindrical explosives withL/D=1,3,and 5,while Xiao et al.[13]analyzed the blasts generated by single-end and double-end detonated cylindrical charges with 1≤L/D≤5.Therefore,only model Cyl_4 was used in this section to study the effect of the different detonation configurations shown in Fig. 22 on the resulting blast characteristics. Fig. 22. Three different detonation configurations evaluated in this study. Fig.23. Pcyl/Psph values according to Z and orientation of cylindrical charges detonated using the (a) central; (b) single-end; and (c) double-end configurations. The detonation configuration exerted no influence on the range of angles in the axial plane within whichP2ndexisted (0—22.5◦) in any case. In the 0◦direction, the double-end detonation configuration resulted in the largest P2nd, followed by the single-end detonation configuration and then the central detonation configuration. Notably, for the single-end detonation configuration, P2ndwas higher in the 180◦direction than in the 0◦direction. As shown in Fig. 23 and Fig. 24, the single-end detonation configuration resulted in a ~10% larger blast loading in the 0◦direction compared with that resulting from the central detonation configuration,with similar trends in the variation of loading withZ.However, the resulting blast loading in the 180◦direction was considerably less than that in the 0◦direction for the single-end detonation configuration. Furthermore, the blast loading in the 180◦direction was drastically less than that of the spherical charge in most cases, as was similarly observed in previous tests [1,6]. At the same time, the radial blast resulting from the single-end detonation configuration was essentially the same as that resulting from the central detonation configuration, with a difference of less than 10%in most cases.According to the calculation results of Sherkar et al. [12], the conclusions in this paragraph are also applicable to the case withL/D= 1, 3, and 5. Fig. 24. Icyl/Isph values according to Z and orientation of cylindrical charges detonated using the (a) central, (b) single-end, and (c) double-end configurations. Compared with the central detonation configuration, the double-end detonation configuration showed a drastically smaller axial blast loading and a considerably larger radial blast loading.When 0.42 WhenZ< 2 m/kg1/3, the radial blast loading induced by the double-end detonation configuration was consistently larger than that induced by the single-end detonation configuration.The ratios of thePcylandIcylinduced by the double-end detonation configuration to those induced by the single-end detonation configuration reached their maximum values of 1.57 atZ= 1.26 m/kg1/3and 1.61 atZ= 0.84 m/kg1/3, respectively. According to Anastacio and Knock[20],the ratio ofPcylinduced by the double-end detonation configuration to that induced by the single-end detonation configuration was 1.6 in the radial direction,while the values ofIcylinduced by the two configurations in the radial direction were the same (a ratio of 1). This conclusion is clearly not rigorous, as the authors failed to consider the differences owing to cylindrical chargeL/Dvalues and the dispersion of the experimental data during their analysis. 5.2.1. Difference to spherical charge The changes inPcyl/PsphandIcyl/Isphfor each orientation of each cylindrical charge are shown in Fig. 25 and Fig. 26, respectively.These figures show that whenZ< 2 m/kg1/3, the blast loadings(peak overpressure and impulse) induced by the cylindrical and spherical charges differed significantly, whereas these differences were considerably reduced whenZ> 2 m/kg1/3. In addition, the loading curves for different models can be observed to share a similar profile whenL/D≥ 2. Furthermore, the blast loading decreased with increasingL/Dfor angles between 0◦and 45◦and increased with increasingL/Dfor angles between 45◦and 90◦.These conclusions are based on approximations, and a detailed analysis of the governing laws should also consider the actual orientation andZvalue. A detailed analysis was therefore performed and discussed in sections 5.2.2,5.2.3,5.3,and 5.4 according to the results in Fig. 25 and Fig. 26. Fig. 25. Pcyl/Psph according to Z at (a) 0◦; (b) 22.5◦; (c) 45◦; (d) 67.5◦; (e) 90◦; and (f) change in pressure over time. Fig. 26. Icyl/Isph according to Z at (a) 0◦, (b) 22.5◦, (c) 45◦, (d) 67.5◦, and (e) 90◦. Fig.27. Pressure—time history curves of spherical charge and cylindrical charges with different L/D values at 45◦and 67.5◦when Z = 2.1 m/kg1/3. Fig. 28. Maximum values of (a) Pcyl/Psph and (b) Icyl/Isph at corresponding Z values. Fig. 29. Differences between Pcyl of Cyl_2 (L/D = 2) and other cylindrical charges at (a) 0◦, (b) 22.5◦, (c) 45◦, (d) 67.5◦, and (e) 90◦. Fig. 30. Differences between Icyl of Cyl_2 (L/D = 2) and other cylindrical charges at (a) 0◦, (b) 22.5◦, (c) 45◦, (d) 67.5◦, and (e) 90◦. Note that Wisotksi and Snyer [16] found that the radialPcylincreased with increasingL/DwhenZ>1.7 m/kg1/3,which can indeed be observed in Fig. 25(e). Furthermore, Langran-Wheeler et al. [19]found the reflected radialIcylwas significantly larger thanIsph(L/D= 7,Z= 0.45 m/kg1/3),which can be observed in Fig.26(e). As shown in Fig.25(b),thePcylvalues of all models withL/D≥2 were less thanPsphin the 22.5◦direction in the axial plane. However, a sharp increase inPcyl/Psphcan be observed atZ> 2 m/kg1/3owing to the merger of thePcylandP2ndas the former gradually catches up with the latter. Indeed, Fig. 25(f) shows that asZincreased,the two peaks gradually merged and the secondary peak disappeared. 5.2.2. Influence range When the blast loading(PcylandIcyl)of a cylindrical charge can be predicted using a spherical charge of equal mass as a substitute,the effect of charge shape can be neglected altogether. Table 6 presents the range of influence ofZ, beyond which the effect of charge shape can be neglected.Because the blast loading condition is special whenL/D=1,it is analyzed separately.The table indicates that the effect of charge shape can be neglected for a cylindrical charge in the 45◦and 67.5◦directions whenZ>2 m/kg1/3.Indeed,comparing the pressure—time history curves of all models in the 45◦and 67.5◦directions when Z = 2.1 m/kg1/3in Fig. 27, it can be observed that, apart from small differences in the arrival times of the shock waves,the curves of all models are very similar to that of the spherical charge. Table 6Influence range of charge shape on the blast loading. However,owing to the presence of secondary shock waves,the effect of charge shape onPcylcannot be neglected in any directions in the axial plane other than 45◦and 67.5◦within theZrange analyzed in this study, i.e.,Z< 4.2 m/kg1/3. For comparison, Gao et al.[14]proposed that the effect of charge shapePcylcould not be neglected even atZ> 10 m/kg1/3. However, Sherkar et al. [12] and Xiao et al.[13]suggested that the effect of charge shape on thePcylcould be neglected whenZ> 3.06 m/kg1/3andZ> 3.2 m/kg1/3,respectively, because their studies used different criteria than Gao et al. [14], as explained in the beginning of section 5.1. Furthermore,the results of this study indicate that the effect of charge shape onIcylcan be neglected in all directions whenZ> 3.2 m/kg1/3, which agrees well with the result from Gao et al.[14], who reported a value ofZ> 3.0 m/kg1/3. However, Sherkar et al. [12] suggested that the effect of charge shape onIcylis negligible whenZ> 2.11 m/kg1/3, a much smaller threshold value than that identified in this study because they did not considerI2nd.On the contrary,Xiao et al.[13]suggested that the effect of charge shape onIcylis negligible whenZ> 5.7 m/kg1/3, a much larger threshold value than that identified in this study;the reason for this difference will be explained in detail at the end of section 5.2.3. 5.2.3. Maximum blast loading The maximumPcyl/PsphandIcyl/Isphvalues are compared in Fig.28 according to theZvalues at which they occurred.The ratios exhibited a maximum value of 3.11 and an average value of~2.5 in the axial direction,with the maximum ratio occurring in the range ofZ<1 m/kg1/3.In this case,a largerL/Dresulted in:(1)a largerPcyl/Psph,(2)a smallerIcyl/Isph,and(3)a smallerZcorresponding to each maximum ratio. Indeed, bothPcyl/PsphandIcyl/Isphreached their maxima in the 0◦direction in this study. The calculation results of Gao et al. [14]showed that the maximum values ofPcyl/PsphandIcyl/Isphfor models with 1 ≤L/D≤ 5 ranged from 2.1—2.8 and 1.6—3.0,respectively. Although Sherkar et al. [12] did not report the maximum values of Pcyl/Psphand Icyl/Isphin their paper, ranges of approximately 2—3 for Pcyl/Psphand 1—3 for Icyl/Isphwere obtained by the present authors using the reported pressure and impulse curves, respectively. These values are very close to the results obtained in this paper and shown in Fig.28.However,Xiao et al.[13]found that the maximum values of Pcyl/Psphand Icyl/Isphfor models with 1 ≤L/D ≤5 ranged from 3—6.5 and 1.5—3.5, respectively.Although these maximum ratios were also obtained in the 0◦direction at around Z=1 m/kg1/3,the value of Pcyl/Psphis significantly larger than the results obtained in this study,by Gao et al.[14],and by Sherkar et al.[12].Previously published data from the explosion tests of cylindrical charges has shown that the maximum value of Pcyl/Psphwas 2.9[33],which was also obtained at around Z=1 m/kg1/3.The maximum value of Pcyl/Psphobtained by Xiao et al.[13]is also significantly larger than 2.9.This difference is possibly a result of the different software used to perform the simulations. Specifically, Xiao et al. [13] used LS-DYNA in their study, which may provide a larger calculation result than AUTODYN. The FEM developed by Xiao et al. [13] should thus be validated against experimental data. The ratio between the radial blast loading induced by the cylindrical and spherical charges exhibited a maximum value of 1.86 and an average value of ~1.5, with the maximum ratio also occurring within the range ofZ< 1 m/kg1/3. In this case, a largerL/Dresulted in largerPcyl/PsphandIcyl/Isphvalues. In the other directions, the maximum ratios were essentially 1 and mostly occurred atZ>2 m/kg1/3.This indicates that the blast enhancement effect of the charge shape is primarily concentrated along the axial and radial directions. When proposing predictive equations forPcylandIcylbased on experimental data, researchers have considered theL/Din some cases but disregarded it in others.Hence,a detailed analysis of the influence of theL/Don cylindrical charge blast loading is required.The analysis performed in this study indicated that the loading curves for different models exhibited similar trends whenL/D≥2.Therefore, the results for Cyl_2 were chosen as the basis of comparison to determine the percentage difference in the calculatedPcylandIcyl. When the calculated difference is less than 10%, the effect ofL/Dcan be neglected; in other words, the blast loading from cylindrical charges with differentL/Dvalues can be predicted using a cylindrical charge of equal mass with anL/D= 2 as a substitute. Fig.29 shows a comparison of the calculatedPcylfor Cyl_2 with those for the other charges according toL/Din various directions.The differences between thePcylvalues of the various charges in the 0◦and 22.5◦directions in the axial plane were generally greater than 20% for mostL/Dvalues, indicating thatL/Dexerts a very strong influence in these two directions. In the 90◦direction, the difference was less than 10%in most cases whenL/D≥2;thus,the effect ofL/Dcan essentially be neglected in this direction whenL/D≥2.However,larger differences of~20%were observed between thePcylvalues of Cyl_2 and Cyl_1. For comparison, Wisotski and Snyer [16] observed that whenL/D≥2, the experimentally determined radialPcylexhibited no significant differences irrespective ofL/Dand could be fitted using a single curve. Furthermore, Knock and Davies [23] experimentally determined that there were no significant differences between the radialPcylvalues of PE4 charges withL/D= 4 andL/D= 6. The simulation-derived findings presented in this section are therefore consistent with the experimental results of previous studies obtained using differentL/Dvalues, suggesting that the proposed simulation can be used to overcome the limitations of discrete experimentation. Fig.30 shows a comparison of calculatedIcylvalues according toL/Din various directions.The comparison indicates that the effects ofL/Dcan be neglected in the axial direction whenL/D≥2 atZ>1.97 m/kg1/3.However,considerable differences inIcylaccording toL/Dwere again consistently observed between Cyl_2 and Cyl_1,reaching nearly 50% in the far-field range. Nevertheless, ifI2ndis added to the calculation ofIcylfor Cyl_1,theL/Dcan be considered to have a negligible effect on the axialIcylfor all models whenZ> 2.5 m/kg1/3. The value ranges within which theL/Dwas observed to affect thePcylandIcylin the different evaluated directions are tabulated in Table 7. Table 7Influence range of aspect ratio on the blast loading. Table 7 summarizes that the effect ofL/DonIcylcan be neglected in all directions whenL/D≥2 atZ>2.2 m/kg1/3.The effect ofL/Don the radialPcylcan be neglected at allZvalues whenL/D≥2;however, the effect ofL/Don axialPcylmust be considered at allZfor allL/Dvalues. Fig. 31 and Fig. 32 show the values ofPcyl/PsphandIcyl/Isph,respectively, for cylindrical charges with the sameL/Din varying orientations relative to the measurement point at differentZvalues.The figures show that whenL/D= 1 andZ> 1 m/kg1/3, there was minimal variation in the magnitude of thePcylandIcylfor orientations in the axial plane within the 22.5—67.5◦range.When L/D ≥2 and 1 Fig. 31. Pcyl/Psph values according to Z and orientation of cylindrical charges with L/D values of (a) 1, (b) 2, (c) 3, (d) 4, and (e) 5. Fig. 32. Icyl/Isph values according to Z and orientation of cylindrical charges with L/D values of (a) 1, (b) 2, (c) 3, (d) 4, and (e) 5. Further, Fig. 31 shows that the axialPcylwas greater than the radialPcylwithin a small range whenL/D≥2,whereas this relationship was reversed for the farther-field distances.ThePcylvalues in the two directions were identical at a certain scaled distance aroundZ=1 m/kg1/3that decreased with increasingL/D.When the axialP2ndexceeded the axialPcylatZ= ~2.5 m/kg1/3, the radialPcylwas then exceeded by the axialP2ndatZ=~3.5 m/kg1/3.Furthermore,as shown in Fig.31(a),whenL/D=1,the axial peak overpressure was greater than the radial peak overpressure in most cases. Additionally, Fig. 32 shows that the axialIcylwas greater than the radialIcylwithin a small range nearZ= 1 m/kg1/3and atZ>~3 m/kg1/3,and that this relationship was reversed outside this range.Therefore,the relationship between the axial and radialPcylandIcylmust consider the specificL/DandZ. According to the conclusions presented in section 5.1, the distribution law of the blast loading induced by single-end detonation is very similar to that induced by central detonation. The most commonly used method of detonation in explosion tests is the single-end detonation. Note that McNesby et al.[17]found that axialPcylis greater than the radialPcyl(L/D= 4,Z= 0.2 m/kg1/3). It can be seen from Fig.31(d)that although the minimum calculatedZwas 0.42 m/kg1/3,the load trend still indicates that the conclusion of McNesby et al.[17] is reasonable. Furthermore, Wu et al. [1] found that the reflectedPcylandIcylin the axial direction are greater than those in the radial direction (L/D= 1,Z= 2 m/kg1/3). It can be seen from Fig. 31(a) and Fig. 32(a) that the difference between the incident blast loadings is the same as the conclusion of Wu et al.: the incident load is proportional to the reflected load, indicating that the conclusion of Wu et al. [1] is reasonable. However, Plooster [6] found that the radial blast loading is greater than the axial blast loading(L/D>1,Z>1.39 m/kg1/3).The analysis results presented in this section indicate that this conclusion is accurate whenZis small, but whenZis greater than approximately 3.5 m/kg1/3, the conclusion is the opposite. Therefore, the conclusion of Plooster [6] is not completely accurate,potentially owing to the large dispersion of experimental data.Similarly,the conclusion that largeL/Dvalues mean more energy is directed in the radial direction is not rigorous,owing to the lack of close-in explosion test data. Held [18] found that the reflected axialIcylis greater than the reflected radialIcyl(L/D=1.35,Z=0.27—1.1 m/kg1/3).It can be seen from Fig.32(a)and Fig.32(b)that whenL/D=1 and 2,the axialIcylis larger near 1 m/kg1/3, but the axialIcylis smaller whenZis smaller. The reason these experimental conclusions were not exactly the same as the conclusions obtained in this section is that Held analyzedIcylindirectly by measuring the flight distance of cylinders arranged in a semicircle surrounding the explosive; the interaction between the cylinders and the explosion wave was complex,such that the flight distance of the cylinders may not only be related toIcylbut also toPcyl.Indeed,it can be seen from Fig.31(a)and Fig. 31(b) that the axialPcylis much larger than the radialPcylwhenZ< 1.1 m/kg1/3. Considering the results from previously published studies together with those obtained in this research, a blast load calculation model was derived as shown in Table 8, which summarizes the relationships between the blast load,detonation configuration,and charge orientation in the axial plane, as well as the correspondingZranges. In the table,PcylandIcylrepresent the incident peak overpressure and impulse, respectively, for a centrally detonated cylindrical charge, and were obtained by multiplying the ratios presented in section 5 by the respective results for a UFC sphere [4], defined asPsphandIsph, respectively;P1andI1are the incident peak overpressure and impulse, respectively, of a singleend detonated cylindrical charge;P2andI2are the incident peak overpressure and impulse,respectively,of a double-end detonated cylindrical charge; andP3andI3represent the incident peak overpressure and impulse, respectively, of a cylindrical charge oriented in 22.5◦—67.5◦directions in the axial plane, which was shown to be independent of detonation configuration. Table 8Empirical model for incident peak overpressure and impulse considering the effects of detonation configuration and orientation. Table 8 provides approximate ranges for the incident peak overpressure and impulse loads, allowing for the rapid estimation of their magnitudes. Note that this load estimation model is only applicable for 1 ≤L/D≤5 atZ= 0.42—4.2 m/kg1/3. The FEM developed in this paper should be employed if an exact value is desired. In particular, when the response of a structure must be analyzed under the load induced by a cylindrical explosive, it is insufficient to consider only the magnitudes of the peak overpressure and impulse;a complete pressure—time history curve must be obtained when considering the existence of secondary shock waves. Furthermore, if the structure is complex, a complete FEM should be constructed for analysis. If a calculation equation for the blast loading of a cylindrical explosive is established, it will be more convenient to directly calculate the magnitude of the blast loading rather than using the approach in Table 8.However,owing to the complexity of the blast load distribution,a simple and practical equation that is applicable to all scenarios cannot be developed while retaining sufficient accuracy. Therefore, using numerical data for TNT explosions, equations were fitted to thePcyldata from the sources detailed in Section 6.1 to obtain equations to predict thePcylandIcylaccording toL/DandZ. Only thePcylvalues in the axial (0◦) and radial directions(90◦) of the cylindrical charge with the central detonation configuration were considered. Referring to existing research results,which indicated thatZ′=Z(L/D)-1/12,the best fit for the radialPcylis given by P0is the standard atmospheric pressure, which is 101.332 kPa.The simulation results are compared in Fig. 33(a) with those calculated using Eq. (3); the differences between the two results shown in Fig. 33(b) are less than 10% in most cases. Fig. 33. (a) Comparison and (b) percentage differences between simulation- and equation-obtained results for Pcyl in the radial direction according to L/D. The research results presented in section 4 demonstrated thatP2ndis extremely small compared with the axialPcylwhenZ<2 m/kg1/3. Therefore, an empirical equation is proposed to predict the axialPcylwhenZ< 2 m/kg1/3as follows:in which the effect ofL/Dis considered using the constantsa=0˙848 +0˙0867L/Dandb= 1˙2804- 0˙3a. However, to ensure an accurate prediction of axialPcylwhenZ> 2 m/kg1/3, separate equations are required to considerPcylandP2nd. Such equations are not proposed in this paper owing to the highly discrete data available as a basis for doing so [11]. The simulation results are compared in Fig. 34(a) with those calculated using Eq. (4); the differences between the two results shown in Fig. 34(b) are less than 10% in most cases. The results of the comparison therefore indicate that the empirical Eq.(3)and Eq.(4) proposed in this paper can effectively predict thePcylin the radial and axial directions according toL/DandZ. Fig. 34. (a) Comparison and (b) percentage differences between simulation- and equation-derived axial Pcyl according to L/D. In this study, a series of explosion tests were conducted using cylindrical charges.Within the close-in range,the reflected loading induced by the cylindrical charges was much greater than that induced by an equivalent spherical charge. Indeed, the maximum radial peak overpressure resulting from a double-end detonated cylindrical explosive was 3.7 times that of resulting from a centrally detonated spherical charge. The results of these explosion tests were used to rigorously validate a high-fidelity FEM, which was then employed to explore the relationships between the blast characteristics and various charge parameters such as shape,L/D,orientation, and detonation configuration. The results were investigated according to each parameter, and notable phenomena observed in the existing experiments were analyzed to propose empirical models for calculating the blast load according to cylindrical charge detonation configuration,L/D,andZin radial and axial orientations(90◦and 0◦in the axial plane).The main conclusions of this study are as follows: (1) The secondary shock waves induced by cylindrical charges mainly occurred within a range of 0◦—25◦in the axial plane,and the magnitude of the inducedP2ndwas generally smaller than the peak overpressure induced by an equivalentspherical charge. In the radial direction, secondary shock waves were only observed when the cylindrical chargeL/D= 1. The ratioP2nd/Pcylincreased with increasingL/D. (2) Under certain conditions, the blast loading induced by a cylindrical charge(PcylandIcyl)can be substituted by the blast loading induced by a spherical charge(PsphandIsph)of equal mass;i.e.,the effect of the charge shape on the blast loading can be neglected.In the 45◦and 67.5◦directions in the axial plane,the effect of the charge shape on the blast loading can be neglected atZ>2 m/kg1/3.In other directions,the effect of the charge shape onPcylcannot be neglected over the entire range ofZvalues investigated(i.e.,Z<4.2 m/kg1/3)owing to the presence of secondary shockwaves.WhenZ>3.2 m/kg1/3,the effect of the charge shape onIcylcan be neglected in all directions. (3) Under certain conditions, the blast loading induced by a cylindrical charge (PcylandIcyl) withL/D= 2 can be used as a substitute for that of other cylindrical charges with the same mass but differentL/Dvalues; i.e., the effect ofL/Don the blast loading can be neglected.WhenL/D≥2 andZ>2.2 m/kg1/3,the effect ofL/DonIcylcan be neglected.WhenL/D≥2,its effect on the radialPcylcan be neglected for the entire range ofZvalues investigated (i.e.,Z< 4.2 m/kg1/3). In contrast, the effect ofL/DonPcylmust be considered in the axial direction for the entire range ofZvalues investigated. (4) The average maximum ratio of the blast loading induced by a cylindrical charge(PcylandIcyl)to that induced by a spherical charge(PsphandIsph)was approximately 2.5(1.5)in the axial(radial) direction, with both maxima occurring withinZ< 1 m/kg1/3. The maximum ratios in the other directions were essentially 1,and mostly occurred withinZ>2 m/kg1/3. (5) For the close-in range, thePcylin the axial direction was greater than that in the radial direction, while the opposite was true for the far-field range.The axialIcylwas greater than the radialIcylwithin a small range aroundZ= 1 m/kg1/3,while the opposite was true outside this range. (6) WhenZ<2 m/kg1/3,the single-end detonation configuration resulted in average increases in axialPcylandIcylof 10%compared with the central detonation configuration, but there were hardly any changes in the radialPcylandIcyl,and a considerable decrease was observed in the opposite axial(180◦) direction. The double-end detonation configuration increased the radialPcylandIcylby a maximum of ~60%compared with the central detonation configuration. Note that this study was limited to the investigation of blast loadings induced by cylindrical charges with 1 ≤L/D≤5 at a relatively closeZ< 4.2 m/kg1/3. Furthermore, the proposed empirical equation for the axialPcylwas limited toZ<2 m/kg1/3owing to the complexity of considering the primary and secondary shock waves as well as the limitations associated with discrete experimental data at far-field distances. In future work, the authors intend to expand upon the constructed FEM and proposed empirical equations by analyzing the size and distribution of the reflected load from the detonation of a cylindrical charge on a rigid plane. Declaration of competing interest The authors declare that they have no known competing financial interests or personal relationships that could have appeared to influence the work reported in this paper. Acknowledgments Funding: This work was supported by the National Natural Science Foundation of China [No. 51978166]. We would like to thank Editage[www.editage.cn] for English language editing.2. Development of a high-fidelity fem
2.1. Geometry, domain, and boundary conditions
2.2. Material model and parameters
2.3. Mesh resolution convergence


3. Field test and fem validation
3.1. Single-end detonated cylindrical charge





3.2. Double-end detonated cylindrical blast test

4. Analysis of P2nd
4.1. Generation of secondary shock waves
4.2. Magnitude and distribution
5. Analysis of parameter influence
5.1. Influence of detonation configuration


5.2. Influence of charge shape



5.3. Influence of L/D

5.4. Influence of charge orientation

6. Empirical cylindrical charge blast loading model
6.1. Model considering the effects of detonation configuration and charge orientation
6.2. Model considering the effect of L/D
7. Conclusions
杂志排行
Defence Technology的其它文章
- A review on lightweight materials for defence applications: Present and future developments
- Study on the prediction and inverse prediction of detonation properties based on deep learning
- Research of detonation products of RDX/Al from the perspective of composition
- Anti-sintering behavior and combustion process of aluminum nano particles coated with PTFE: A molecular dynamics study
- Microstructural image based convolutional neural networks for efficient prediction of full-field stress maps in short fiber polymer composites
- Operational feasibility study of stagnation pressure reaction control for a mid-caliber non-spinning projectile
