Reactive jet density distribution effect on its penetration behavior
2023-07-04HuanguoGuoChenghaiSuYiqiangCaiSuoHeQingboYuHaifuWang
Huan-guo Guo, Cheng-hai Su, Yi-qiang Cai, Suo He, Qing-bo Yu, Haifu Wang
State Key Laboratory of Explosion Science and Technology, Beijing Institute of Technology, Beijing,100081, China
Keywords:Shaped charge Reactive jet Density distribution Jet penetration Virtual origin
ABSTRACT
1. Introduction
Reactive liner shaped charge (RLSC) can form a high-velocity reactive jet. It can not only penetrate a target with kinetic energy but can also release chemical energy inside of the target,producing extremely large amounts of damage to concrete and steel targets[1—4].The reactive jet can also produce great behind-target effects by combining the damage mechanisms of kinetic energy penetration and energetic material deflagration [5—7]. Owing to the excellent damage performances and potential applications in military, RLSC has received extensive attention in recent years.
Baker and Daniels presented a unitary demolition warhead with a reactive material liner. It can make extreme damage to concrete,masonry and geologic material targets [1,8]. Studies on pure concrete and multi-layered concrete targets indicated that the reactive jet can form a funnel crater and cause catastrophic damage to the entrance area [9,10]. Further researches on steel targets showed that, compared with traditional copper jet, the reactive jet can produce a relatively larger but shallower crater. But the violent deflagration of reactive jet inside the crater can cause structural damage to the thick steel plates [11,12]. Moreover, the energy release characteristics and aftereffect overpressure of the reactive jet perforating into the concrete and steel targets were investigated[13—15]. As such, these studies mainly focused on the penetration performances of RLSC and structural damage effect of various potential targets. However, there are few researches on the penetration mechanism of the reactive jet. Especially, the radial growth process of the crater has not been well characterized.
Compared with the reactive jet,the various penetration models of traditional metal jet impacting the target with different materials have been conducted [16—20]. Many of them have been established based on the concept of virtual origin which was first proposed by Allison [21]. In addition to the penetration depth,crater diameters have also been focused by researchers [22—26].Szendrei[24]presented an analytical model for the radical growth of the crater. Held [25,26] slightly modified Szendrei theory and proposed an equation for the crater radius as a function of time.However, the analytical models based on the virtual origin and Szendrei-Held equations considered the velocity distribution of metal jet, but the jet density remains constant in the penetration process. In fact, the material of the reactive liner is fabricated by introducing active metal powders into a polymer binder, typically such as polytetrafluoroethylene (PTFE)/Al, PTFE/Ti and PTFE/Cu[27—30]. As such, the reactive material liners essentially belong to the powder liners. Currently, the density deficit was observed in jets formed from the powder mental liners [31—33], and the modified penetration model of W—Cu jets with non-uniform density distribution was established [34]. However, existing research on the density distribution of the PTFE-based reactive jet is scarce,and the effect of the reactive jet density distribution on its penetration behavior is not well understood.
This paper presents such a research,beginning with the density distribution of a reactive jet during the formation process. Subsequently, the analytical models for penetration depth and radial cratering of reactive jet are presented. To verify the analytical models,a series of experiments on RLSC against steel plates under different standoffs are carried out. Finally, the crater profiles predicted from the analytical model are compared with the experimental results.
2. Density distribution of reactive jet
2.1. Numerical method and material model
The formation process of reactive jet is simulated using the axisymmetric model based on the platform of Autodyn-2D code.RLSC is composed of a reactive liner,explosive,and a detonator.The configuration is shown in Fig.1.The base diameter and length of the shaped charge are 48 mm and 66 mm, respectively. The liner thickness and cone angle are 5 mm and 50◦, respectively.
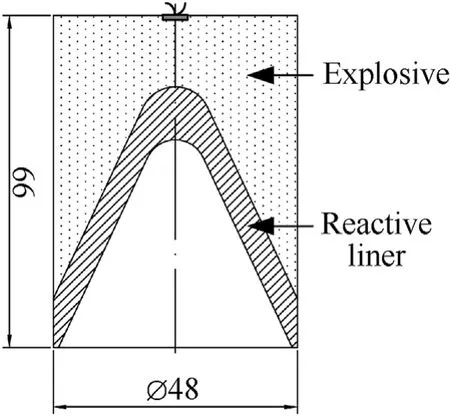
Fig.1. Configuration of RLSC.
The simulation model is shown in Fig. 2. The explosive and reactive liner are meshed by Eulerian algorithm to accommodate the great deformation. The size of the Euler domain is 50 × 200 mm2. The outside of RLSC is filled with air, and the boundary condition of air (Euler) domain is set as “Flow out (ALL EQUAL)” to eliminate the influence of the boundary effect. The materials of the liner and explosive are reactive materials(73.5 wt%PTFE and 26.5 wt% Al powders) and 8701 explosive, respectively.Detailed material models and equations of state,failure and erosion criterions of RLSC each part are listed in Table 1.

Table 1Material models and equations of state, failure and erosion criterions of RLSC each part.
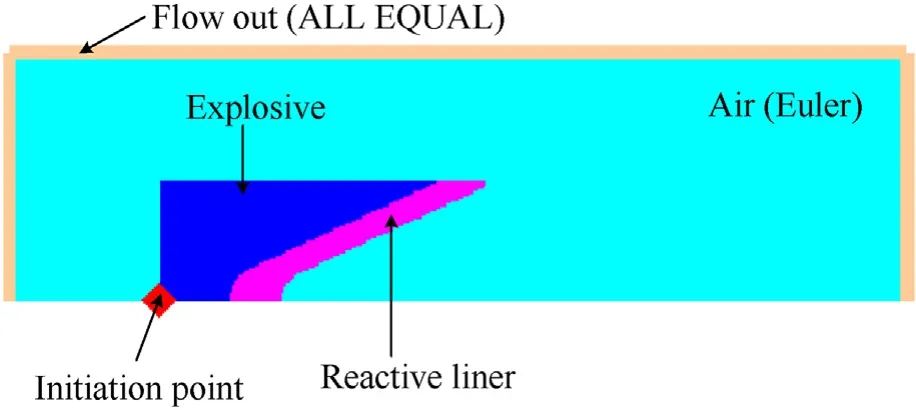
Fig. 2. Numerical model (1/2) of RLSC.
The material of liner is PTFE/Al reactive materials. They are modeled with a shock equation of state. The relation between the velocityUsand the particle velocityupcan be approximated by Ref. [35].
where the Grüneisen parameter, Γ, was treated as a constant;c0andSwere based on date from plate-on-plate impact tests performed on the material.The values of Γ,c0,andSin Table 5 were obtained from Taylor [35,36].
The reactive liner materials are described by the Johnson—Cook strength model. The model describes the behavior of materials under high strain, high strain rate and high temperature. This material model can be expressed as follows:
whereA, B, C, M, Nare material constants, is the effective plastic strain, and ˙ε*is the dimensionless strain rate.Tmis the melting temperature of the considered material,TandTroomare the surrounding and the room temperature, respectively. The main parameters of reactive liner materials are shown in Table 2.

Table 2Material parameters of the reactive liner.
The choice of main charge is 8701 explosive, which material model by Jones-Wilkins-Lee(JWL)EOS.Table 3 represents the main parameters of 8701 [12].

Table 3Material parameters of 8701 explosive.
The material parameters of air are derived from reference [12],and the main parameters are listed in Table 4.WhereCpandCvare specific heat at constant pressure and specific heat at constant volume, andE0is specific energy of air.

Table 4Parameters of air.
2.2. Mesh sensitivity for the jet formation
It is well known that the size of the mesh may affect the simulation results [37,38]. To study the effect of the mesh density on the reactive jet formation characteristics, uniform square meshes of 0.20 mm, 0.25 mm, and 0.40 mm were selected for the Euler domain of 50 × 200 mm2.
For the reactive jet formation algorithm,a fixed gauge point was located at a distance of 48 mm (i.e. one charge diameter; 1.0 CD).The velocity-time history indicating the effect of the mesh size on the tip velocity of the reactive jet is shown in Fig. 3. When the reactive jet tip reaches the gauge point,the simulation results show that the coarse mesh(i.e.0.40×0.40 mm2)model have the lowest tip velocity. This phenomenon verify that the size of the mesh affects the jet tip velocity.However,as shown in Fig.3,the velocities of the rest part of reactive jet with different mesh sizes are overall convergent.
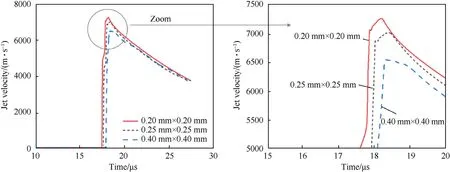
Fig. 3. Velocity-time histories for the reactive jet at the gauge point using different mesh sizes.
When the mesh size is 0.20×0.20 mm2,Fig.3 shows that the jet tip velocity is the maximum. However, the simulation used nearly twice the time of that using the mesh size of 0.25×0.25 mm2.The difference between the tip velocities in both the 0.20 mm and the 0.25 mm mesh sizes is only 197 m/s (i.e. 2.7%). Thus, considering reasonable accuracy and calculation time, the mesh size of Euler domain for the reactive jet formation is set to be 0.25×0.25 mm2.
2.3. Reactive jet formation behavior
The velocity and density distributions of reactive jet att=22 μs is shown in Fig. 4, in which black curves refer to velocity anddensity values along the axis.It can be seen from Fig.4(a)that the velocity of jet tip is higher than that of the slug.Namely,there is a velocity gradient in the reactive jet. This is mainly because the charge mass at the top of reactive liner is greater than that at the bottom, which can dramatically improve the compressive and closed speed of the top liner.For the shaped charge penetrator,the section with a velocity higher than 2000 m/s is usually called jet.In Fig.4(a),vcis the cut-off velocity when the last jet element that has hydrodynamic penetration capability impacts the target.Generally,its value depends on the target hardness, contributing to the total penetration depth [39]. Compared with the slug, the velocity gradient of jet section is larger. Simulation results further prove that the velocity gradient in jet is approximately linear distributed.
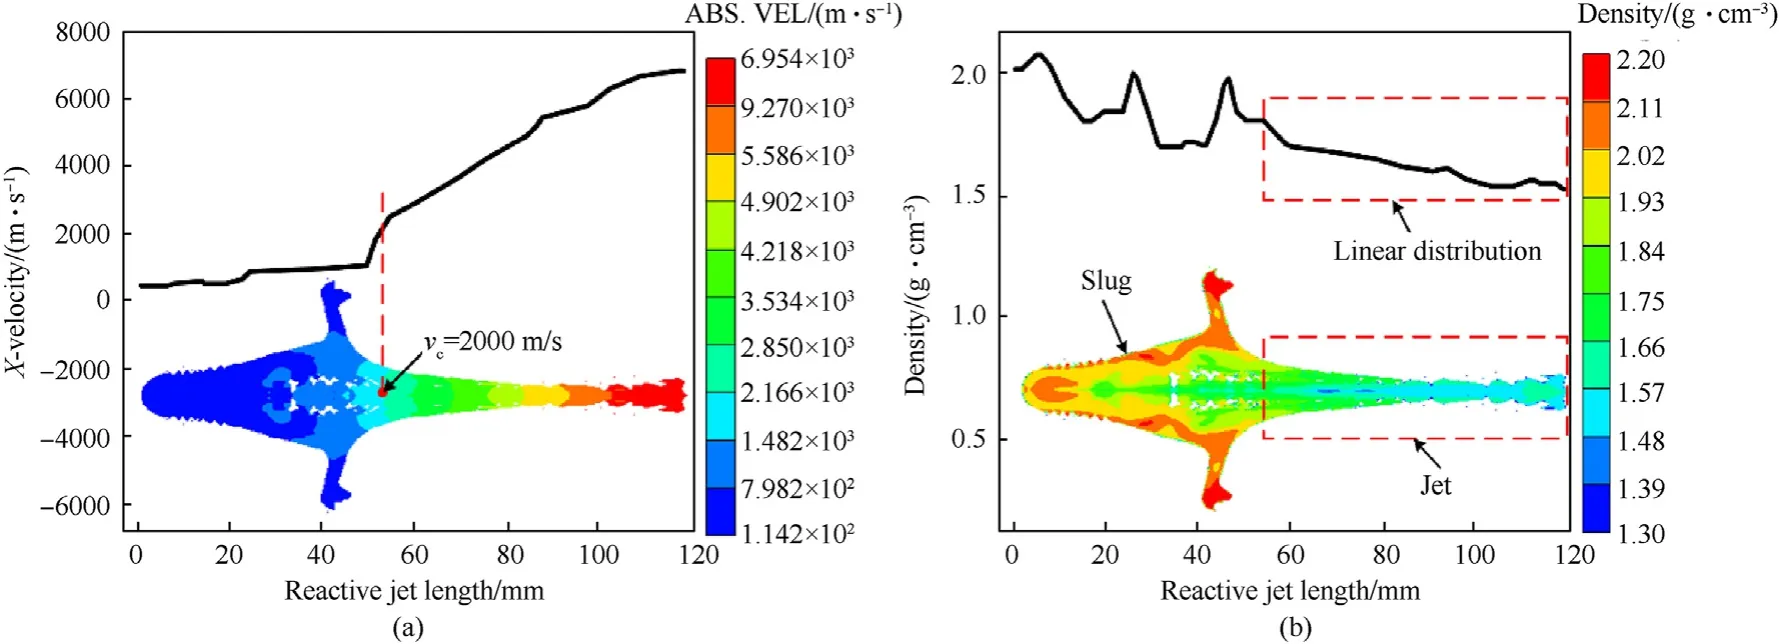
Fig. 4. The velocity and density distribution of reactive jet at t = 22 μs: (a) Velocity distribution along the axis; (b) Density distribution along the axis.
There is a certain gradient in the entire density of reactive jet att= 22 μs, as shown in Fig. 4(b). In the reactive jet, the density increases gradually from the jet tip to tail.The density distribution of the slug section is complex and uneven.On the whole,the density at the axis is low and gradually increases from center to outside.However,the maximum density of the slug section is also less than the density of reactive liner materials.In the jet section,the density distribution is relatively uniform and the density gradient is approximately linear distribution. The current density of jet tip is about 1.5 g/cm3,which is significantly lower than the initial density.It should be noted that the density decreasing effect in the highvelocity jet section has a significant influence on its penetration capability. As such, the jet current density should substitute the initial density in the penetration model when the reactive jet impacts the target.
Generally, the density of the collapsed liner material is directly related to the liner compressibility and the pressure generated from the explosive load according to reference [39]. During the formation process of the reactive jet, the density distribution of the reactive liner materials is shown in Fig. 5. According to the simulation results,the reactive liner begins to be crushed and deformed toward the axis under the detonation effects of the shaped charge.At the same time,the porosity in the material decreases during the process.As such,the density of the outside part of the reactive liner is higher than that of the liner material(seet=5 μs andt=6 μs).Then,the elements at the interface between the jet and slug collide violently, which causes an increase in the density of the liner material at this point (seet= 8 μs andt= 10 μs). The reactive jet is gradually stretched along the axis direction due to velocity gradient. There will be a coexistence of compression and tensile states,resulting in a sharp fluctuation in the density of reactive jet.However, as the reactive jet is stretched, the density in the jet decreases rapidly in the fluctuation (seet= 16 μs). During the jet formation process, the density-time curve of the jet tip and the position wherevc=2000 m/s is shown in Fig.6.The jet tip density decreases gradually as the time. And the density of the position
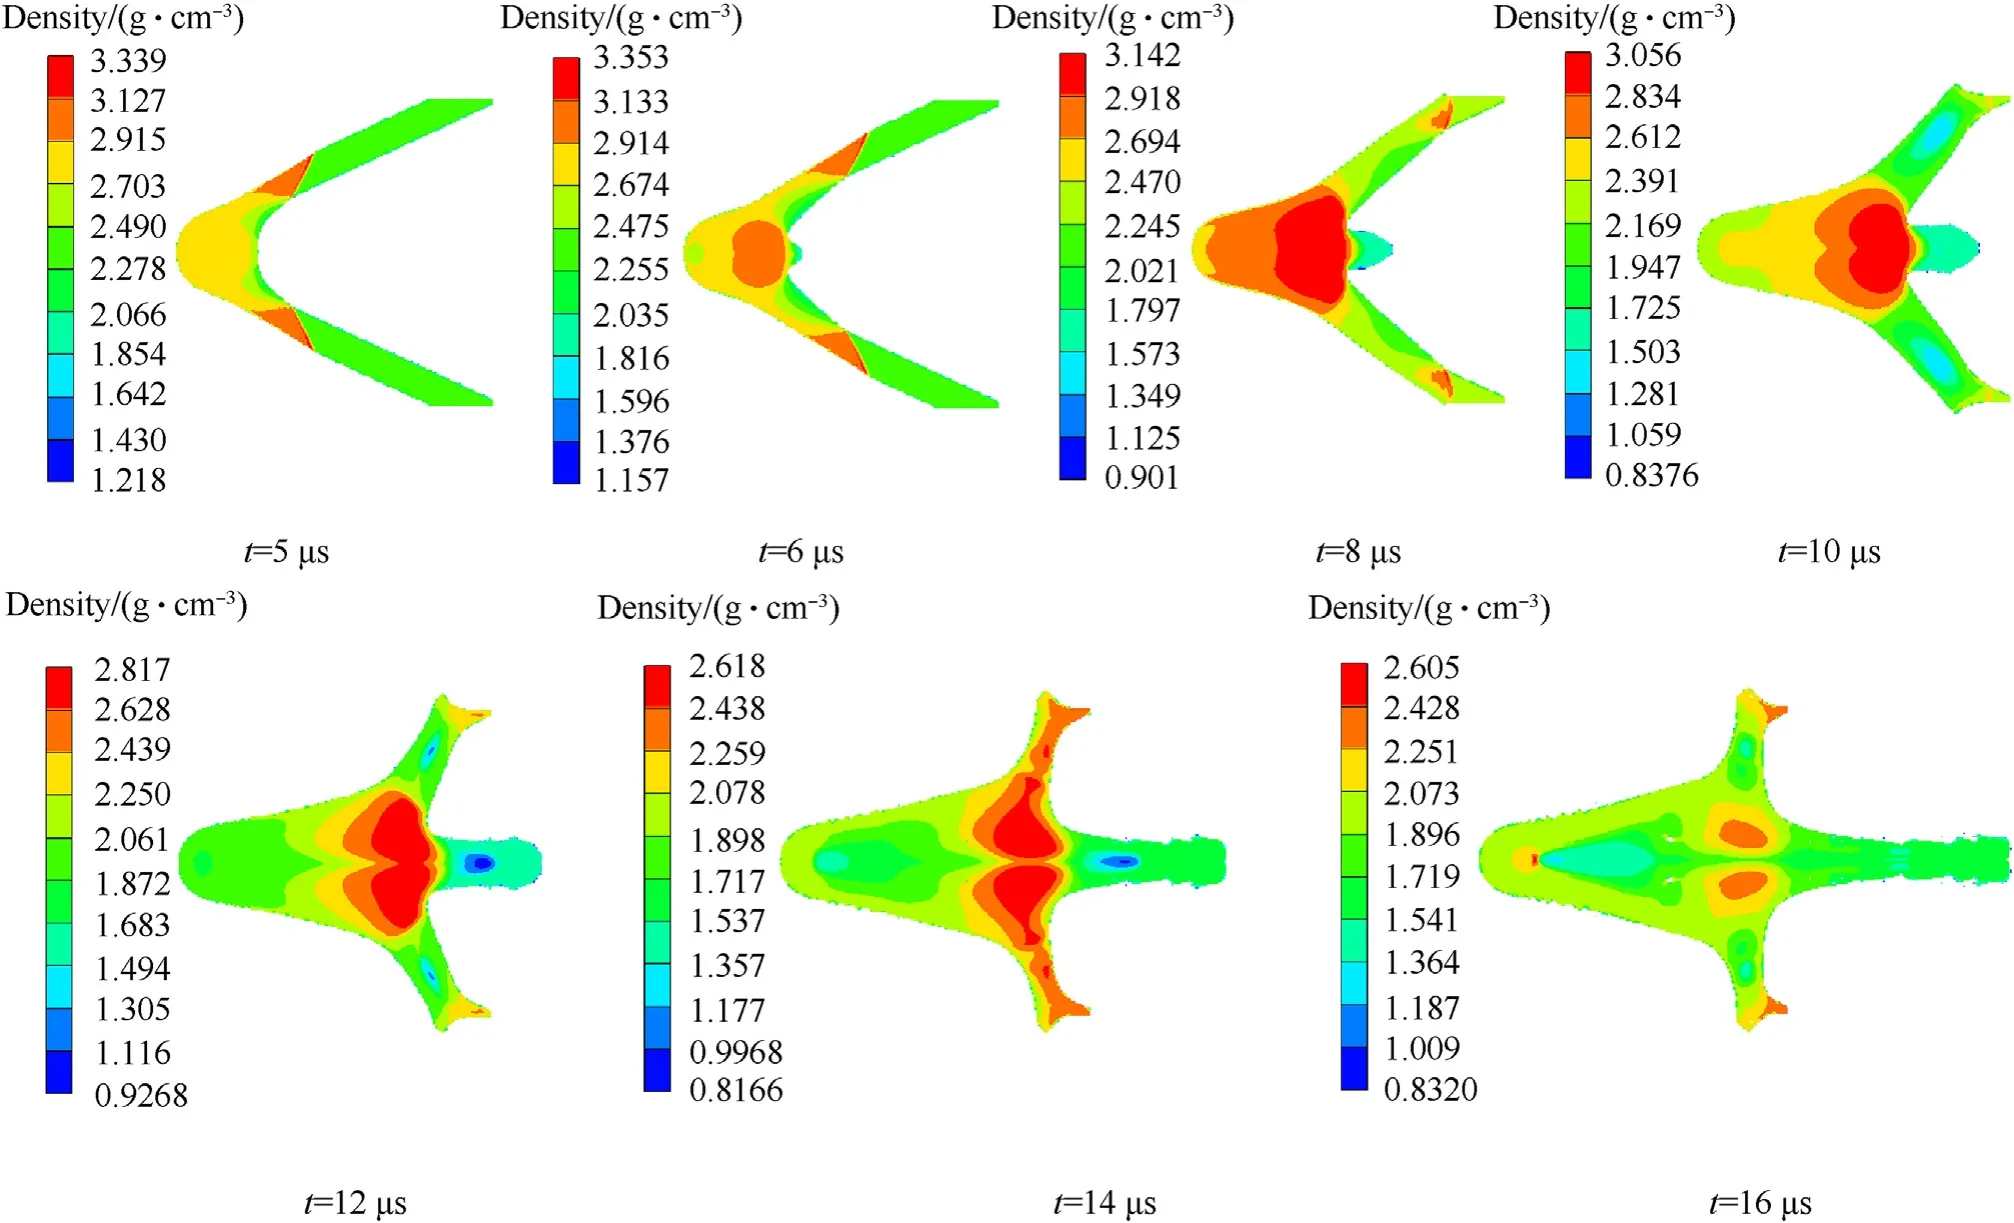
Fig. 5. The density distribution during the formation process of reactive jet.
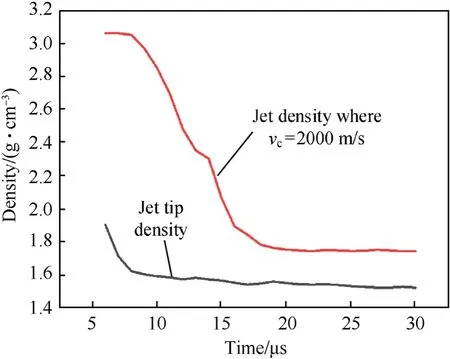
Fig. 6. Density-time curves of jet tip and the position where vc = 2000 m/s.

Fig. 7. Reactive liner and RLSC sample.
wherevc= 2000 m/s first increases and then decreases rapidly.When the formation time reaches 22 μs,the density gradient in the jet section tends to be constant.
2.4. Simulation verification
The X-ray experiments of RLSC were carried out to verify the reliability of numerical simulations. RLSC used in the X-ray experiment was the same as the numerical simulation,as shown in Fig.7.The base diameter and length of the shaped charge are 48 mm and 66 mm, respectively. The reactive liner was composed of mass matched ratios of 26.5% Al and 73.5% PTFE powders. It was consolidated by a cold pressing/sintering process [11]. The wall thickness, cone angle, and mass of the reactive liner were 5 mm,50◦, and 48.6 g respectively. The density of reactive liner was approximately 2.3 g/cm3. The main charge was obtained by pressing 8701 explosive into a special die under a pressure of 200 MPa. The density and mass of explosive were approximately
1.70 g/cm3 and 120 g, respectively.
The X-ray experimental setup is shown in Fig. 8. The explosive was initiated through a detonator placed on the center of the shaped charge. The standoff is a hollow cylinder with an outer diameter of 48 mm and an inner diameter of 44 mm.The standoff cylinder is machined by nylon, and its density is approximately 1.1 g/cm3. The height of the standoff cylinder is 450 mm, and it is mainly used to support RLSC. The American HP company X-ray pulse test devices were used in the experiment[29].In the test,two X-ray tubes were set in different positions,thus two appearances of the jet at different times were obtained on the negative films.Two X-ray tubes have different time delays.The shooting time was set as 18 μs and 21 μs, and the actual exposures time was 18.7 μs and 21.8 μs, respectively. Fig. 9 shows both reactive jets in numerical simulations and X-ray photos of the RLSC at two exposures time.
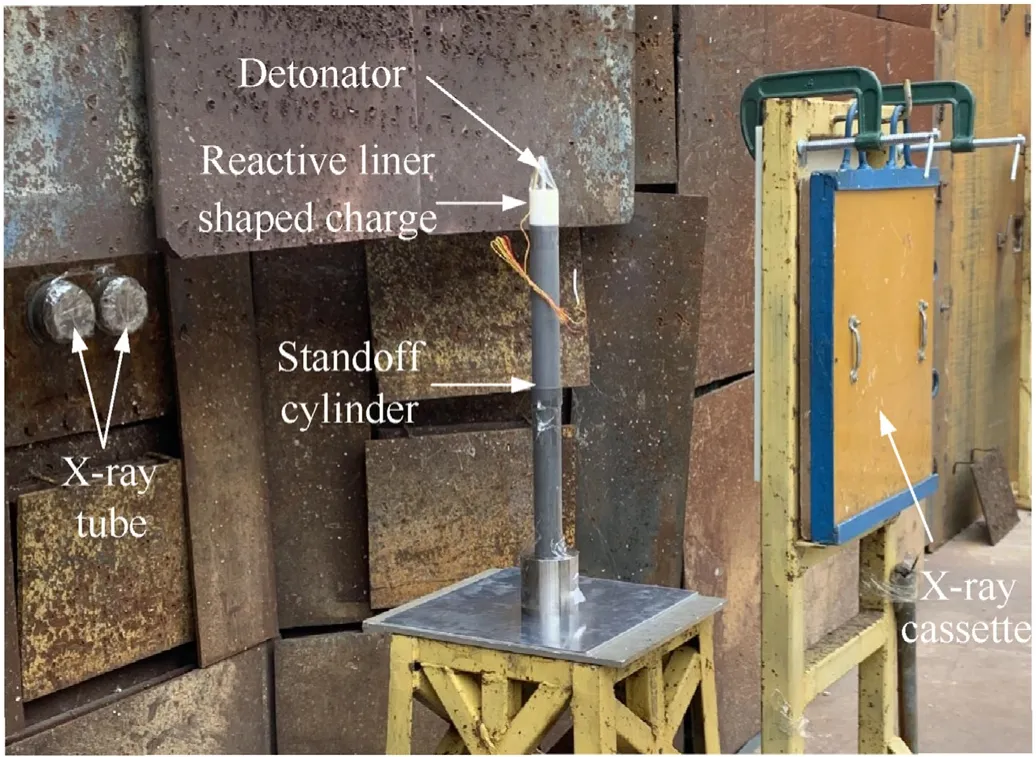
Fig. 8. X-ray experimental setup.
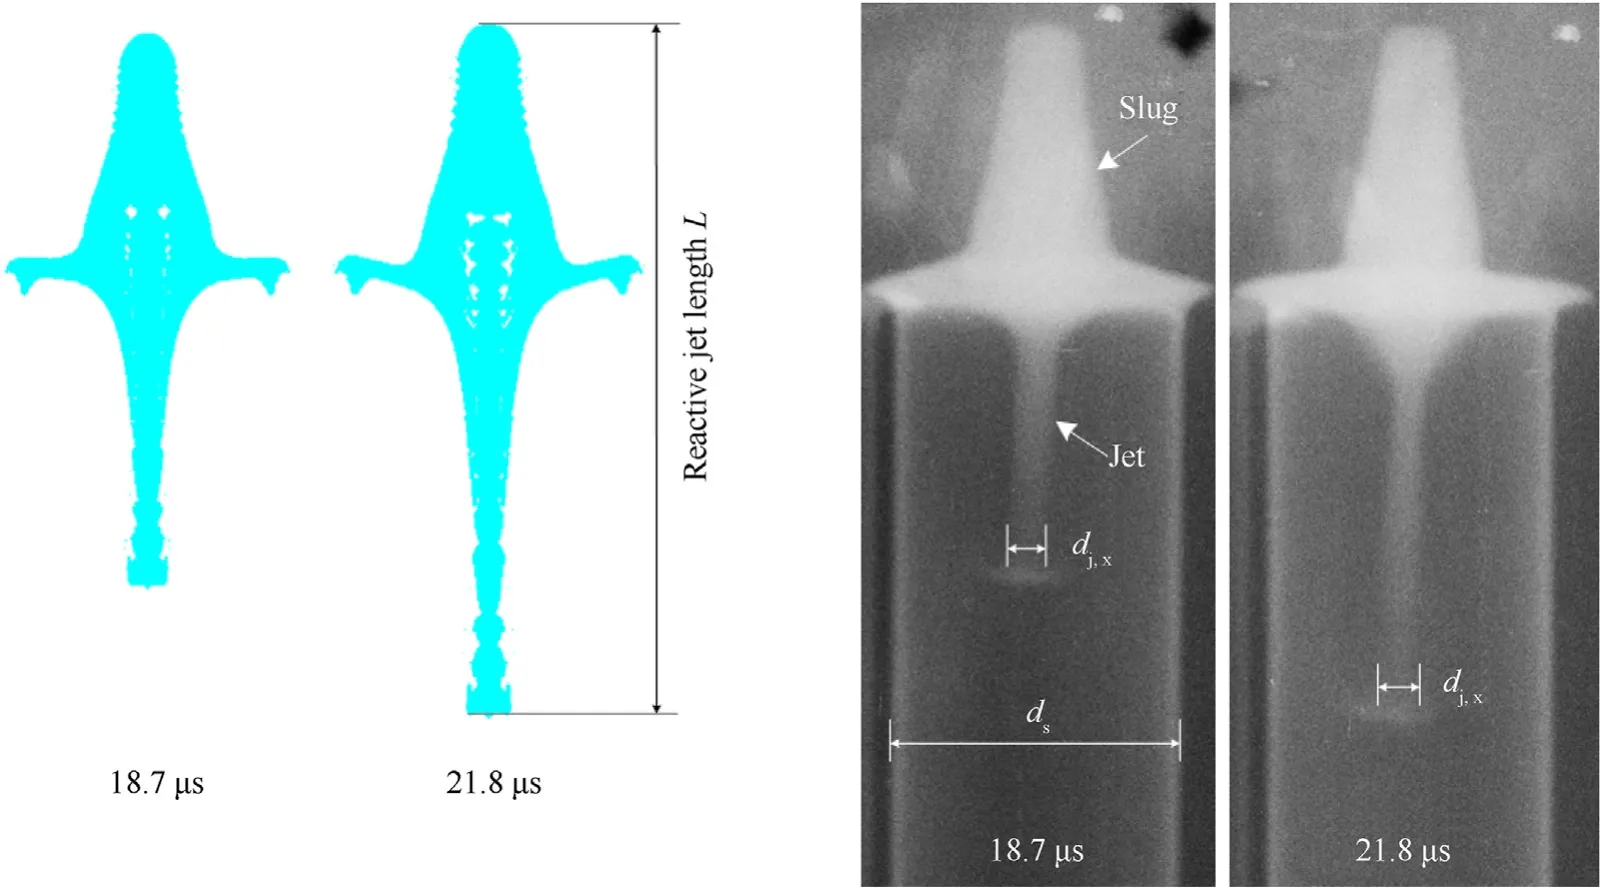
Fig. 9. Reactive jets in simulations (left) and X-ray photos (right) at 18.7 μs and 21.8 μs.
X-ray results show that, at 18.7 μs, the liner with PTFE/Al reactive materials can form a reactive jet with excellent performance,including the distinct outline,clear jet tip and slug section,satisfied continuity and symmetry. It can be seen from Fig. 8 that the imaging color of the slug section is brighter in comparison to the jet section.This is mainly because the density of the slug is larger,and the higher the density is,the clearer the X-ray image is[29].For the jet section, the entire density is smaller, resulting in a shallower image. Furthermore, radiographs show an increase in the jet density from tip to tail. However, for the jet tip section, its boundary becomes blurry at 21.8 μs. The phenomenon indicates that the density of the jet tip will gradually decrease during the formation process, which is the same of the simulations.
From the X-ray pictures of the shape of reactive jets,the length and diameter of reactive jets at two-exposures time can be measured by image processing (such as the Photoshop software).To raise measurement accuracy, the data is measured three times,and the average values are the reactive jet lengthLxand the jet tip diameterdj,xin the X-ray pictures, as shown in Fig. 9. The 48 mm diameter of standoff cylinder in the experiment is taken as the benchmark. Based on the diameterdsof the cylinder in the X-ray picture,the magnification ratio η can be calculated.Then,the actual length of the reactive jetLand jet tip diameterdjcan be calculated according to the principle of geometric similarity.Based on the jet tip relative position at two exposures time and the absolute time,the average tip velocity of the reactive jet can be calculated [40].The reactive jet has entered the free flight stage at two moments,it can be considered that the calculated average velocity is the jet tip velocity in X-ray experiment.
The comparison between X-ray results and simulations of reactive jets is illustrated in Table 5. At 18.7 μs and 21.8 μs, the tip velocities of reactive jets in the simulations are 7008 m/s and 6954 m/s,and the errors from the X-ray experimental ones are 1.7%and 1.0%,respectively.For the length of reactive jet,the simulation results are also close to the X-ray experiments and the maximum deviation of is 3.6%.Compared with the numerical simulations,the jet heads in the X-ray experiments are larger, showing an obvious accumulation phenomenon.In addition to the interaction with the bow shock in the air,this is mainly because the reactive jet presents different degrees of divergence and expansion effects during the jet formation.The expansion effects in jet head will become more and more obvious as the formation time increases [28,29]. This is also the reason why the error from the jet tip diameter at 21.8 μs is larger than that at 18.7 μs.However,the errors between the jet tip diameters in the X-ray experiments and the simulations are also less than 10%. These phenomena indicate that the simulations of reactive jet formation are very similar with X-ray results.

Table 5Comparison between the X-ray experiments and the simulations.
Moreover, according to references [28,29], the reaction in the polymer-metal jet within 2.0 CD is rather limited. Its influence on the formation of the reactive jet can be ignored. Therefore, the explosion model of the reactive liner materials can be neglected when simulated the formation characteristics of reactive jet within a standoff of 2.0 CD.Based on the discussion above,the parameters of reactive jets for other configurations of RLSC in this paper were obtained using the AUTODYN-2D finite-difference Eulerian code.
3. Analytical model for reactive jet penetration
3.1. Penetration depth
In the penetration process of reactive jet against steel target,because of the velocity gradient in the reactive jet, it will be gradually elongated during the penetration process.Based on the virtual origin theory, following assumptions are proposed during the penetration process of reactive jet:①The jet section is divided intoninfinitesimal elements, and the jet is assumed to be continuous without breaking. ②Each reactive jet element is approximately a cylinder. ③Each reactive jet element can be elongated, but the element mass and velocity remain unchanged. ④The internal velocity gradient of each jet element is ignored.⑤It is assumed that the subsequent element velocity is not affected by the high temperature, high pressure, and high strain rate generated by the previous jet element penetrating into the target.
Fig.10 illustrates the penetration process of a reactive jet against a steel target. When the jet head reaches the upper surface of the target, it is assumed that the jet formation time ist0, as shown in Fig.10(a).For the jet elementi,the average velocity of the element isvj,i, the element length isl′j,i, the element radius isr′j,i, and the average density of the element is ρ′j,i. Based on the reactive jet formation behaviors, it can be assumed that the velocity, radius,and density of the reactive jet follow a linear distribution. The following relationships can be obtained

Fig.10. Penetration process of the reactive jet penetrating steel target: (a) t = t0; (b) t = ti.
wherevj,vc,rj,rt,ρj,0, ρj,t, andLjare the jet tip velocity, the jet tail velocity,the jet tip radius,the jet tail radius,the jet tip density,the jet tail density, and the effective jet length at timet0, respectively.For 45# steel target,vc= 2090 m/s [41]. The performance parameters of reactive jet can be obtained by numerical simulations at timet0.
Based on the assumption ③, the mass of the jet elementiis constant, so the element density changes with its volume during the penetration process.The radial velocity of the elementican be ignored during the penetration process, so the radiusr′j,iof the elementidoes not change.When the elementireaches the target atti, due to the stretching of the reactive jet, the lengthlj,i, radiusrj,iand density ρj,iof the elementiare as follows:
wheretiis the time at which the elementireaches the target, as shown in Fig.10(b).The penetration depth isPi-1when the elementibegins to penetrate the target, so the timetiis given by:
whereHiis the distance between the elementiand the surface of the target at timet0.
When a reactive jet penetrates a steel target,the initiation delay time of the reactive jet τ is the primary determinant of the penetration depth[11].Ifti≥τ,the penetration process is over and the penetration depth isPi-1. Ifti<τ,the reactive jet will continue penetrating the target.
Compared with the strength of steel target, the reactive jet strength can be ignored.For the reactive jet elements,the chemical reaction of each element has little effect,so the penetration process of each element still satisfies the Bernoulli equation [26]. The deflagration pressureYof reactive jet is introduced to modify the Bernoulli equation, and the penetration equation of the elementican be described as follows:
where ρtandRtare the density and the target resistance, respectively. According to references [42,43], the target resistance in the penetration of a thick metallic target was given by
whereEis the Young's modulus andYtis the target yield strength.According to reference [39], for the jet penetration model, the values of the constantAandBin the target resistance function were selected to be 1.38 and 0.73,respectively. For #45 steel,the values ofEandYtwere 209 GPa and 510 Mpa according to reference[44].Then,the target resistance of#45 steel is calculated by Eq.(11)and the value is 3.59 GPa.
Yiis the pressure generated by the chemical reaction of the elementiin the crater, which is calculated as follows:
where Δmiis the mass of elementi,andkis a constant determined by experiments and the value is about 0.265 MPa/g for the PTFE/Al reactive materials [4].
According to Eq. (10), the penetration velocity of the elementiinto the steel target is as follows:
Then,the penetration depth of the elementican be expressed as follows:
wheretp,iis the penetration time of the elementi.According to the length and erosion velocity of the elementi,the penetration time of the elementiis determined as follows:
as such, when the penetration of the elementiis completed, the penetration depth of the reactive jet can be described as follows:
If (ti+tp,i) ≥τ,the penetration process is over and the penetration depth of the reactive jet isPi.If(ti+tp,i)<τ,the penetration process will continue and the penetration depth is still calculated according to Eq.(10)-Eq.(17)until the penetration time reaches τ.
In fact, the velocity and density distribution characteristics of the reactive jet are complex.Three zones of high temperature,high pressure and high strain rate will be formed during the penetration process of previous elements into the target.When the subsequent element penetrates the target in three high zones, the energy consumption will reduce to some extent. In addition, three high zones will also accelerate the reaction rate of subsequent jet element. When the reaction rate is greater than the penetration rate,reactive materials accumulated in the crater will have a violent deflagration reaction, releasing a large amount of chemical energy and gas products. In other words, when the penetration time reaches the initiation delay time of reactive materials,the subsequent reactive penetrator will experience an instantaneous deflagration[11].
3.2. Radial cratering
The radial cratering process of RLSC against the target is essentially a process that the pressure acting on the wall of the crater overcomes the target strength and causes the crater to increase. Based on Szendrei theory [24], the radial cratering growth velocity of the target is equal to the axial penetration velocity of the jet, and the target strength has a significant influence on the cratering velocity and crater radius. With the modified Bernoulli equation[25],the stagnation pressurepiof the elementiimpacting steel target can be described as follows:
whereuc,iis the radial cratering velocity, i.e.,uc,i=up,i. It can be assumed that the axial penetration timetp,iof the elementiis equal to the radial cratering time, the radial cratering velocity is expressed as follows:whererc,iis the crater radius of the elementi.
Szendrei theory also assumes that the stagnation pressure and the area of the jet at the crater bottom remains constant, i.e.,pi∙ai=pi,0∙ai,0.According to reference[45],the initial crater radius of the elementiisr0,i=Therefore, when the elementipenetrates the target,the relationship between the stagnation pressurepiand the initial stagnation pressurepi,0is given as follows:
where the initial stagnation pressurepi,0can be expressed by
Combining Eq.(20)and Eq.(21),when the elementipenetrates the target,the relationship between stagnation pressurepiand the crater radiusrc,iis given by
Thus,the radial cratering velocityuc,iand the crater radiusrc,iis given by Eq. (22), as follows:
The integration of Eq. (23) gives the relationship between the crater radiusrc,iand the penetration timetp,i
withA=
When the radial cratering velocityuc,iis reduced to zero, the crater diameter of the reactive jet will no longer increase, and the crater radius reaches the maximum.The final crater radius is given as follows:
whereAandCreflect the kinetic energy and chemical energy of reactive jet element respectively, andBrefers to the resistance of steel target.Eq. (25) indicates that the radical cratering of reactive jet is composed of three parts:1)the initial radial crater produced by the reactive jet overcoming the target resistance;2)the inertial forces generated by target particles flowing further expand the formed crater; 3) the reactive materials of each jet element experience a violent chemical reaction and produce significant pressure within the crater, thus further expanding the crater diameter.
4. Penetration experiments
Experiments of RLSC against steel plates were carried out in order to verify the correctness of the analytical model of penetration depth and radial cratering.Four standoffs of 0.5,1.0,1.5,and 2.0 CD were selected to conduct penetration experiments.
4.1. Experimental setup
In the penetration experiments, the material of reactive liners was also composed of mass matched ratios of 26.5% Al and 73.5%PTFE powders, and the density of reactive liners was about 2.3 g/cm3.The reactive liner specimens are shown in Fig.11.The prepared reactive liners were the same shape, with the base diameter of 66 mm, the cone angle of 60◦, and the wall thickness of 6.6 mm.
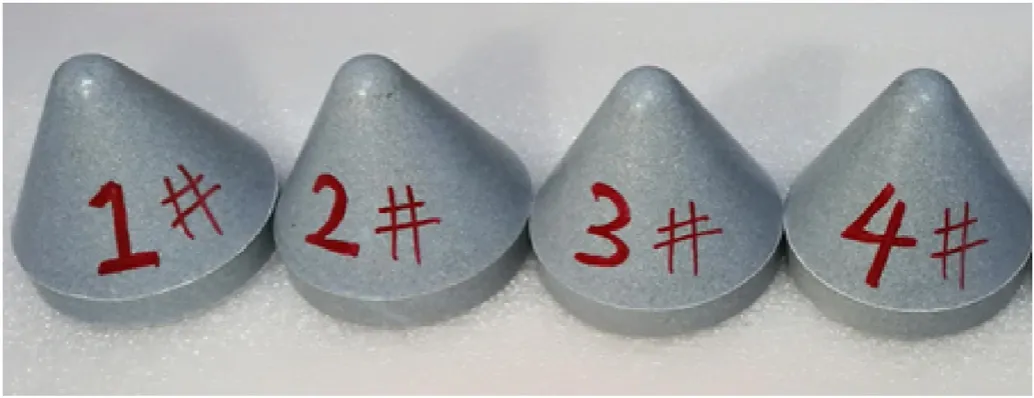
Fig.11. Reactive liner specimens for penetration experiments.
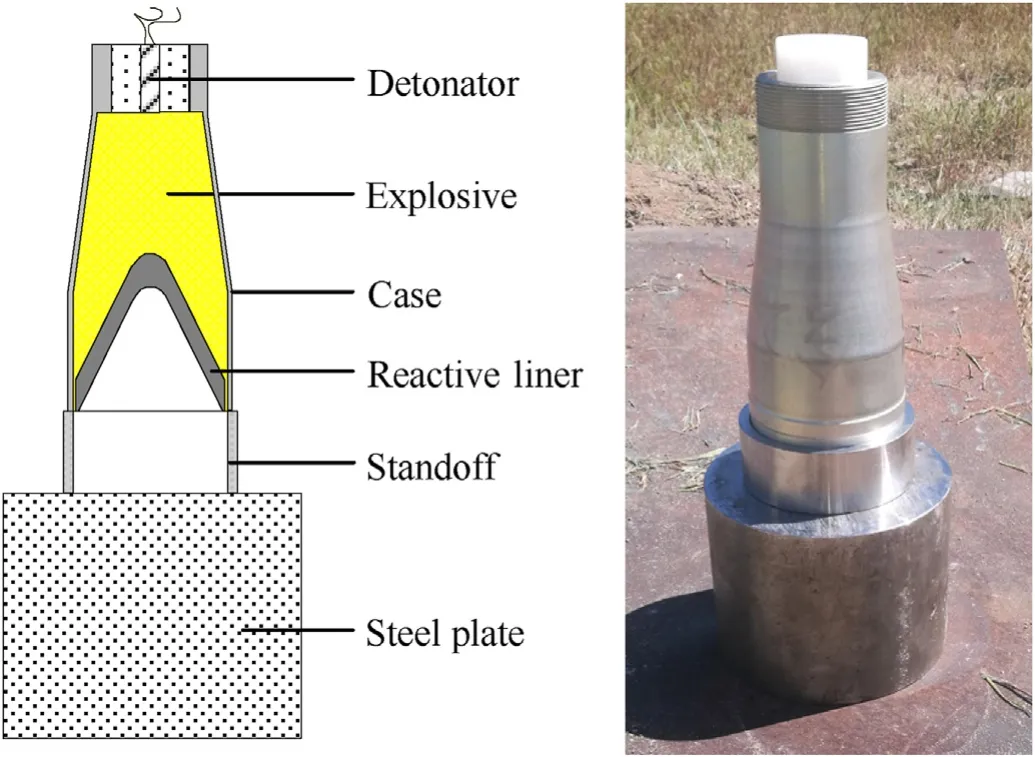
Fig.12. Experimental setup for RLSC against steel plate.

Fig.13. Experimental results of steel plates impacted by reactive jets under different standoffs: (a) 0.5 CD; (b) 1.0 CD; (c) 1.5 CD; (d) 2.0 CD.
Fig. 12 shows the experimental setup for RLSC against steel plates.The shaped charge was consisted of detonator,high-energy explosive, a reactive liner and a case. The main charge was 8701 explosive with a density of 1.70 g/cm3,and the detonation velocity was approximately 8315 m/s.The height of explosive was 110 mm and it was initiated by a detonator placed on the center of the bullet.The case was machined by LY12 Aluminum with a thickness of 2 mm.The target was#45 steel cylinder with a 120 mm diameter and a 100 mm height.
4.2. Experimental results
Experimental results of steel plates impacted by reactive jets under different standoffs are shown in Fig. 13. After experiments the targets were sawn in half, the crater profiles are presented in Fig. 14. As shown in Fig. 13, when the standoff is 0.5 CD, the penetrated steel plate splits into two fragments accompanying with four large cracks.Under standoff of 1.0 CD,there formed four cracks.Three of them propagate throughout the upper surface of the target. Whereas, there is no crack in the steel plates at 1.5 CD and
2.0 CD standoffs.
As shown in the sectional views of steel plates, the explosion damage traces within craters are obvious and the crater profiles are very irregular under the penetration and deflagration coupling effects of reactive jet.In addition,when the standoffs are 0.5 CD and 1.0 CD, the diameter at the upper half of the crater changes uniformly, and the diameter decreases rapidly at about half of the penetration depth. In other words, the profile at the upper half of the crater is trumpet-shaped, and the lower half is almost cylindrical.As such,the whole crater almost looks like a funnel,as shown in Fig. 14(a) and Fig. 14(b). Under standoff of 1.5 CD, the crater diameter changes uniformly from the entrance to the bottom, and the penetration channel is long and thin, as shown in Fig.14(c).It can be seen from Fig.14(d)that a shallow crater into the steel plate was formed by reactive jet at 2.0 CD standoff.

Fig.14. Sectional views of penetrated steel plates under different standoffs: (a) 0.5 CD; (b) 1.0 CD; (c) 1.5 CD; (d) 2.0 CD.

Fig.15. Numerical model (1/2) of RLSC against steel plate.
5. Discussion and analysis
5.1. Input parameters of reactive jets
To analyze the crater profile generated by the reactive jet penetration into steel plate, this section investigates the input parameters of reactive jets under different standoffs.The formation of reactive jet was simulated using the AUTODYN-2D finite-difference Eulerian code,and the simulation method was verified in Section 2.
Moreover, a numerical model of RLSC against steel plate (see Fig. 15) is established to analyze the mass of the reactive jet entering the crater at the termination of the penetration process.
The explosive, case, and reactive liner are meshed by Eulerian algorithm while the steel plate is meshed by Lagrangian algorithm.The mesh size is 0.25 × 0.25 mm2for the Euler domain of 50×400 mm2.The mesh size of steel plate was 0.5×0.5 mm2for the Lagrange algorithm of 60×100 mm2.The boundary condition of air(Euler)domain is set as“Flow out(ALL EQUAL)”to eliminate the influence of the boundary effect.
The material of steel plate is #45 steel, which is chosen as the shock equation of state incorporating the Johnson—Cook strength model, and the erosion is selected the geometric strain 1.5 [11,12].The material of case is Aluminum,and it is also chosen as the shock equation of state [12]. The material parameters of the steel plate and case are shown in Table 6 and Table 7,respectively.The material parameters of reactive liner, explosive, and air are the same as Table 2-Table 4 in Section 2.1.

Table 6Material parameters of the steel plate.

Table 7Material parameters of the case.
When the reactive jets reach the surface of steel plates under different standoffs,the performance parameters of reactive jets are listed in Table 8, in whichvj,Lj,rj,rt,ρj,0, and ρj,tare the jet tip velocity, the effective jet length, the jet tip radius, the jet tail radius,the jet tip density, and the jet tail density at timet0, respectively.

Table 8Performance parameters of reactive jets before impacting steel plates.
5.2. Comparative analysis
The simulated jet parameters in Table 8 are substituted into the penetration and crater models in Section 3 to obtain the model predictions. The crater profiles of experimental results compared with that of analytical models for different standoffs are shown in Fig.16.It should be noted that experimental crater profiles in Fig.16 were plotted by first measuring the crater radius on the right side of the crater and then symmetry. The explicit values of penetration depths and crater diameters of experiments and analytical models are listed in Table 9.

Table 9Penetration depths and crater diameters of experiments and analytical models.
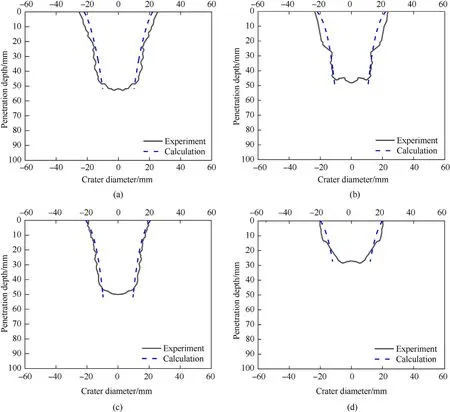
Fig.16. Comparison between experimental and analytical crater profiles under different standoffs: (a) 0.5 CD; (b) 1.0 CD; (c) 1.5 CD; (d) 2.0 CD.
As shown in Fig.16, there is a convergence between analytical crater profiles and experimental results of reactive jets impacting steel plates under different standoffs. Especially as the standoff increases to 1.5 CD and 2.0 CD, the error between the analytical profile and the experiment result is smaller.The main reason is that although the influence of deflagration reaction of reactive jet elements on the crater diameters is taken in analytical model, the effect of deflagration reaction of residual penetrator inside the crater on the secondary expansion cratering effect is neglected. In fact,when the penetration time reaches the initiation delay time of reactive jet, the implosion effect formed by the dramatic deflagration of the residual penetrator will cause not only the secondary expansion of the crater but also fragmentation damage to the penetrated target. The phenomenon has a significant dependence with the effective mass of reactive jet entering the crater [11].
When simulated penetration depths of reactive jets are similar to that of experiments, residual penetrators entering craters are shown in Fig.17.When the standoffs are 0.5 CD and 1.0 CD,the mass of reactive jets inside the craters is larger. The violent deflagration of this part of reactive materials will cause the fragmentation of penetrated steel plates or form cracks throughout the upper surface of the target. As such, the secondary expansion cratering effect is more obvious, resulting in a larger deviation between analytical and experimental results. Furthermore, comparing with the mass of reactive materials inside the bottom half of the crater, the slug has a larger mass. In addition the upper part of penetrated steelplates is less constrained. These are reasons why the diameters in the entrance area are much larger than those in the bottom half of the crater at 0.5 CD and 1.0 CD standoffs. Nevertheless, when the standoffs are 1.5 CD and 2.0 CD, the re-expansion cratering effect weakens with the decrease of the reactive materials mass inside the crater. This behavior makes the analytical crater profiles go well with experimental results.
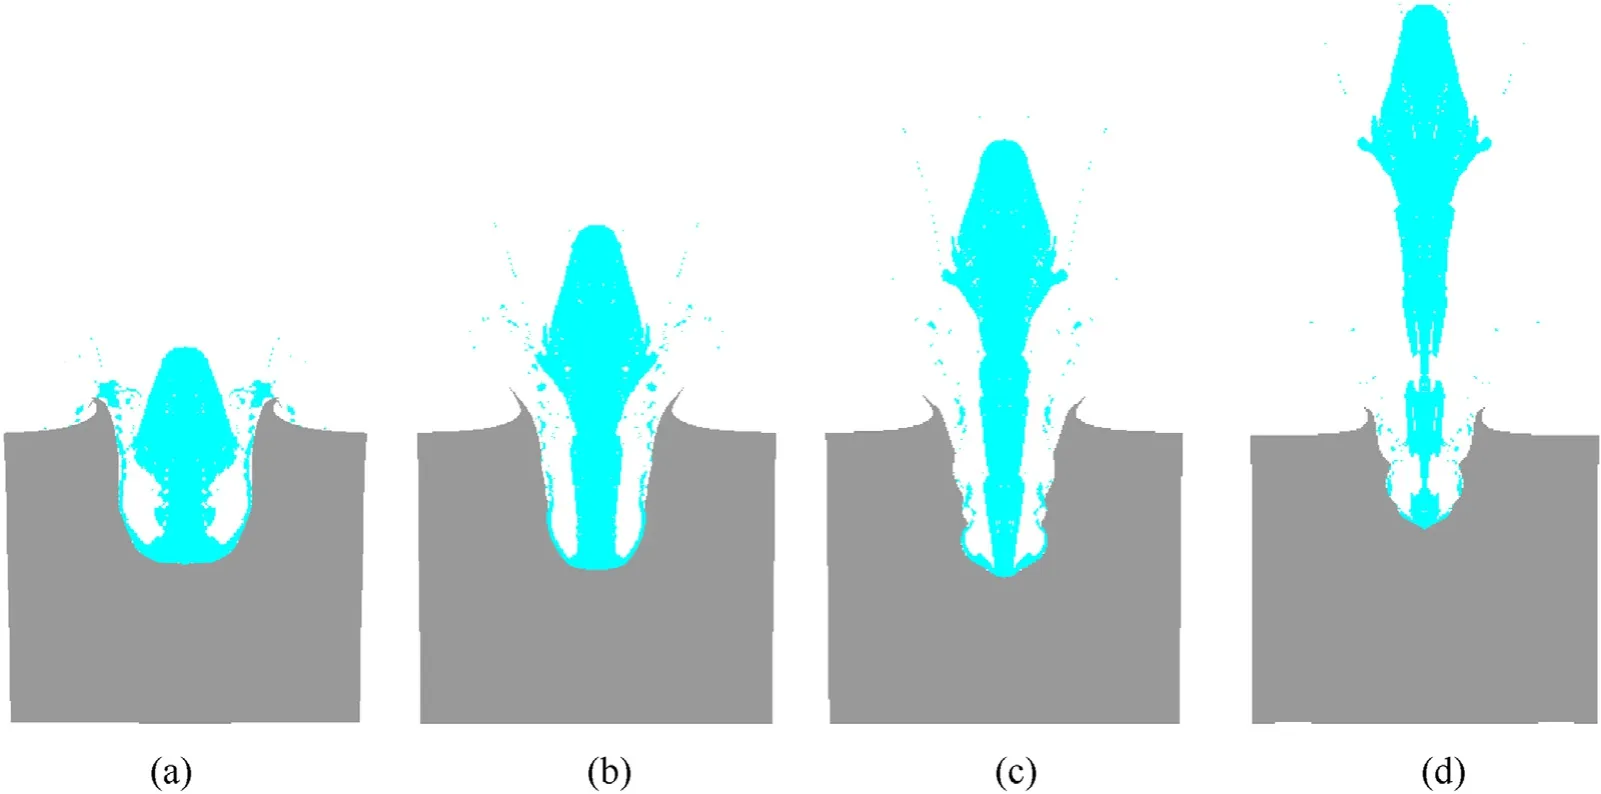
Fig.17. The mass of residual reactive penetrators entering craters under different standoffs: (a) 0.5 CD; (b) 1.0 CD; (c) 1.5 CD; (d) 2.0 CD.
6. Conclusions
The formation behavior of reactive jet is studied by numerical simulation and X-ray experiment combined, based on which analytical models for penetration depth and radial cratering of reactive jet were proposed. Several conclusions are presented as follows:
(a) Numerical simulations and X-ray experiments of reactive jet
formation show that the density in jet section is significantly lower than that of reactive liner materials. Att= 22 μs, the density of the reactive jet tip is about 1.5 g/cm3.The density increases gradually from the jet tip to tail, and the density gradient in the jet section is approximately linear distribution.
(b) The jet formation process is simulated using the AUTODYN-2D finite-difference Eulerian code to obtain the parameters of reactive jets.When the mesh size of Euler domain is set to be 0.25×0.25 mm2,the simulation results of the reactive jet show a good consistency with the X-ray photos.
(c) Analytical models for reactive jet penetration depth and radical cratering are established based on the linear distribution of reactive jet density and the deflagration pressure of each jet element.There is a convergence between analytical crater profiles and experimental results.The maximum error of penetration depth between analytical models and experiments is 6.8%.The crater diameters of analytical models are lower than the experimentally measured values, and the error is between 3.0% and 10.8%.
(d) For mechanism consideration,the radial cratering of reactive jet is mainly consisted of four parts:the initial crater formed by the reactive jet overcoming the target resistance, the formed crater expanded by the inertial flowing of target particles, the crater growth produced by the chemical reaction of each jet elements, and the re-expansion cratering caused by the violent deflagration of residual reactive penetrator inside the crater.
Declaration of competing interest
The authors declare that they have no known competing financial interests or personal relationships that could have appeared to influence the work reported in this paper.
Acknowledgments
The research was supported by the National Natural Science Foundation of China (No. 12002046) and the China Postdoctoral Science Foundation (No. 2020M680392).
杂志排行
Defence Technology的其它文章
- A review on lightweight materials for defence applications: Present and future developments
- Study on the prediction and inverse prediction of detonation properties based on deep learning
- Research of detonation products of RDX/Al from the perspective of composition
- Anti-sintering behavior and combustion process of aluminum nano particles coated with PTFE: A molecular dynamics study
- Microstructural image based convolutional neural networks for efficient prediction of full-field stress maps in short fiber polymer composites
- Modeling the blast load induced by a close-in explosion considering cylindrical charge parameters
