Risk factor analysis and clinical decision tree model construction for diabetic retinopathy in Western China
2022-11-24YuanYuanZhouTaiChengZhouNanChenGuoZhongZhouHongJianZhouXingDongLiJinRuiWangChaoFangBaiRongLongYuXinXiongYingYang
Yuan-Yuan Zhou,Tai-Cheng Zhou,Nan Chen,Guo-Zhong Zhou,Hong-Jian Zhou,Xing-Dong Li,Jin-Rui Wang,Chao-Fang Bai,Rong Long,Yu-Xin Xiong,Ying Yang
Yuan-Yuan Zhou,Hong-Jian Zhou,Xing-Dong Li,Department of Endocrinology and Metabolism,The Sixth Affiliated Hospital of Kunming Medical University,The People’s Hospital of Yuxi City,Yuxi 653100,Yunnan Province,China
Tai-Cheng Zhou,Jin-Rui Wang,Chao-Fang Bai,Rong Long,Yu-Xin Xiong,Ying Yang,Department of Endocrinology and Metabolism,Affiliated Hospital of Yunnan University,The Second People’s Hospital of Yunnan Province,Kunming 650021,Yunnan Province,China
Nan Chen,Guo-Zhong Zhou,Department of Endocrinology and Metabolism,The Frist People’s Hospital of Anning City,Anning City 650300,Yunnan Province,China
Abstract BACKGROUND Diabetic retinopathy (DR) is the driving force of blindness in patients with type 2 diabetes mellitus (T2DM).DR has a high prevalence and lacks effective therapeutic strategies,underscoring the need for early prevention and treatment.Yunnan province,located in the southwest plateau of China,has a high prevalence of DR and an underdeveloped economy.AIM To build a clinical prediction model that will enable early prevention and treatment of DR.METHODS In this cross-sectional study,1654 Han population with T2DM were divided into groups without (n=826) and with DR (n=828) based on fundus photography.The DR group was further subdivided into non-proliferative DR (n=403) and proliferative DR (n=425) groups.A univariate analysis and logistic regression analysis were conducted and a clinical decision tree model was constructed.RESULTS Diabetes duration ≥ 10 years,female sex,standing-or supine systolic blood pressure (SBP) ≥ 140 mmHg,and cholesterol ≥ 6.22 mmol/L were risk factors for DR in logistic regression analysis (odds ratio=2.118,1.520,1.417,1.881,and 1.591,respectively).A greater severity of chronic kidney disease (CKD) or hemoglobin A 1c increased the risk of DR in patients with T2DM.In the decision tree model,diabetes duration was the primary risk factor affecting the occurrence of DR in patients with T2DM,followed by CKD stage,supine SBP,standing SBP,and body mass index (BMI).DR classification outcomes were obtained by evaluating standing SBP or BMI according to the CKD stage for diabetes duration < 10 years and by evaluating CKD stage according to the supine SBP for diabetes duration ≥ 10 years.CONCLUSION Based on the simple and intuitive decision tree model constructed in this study,DR classification outcomes were easily obtained by evaluating diabetes duration,CKD stage,supine or standing SBP,and BMI.
Key Words: Diabetic retinopathy;Type 2 diabetes;Western China;Decision tree
INTRODUCTION
Type 2 diabetes mellitus (T2DM),a common chronic disease,poses a severe threat to human health and quality of life.By 2045,an estimated 552 million people worldwide will suffer from T2DM[1].Given the socio-economic developments over the past 40 years,China has become increasingly urbanized,with a growing aging population.Moreover,obesity and overweight caused by lifestyle changes contribute to the growing burden of T2DM in China[2].As a major vascular complication of T2DM,diabetic retinopathy (DR) is currently largely responsible for blindness in the working-class[3,4].
The two major challenges associated with DR include the high disease prevalence and lack of effective treatments.The global prevalence of DR is 34.6%.As of 2011,126.6 million people suffered from DR,and this number is estimated to reach 191.0 million in 2030 without effective and timely measures[5].The concerning prevalence and severity of DR worldwide may be modulated by racial/ethnic disparities,socio-economic status,health care systems,lifestyles,research methods,and other factors[6].Regarding Asian populations,the prevalence of DR varies according to the region.For example,the prevalence of DR is 20.1%[7],25.7%[8],and 35.0%[9] in Chinese Singaporeans,Chinese Americans,and Taiwanese Chinese,respectively.Further,the prevalence of DR in inland areas of China is 23%.It is also higher in rural areas than in urban areas and in northern areas than in southern and eastern coastal areas[10-12].
Nevertheless,there is currently a paucity of effective treatments for DR.In addition to systematic interventions for controlling blood glucose levels,blood pressure,and blood lipid levels,several modern therapies have been developed,such as laser photocoagulation[13] and intravitreal injections of anti-vascular endothelial growth factor (VEGF) antibodies or glucocorticoids,which can delay the progress of proliferative DR (PDR)[14,15].However,several side effects associated with these therapies should be noted.For instance,photocoagulation may cause potential retinal damage,anti-VEGF injections are associated with relapse after drug withdrawal,and glucocorticoid use contributes to cataracts and elevated intraocular pressure in a considerable number of patients.Moreover,intraocular injections may cause complications such as endophthalmitis,intraocular hemorrhage,vitreous hemorrhage,and even retinal detachment[14,15].Therefore,the utilization of these therapeutic options in clinical practice should be based on systematic evaluation and strict indications.
The high prevalence of DR and lack of efficient therapeutic strategies are associated with reduced quality of life of patients and pose a substantial socio-economic burden on individuals,families,and the society[16].According to an analysis of the pedigree of T2DM in Yunnan province,the prevalence of DR[17] approximates the national average[10].Therefore,the active search for associated risk factors is a fundamental priority for the prevention of DR.In this regard,a decision tree model established using identified risk factors is a useful tool.Distinct from traditional statistical methods such as logistic regression analysis,decision trees are effective machine-learning algorithms that solve classification problems.This method obtains a set of effective classification rules through systematic learning of multiple attributes of samples with known classification results.When faced with new unknown samples,the choice of classification or characteristic attributes can be quickly obtained based on the set of rules extracted from the established decision tree[18-20].Thus,a decision tree is a prediction model with a simple and intuitive flowchart structure that is particularly suitable for use in clinical practice.This study examined the risk factors associated with DR in the Han population with T2DM in Yunnan province and constructed a clinical decision tree model.
MATERIALS AND METHODS
Study subjects
Patients from the Han population with T2DM were enrolled from the Department of Endocrinology,Affiliated Hospital of Yunnan University.All patients fulfilled the Chinese Diabetes Association criteria for the diagnosis of T2DM[21].The criteria for exclusion were as follows: (1) Age < 18 years;(2) positive islet autoantibodies [including islet cell autoantibodies and autoantibodies to glutamic acid decarboxylase-65,insulin,the tyrosine phosphatases islet antigen 2 (IA-2) and IA-2β,and zinc transporter 8];(3) acute complications of diabetes mellitus (including diabetic ketoacidosis or diabetic hyperosmolar state);(4) severe hepatic damage;(5) malignant tumors;(6) acute or chronic infectious diseases;(7) other eye diseases (including glaucoma,retinal vascular occlusion,and ischemic optic neuropathy);and (8) pregnancy.Finally,1654 patients with T2DM were enrolled.
Ethical principles
This study was approved by the Ethics Committee of Affiliated Hospital of Yunnan University (No.2021062),and written informed consent was obtained from all participants according to the principles of the Helsinki Declaration.
This trial registration was registered at ChiCTR (ChiCTR2100 041888;registration on January 9,2021,http://www.chictr.org.cn/index.aspx).
Clinical information collection
Patient sex,age,diabetes duration,height,weight,waist circumference,hip circumference,waist-hip ratio (WHR),body mass index (BMI),and systolic blood pressure (SBP) and diastolic blood pressure (DBP) (both in the standing and supine positions) were recorded.
Laboratory assessments
All patients fasted at 22:00 the day before blood collection.At 8:00 the next day,6 mL of venous blood was collected.Fasting blood glucose (Glu0),hemoglobin A 1c (HbA1c),serum creatinine (Scr),blood urea nitrogen (BUN),uric acid (UA),triglycerides (Trig),cholesterol (Chol),high-density lipoprotein Chol (HDL-C),and low-density lipoprotein Chol (LDL-C) were measured.Based on the formula eGFR (mL/min/1.73 m2)=175 × Scr (mg/dL) -1.234 × age -0.179 × (0.790 for women)[22],the estimated glomerular filtration rate (eGFR) was calculated.
Ophthalmological measurements
All patients underwent non-mydriatic fundus photography and were evaluated according to the international clinical grading standards for DR established by the American Academy of Ophthalmology[23].
Definitions
According to the DR Preferred Practice Pattern[23].DR was clinically classified into two types-non-PDR (NPDR) and PDR;the latter was identified by neovascularization and preretinal or vitreous hemorrhage.To further study the effect of blood pressure-related indicators (SBP and DBP in both the standing and supine positions),obesity-related indicators (BMI and waist circumference),blood glucose-related indicators (Glu0 and HbA1c),blood lipid-related indicators (Chol,Trig,LDL-C,and HDL-C),and renal function related indicators (UA and eGFR) on DR,these indicators were defined according to relevant guidelines or expert consensus.Abnormal blood pressure was defined as SBP ≥ 140 mmHg and/or DBP ≥ 90 mmHg[24].Overweight was defined as BMI ≥ 24 kg/m2,obesity was defined as BMI ≥ 28 kg/m2,and abdominal obesity was defined as waist circumference ≥ 90 cm in men or ≥ 85 cm in women[25].Well-controlled blood glucose level was defined as Glu0 ≤ 7.0 mmol/L or HbA1c < 7%,generally controlled blood glucose level was defined as 7% ≤ HbA1c < 8%,and poorly controlled blood glucose level was defined as Glu0 > 7.0 mmol/L or HbA1c ≥ 8%[21].Dyslipidemia was defined as Chol ≥ 6.22 mmol/L,Trig ≥ 2.26 mmol/L,or LDL-C ≥ 4.14 mmol/L and/or HDL-C < 1.04 mmol/L[26].Hyperuricemia was defined as fasting serum UA > 420 μmol/L[27].Stages of chronic kidney disease (CKD) were determined by eGFR as follows: CKD stage 1 (G1),eGFR ≥ 90 mL/min;CKD stage 2 (G2),eGFR=60-89 mL/min;CKD stage 3 (G3),eGFR=30-59 mL/min;CKD stage 4 (G4),eGFR=15-29 mL/minl and CKD stage 5 (G5),eGFR < 15 mL/min [22].
Statistical analysis
Based on fundus photography,participants were divided into groups without DR (WDR group,n=826) or with DR (DR group,n=828).The DR group was further classified into the NPDR (n=403) and PDR (n=425) groups according to severity.All statistical analyses were performed using SPSS (SPSS 20.0,IBM,United States).Differences between the WDR and DR groups or the NPDR and PDR groups were assessed (Table 1).For continuous variables,Welch’st-test was used for normal distributions,while the Mann-WhitneyUtest was used for skewed distributions.For categorical variables,the chi-square test was performed.Using DR or PDR as the dependent variable,logistic regression analysis was explored to analyze DR or PDR-related risk factors.Logistic regression analysis was performed using forward selection (likelihood ratio),withP< 0.05 as the entry criterion andP> 0.1 as the removal criterion.The decision tree method was performed using the chi-squared automatic interaction detector,with 70% participants as the training dataset,and the remaining 30% as the test dataset.The variable assignments used in both logistic regression analysis and decision tree model are presented in Table 2.
RESULTS
Baseline clinical characteristics
The baseline clinical characteristics of all participants are presented in Table 1.
Univariate analysis of DR-related risk factors
As shown in Table 1,the proportion of women,diabetes duration,supine SBP,standing SBP,supine DBP,Chol,BUN,UA,Scr,Glu0,and HbA1c were higher in the DR group than in the WDR group (allPvalues < 0.05).In contrast,the DR group had a lower BMI,hip circumference,and eGFR than the WDR group (allPvalues < 0.05).
Univariate analysis of PDR-related risk factors
The proportion of women,supine SBP,supine DBP,Chol,LDL-C,and BUN were significantly higher in the PDR group than in the NPDR group (allPvalues < 0.05).However,age,hip circumference,and eGFR were significantly lower in the PDR group than in the NPDR group (allPvalues < 0.05) (Table 1).

Table 1 Univariate analysis of risk factors for diabetic retinopathy or proliferative diabetic retinopathy
Logistic regression analysis of DR-related risk factors
Women had a 1.520 times higher risk of DR [95% confidence interval (CI): 1.218 to 1.897] compared to men (Figure 1).Patients with diabetes duration ≥ 10 years had a 2.118-fold higher risk of DR than those with diabetes duration < 10 years (95%CI: 1.661 to 2.700).The risk of DR in patients with standing SBP ≥ 140 mmHg was 1.417 times higher than that in patients with standing SBP < 140 mmHg (95%CI: 1.046 to 1.919).Compared to patients with supine SBP < 140 mmHg,those with supine SBP ≥ 140 mmHg had a 1.881-fold higher risk of DR (95%CI: 1.399 to 2.528).Compared to patients with normal Chol,those with Chol ≥ 6.22 mmol/L had a 1.591 times higher risk of DR (95%CI: 1.104 to 2.291).The risk of DR in patients with CKD stages G2,G3,G4,and G5 was 2.206 (95%CI: 1.678 to 2.899),7.860 (95%CI: 4.573 to 13.512),9.693 (95%CI: 3.255 to 28.862),and 20.691 (95%CI: 2.540 to 168.581) times higher than that in patients with CKD stage G1.In other words,a greater severity of CKD was associated with a higher risk of DR.The risk of DR in patients with 7% ≤ HbA1c < 8% or HbA1c ≥ 8% was 1.787 (95%CI: 1.198 to 2.664) and 3.073 (95%CI: 2.225 to 4.245) times higher than that in patients with HbA1c < 7%,indicating that worse control of HbA1c was associated with a higher risk of DR.
Logistic regression analysis of PDR-related risk factors
Compared to men,women had a 2.161-fold higher risk of progression to PDR (95%CI: 1.615 to 2.890) (Figure 2).Compared to patients with diabetes duration < 10 years,patients with diabetes duration ≥ 10 years had a 1.483 times higher risk of PDR (95%CI: 1.099 to 2.001).The risk of progression to PDR in patients with CKD stages G3 and G4 was 2.109 (95%CI: 1.362 to 3.266) and 2.290 (95%CI: 1.016 to 5.165) times higher than that in patients with CKD stage G1.
Decision tree modeling of DR-related risk factors
As shown in Figure 3,the importance of variables in the decision tree model was presented as a root-toleaf structure,with diabetes duration being the first variable or root node,followed by CKD stage,supine SBP,standing SBP,and BMI,in order of importance.As presented in Table 3,seven “if-then” rules summarized the path from the root node to each leaf node.
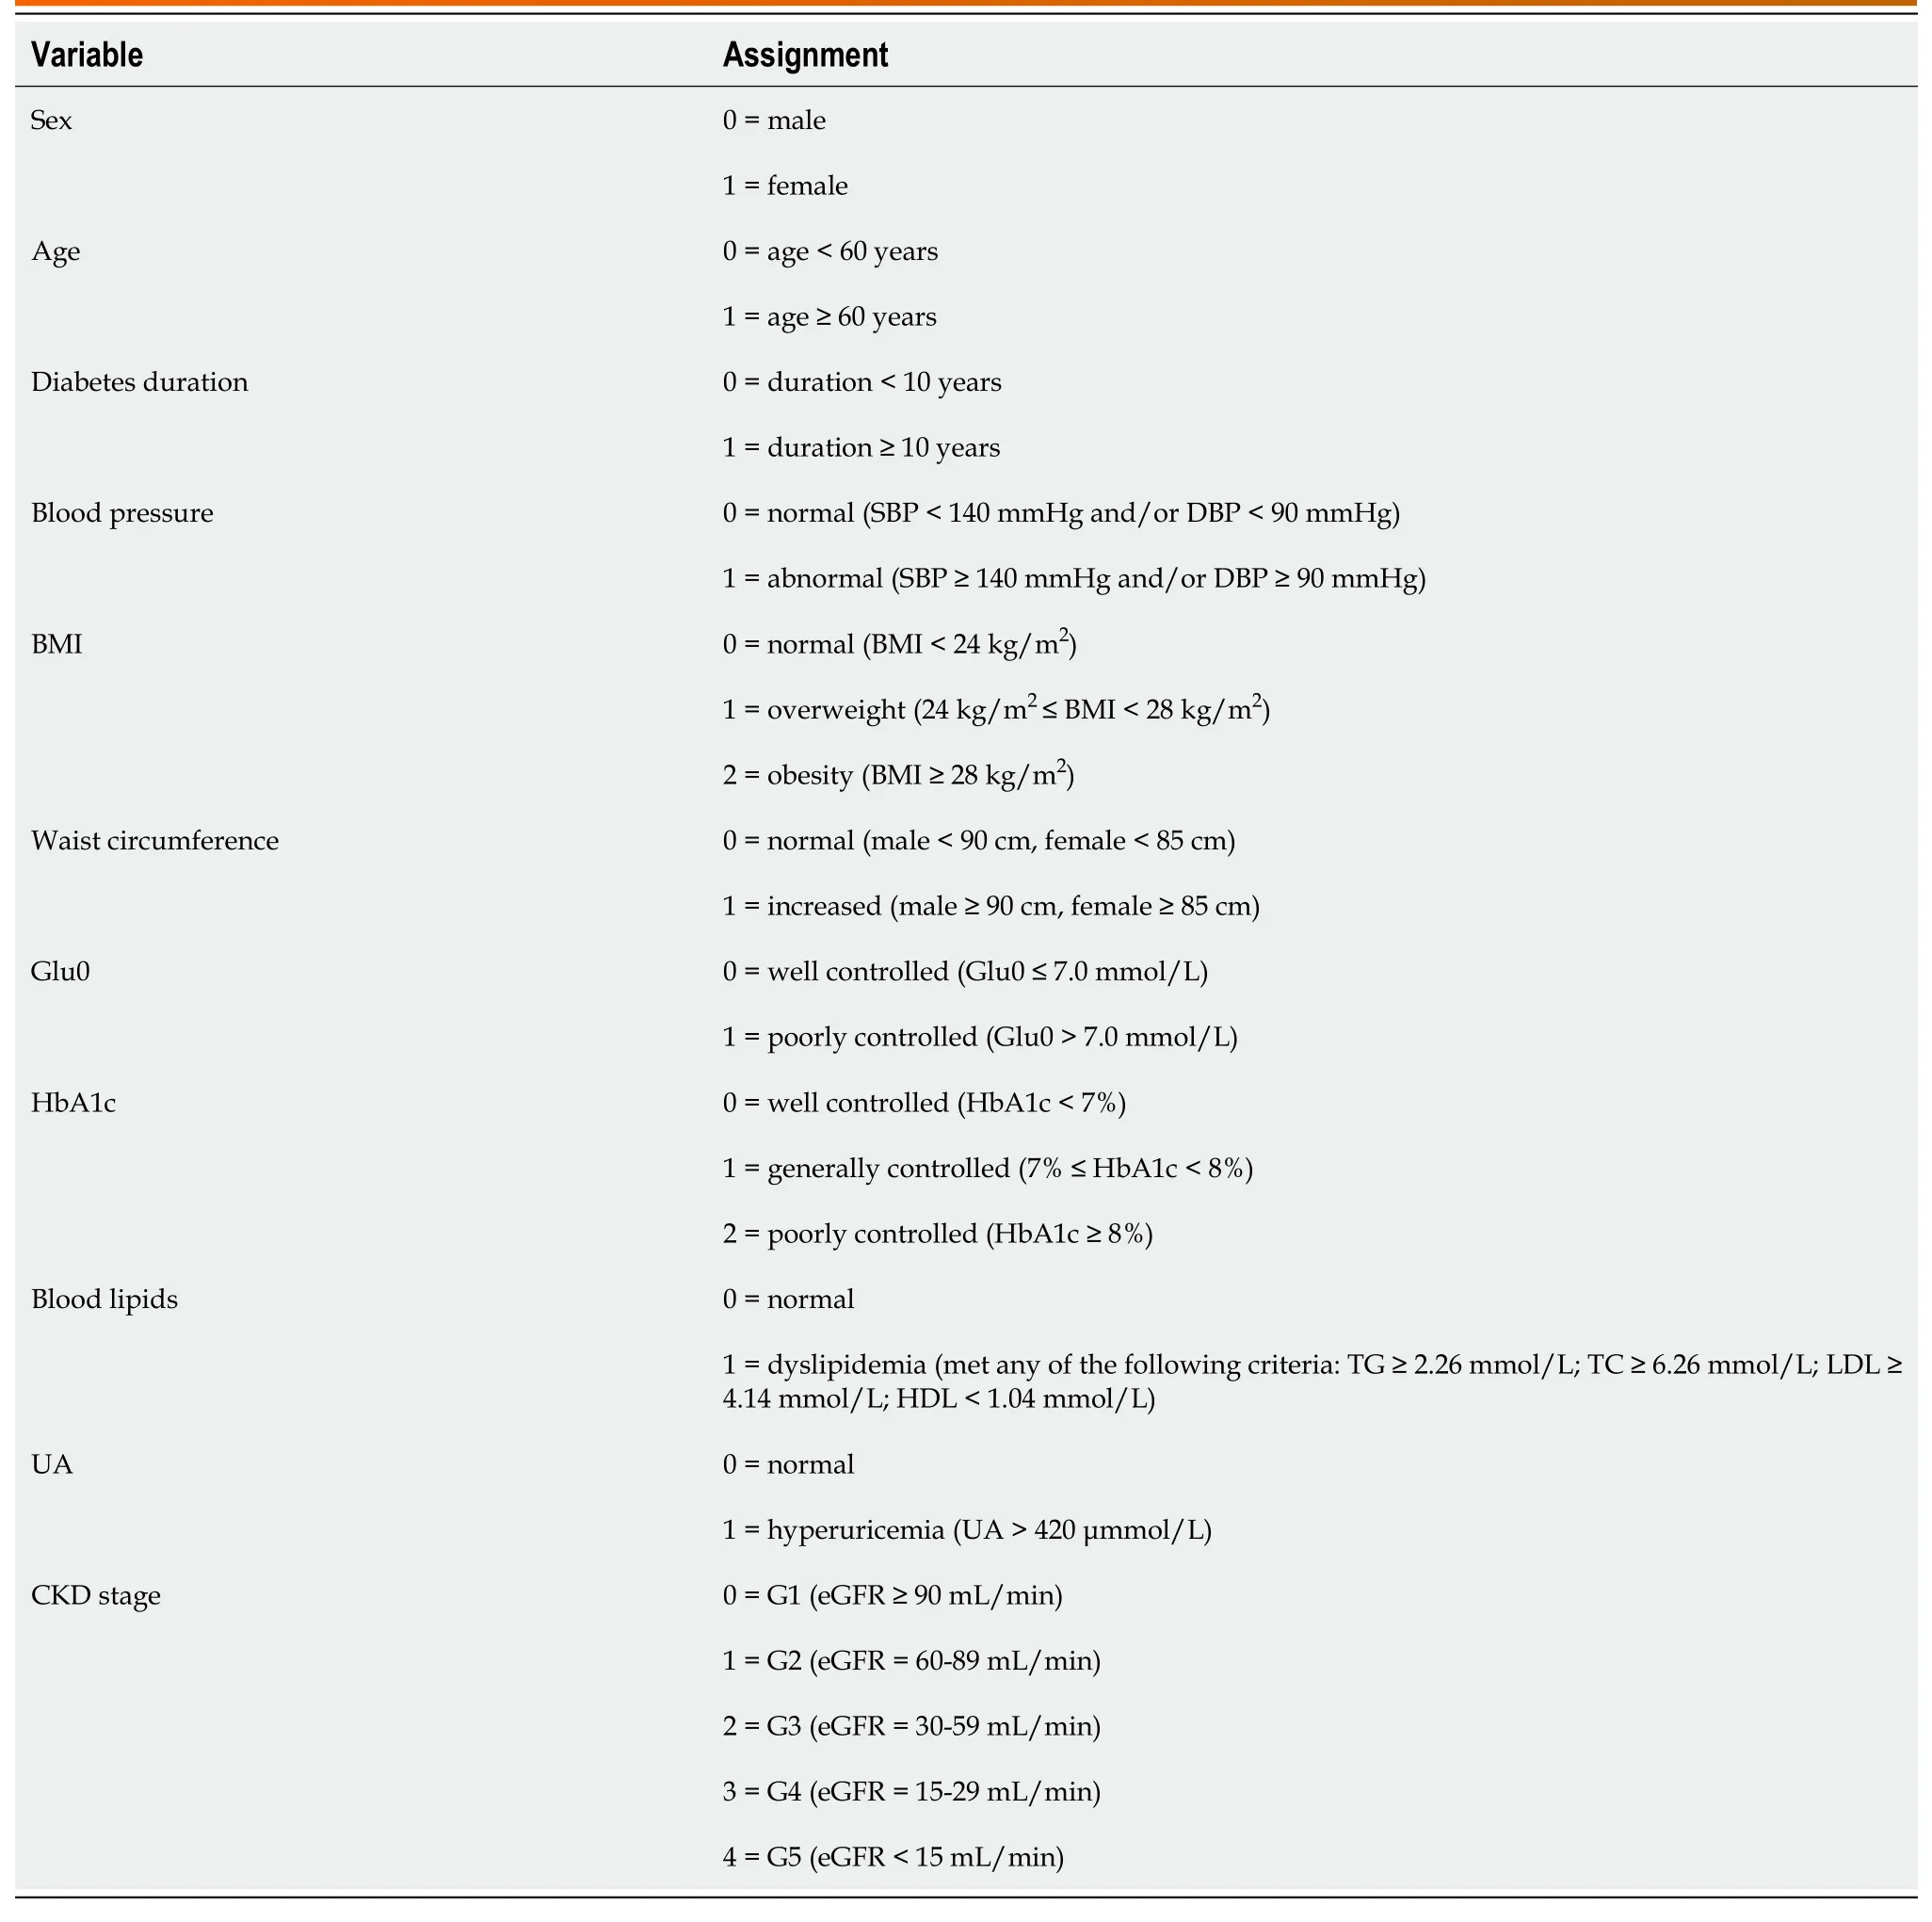
Table 2 Variable assignment
DISCUSSION
In this study,we attempted to reveal the DR-related risk factors in Han population with T2DM in Yunnan province and construct a predictive model for personalized DR risk assessment and early preventive effect.
Studies have reported that various factors modulate the effects of age on DR.Although sporadic cases have been reported,the onset of DR before puberty is extremely rare[28,29].Researchers have suggested that patients with diabetes during adolescence are prone to develop serious vascular complications,including DR,compared to patients with diabetes after adolescence.This could be partly due to the characteristics of adolescent patients;for example,patients at this stage tend to be accompanied by dramatic hormone level fluctuations,and most patients present with type 1 diabetes tend to have relatively poor blood glucose self-management ability[30].Therefore,this study focused on Hanpopulation with T2DM aged ≥ 18 years in Yunnan province to exclude the potential confounding effects of adolescence and type 1 diabetes on the results.
DR has emerged as the leading cause of blindness among 27-75 year olds worldwide[3,21].A Chinese meta-analysis reported that the prevalence of DR in patients with T2DM was age related,increasing from 12.55% in adults aged 30-39 years to 20.44% in adults aged 60-69 years and decreasing to 11.22% in those aged ≥ 80 years[12].Of the 1654 patients enrolled in this study,33.49% and 16.56% patients with DR were < 60 years of age (n=554) and ≥ 60 years of age (n=274),respectively.This suggests that the peak of DR prevalence in Han population with T2DM in Yunnan province is concentrated in the population aged < 60 years,which accounts for the majority of the social labor force.In addition,univariate analysis (Table 1) revealed no significant difference in age between the DR and WDR groups (P=0.056).However,overall age was dramatically lower in the PDR group than in the NPDR group (P< 0.001).As shown in Figures 1 and 2,age was not retained in the logistic regression equation.In conclusion,the correlation between age and DR is complex;this association depends on age stratification and may be affected by the degree of vision.This relationship warrants further exploration in future studies.
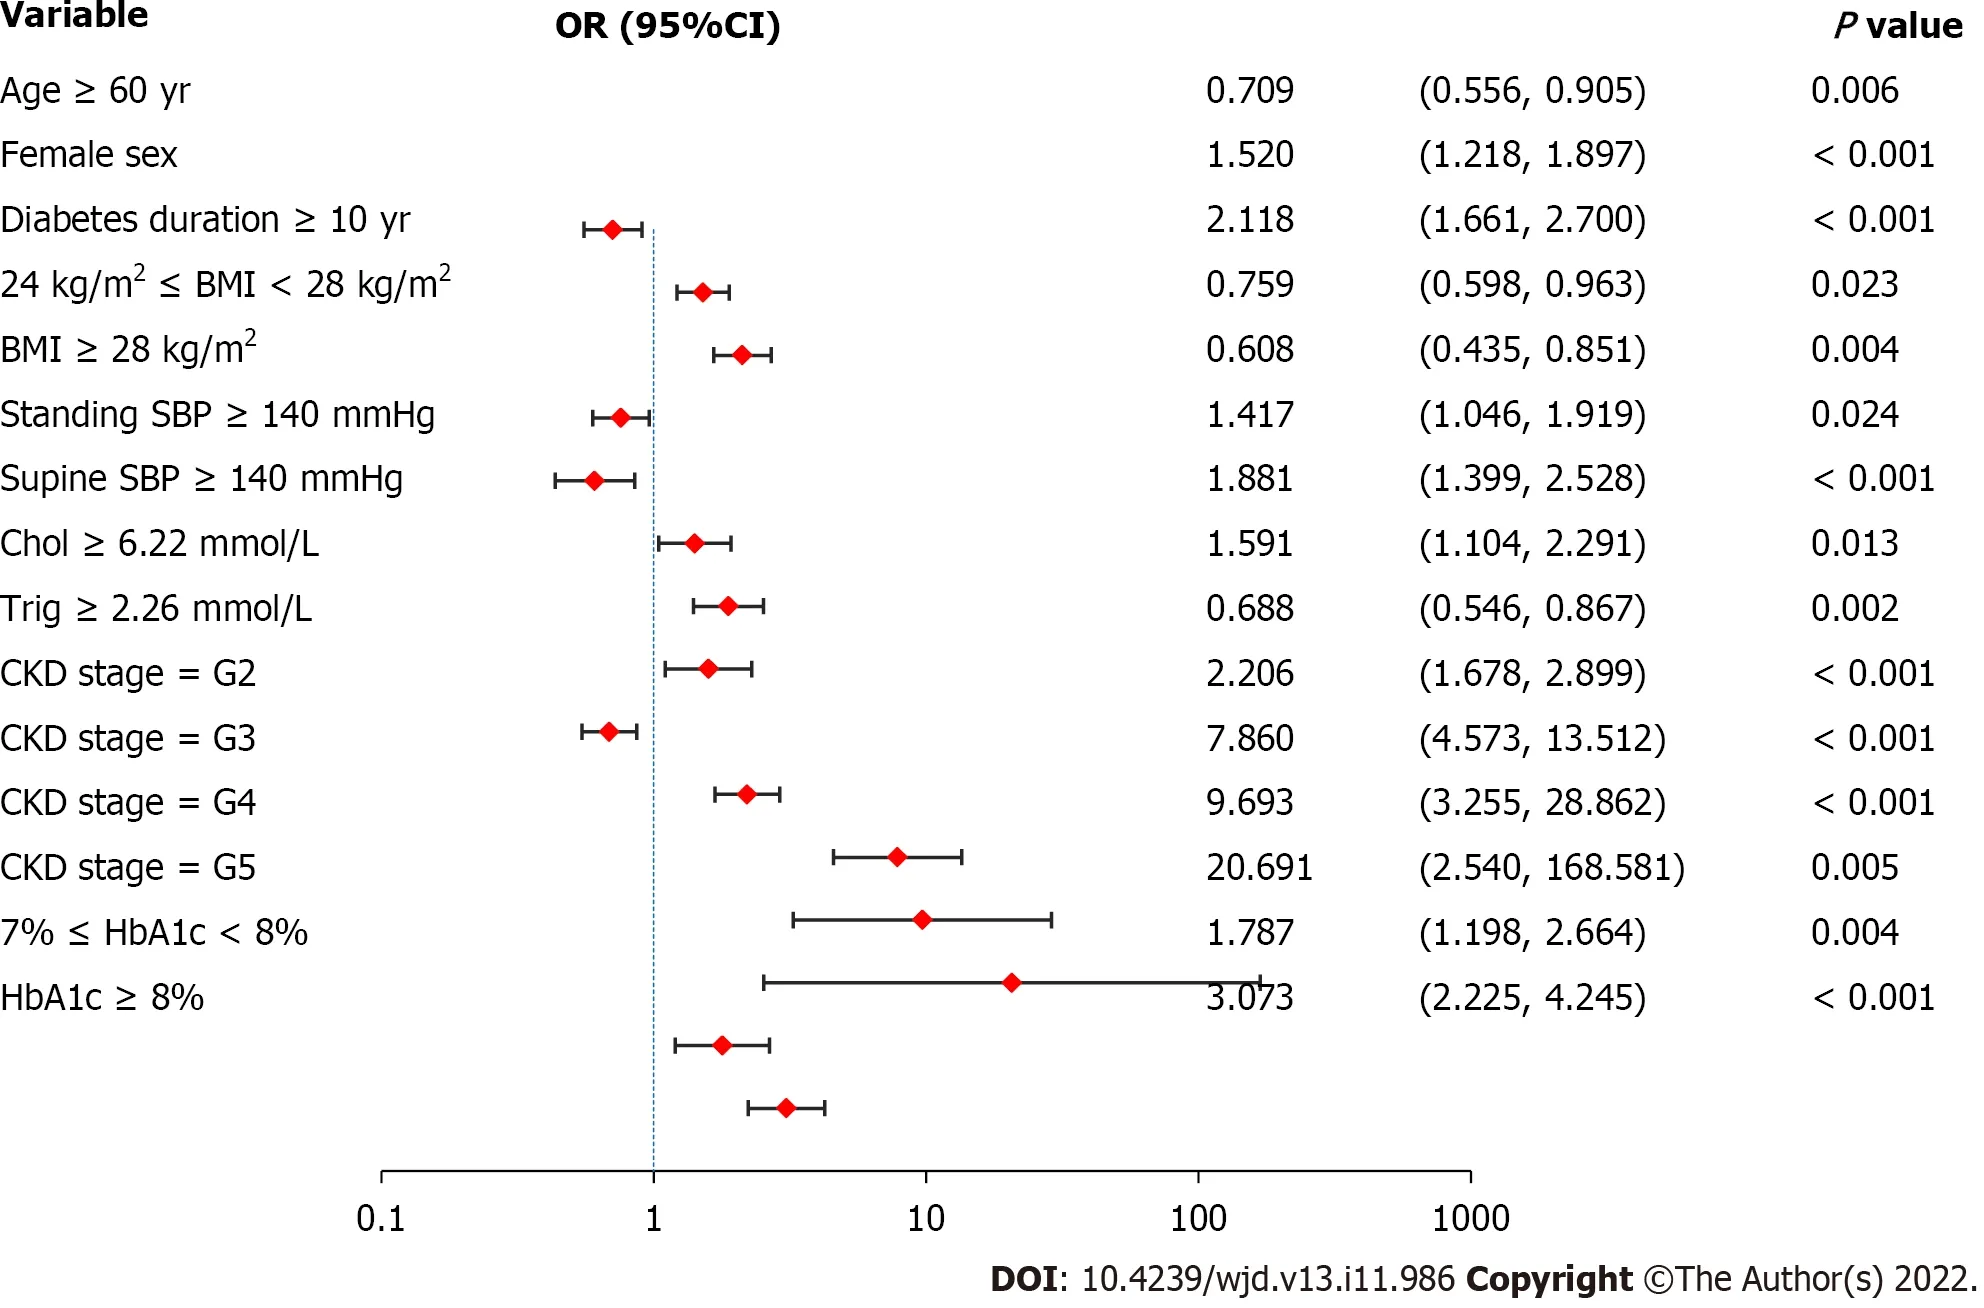
Figure 1 Logistic regression analysis of diabetic retinopathy-related risk factors.Female sex,diabetes duration ≥ 10 years,standing systolic blood pressure (SBP) ≥ 140 mmHg,supine SBP ≥ 140 mmHg,cholesterol ≥ 6.22 mmol/L,greater severity of chronic kidney disease,and worse control of hemoglobin A 1c are associated with a higher risk of diabetic retinopathy.Values are shown using a base 10,logarithmic scale.DR: Diabetic retinopathy;OR: Odds ratio;CI: Confidence interval;BMI: Body mass index;SBP: Systolic blood pressure;Chol: Cholesterol;Trig: Triglyceride;CKD: Chronic kidney disease;HbA1c: Glycated hemoglobin A1c.
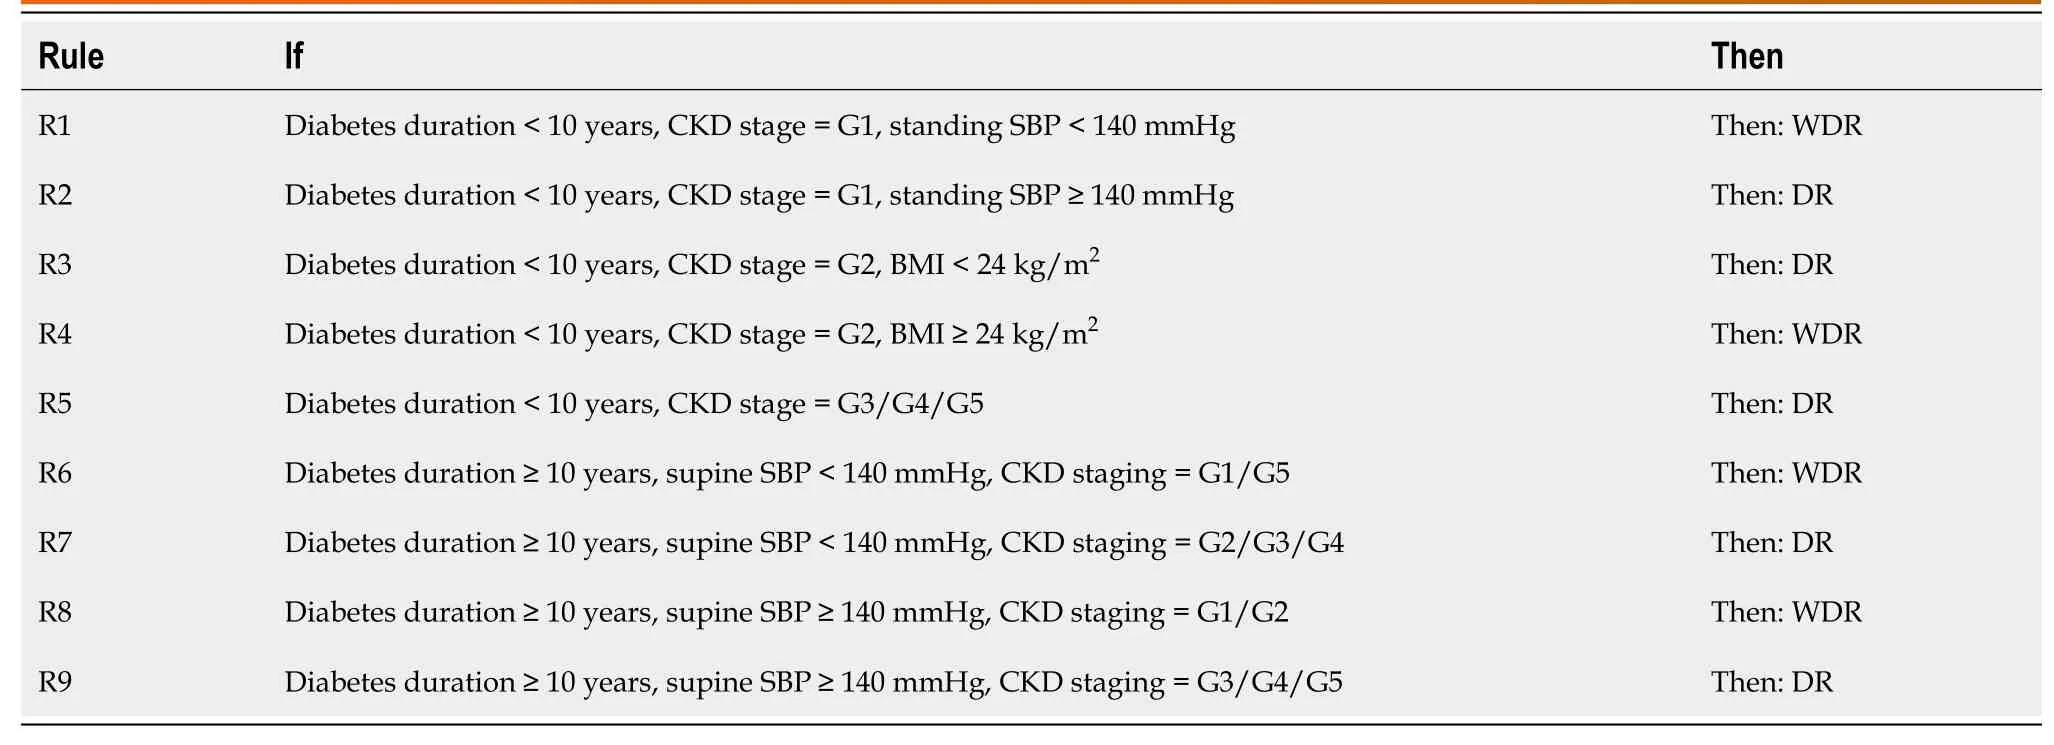
Table 3 “If-then” rules extracted from decision tree
The relationship between sex and DR is unclear.A study from Germany and Australia based on 120000 samples suggested that women are more likely to develop DR than men[31].Similarly,studies in the United Kingdom and Japan have reported that women are more prone to visual impairments than men[32,33].Other studies from the United States and India,however,have reported that the men have a higher risk of DR than women[6,34,35].In particular,the United Kingdom Prospective Diabetes Study (UKPDS) has proposed that DR progression is associated with the male sex[36].Therefore,it is necessary to further explore the correlation between sex and DR.Univariate analysis (Table 1) revealed that the proportion of women was significantly higher in the DR group than in the WDR group (P=0.002).Moreover,the proportion of women was significantly higher in the PDR group than in the NPDR group (P< 0.001).Indeed,further logistic regression analysis (Figures 1 and 2) re-emphasizes the importance of female sex.These findings suggest that female sex not only is a risk factor for the development of DR in patients with T2DM but also contributes to the progression of DR to PDR,at least in Yunnan province.
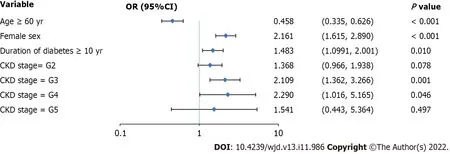
Figure 2 Logistic regression analysis of proliferative diabetic retinopathy-related risk factors.Female sex,diabetes duration ≥ 10 years,and chronic kidney disease stage G3 or G4 are risk factors for the progression to proliferative diabetic retinopathy.Values are shown using a base 10,logarithmic scale.Abbreviations: PDR: Proliferative diabetic retinopathy;NPDR: Non-proliferative diabetic retinopathy;OR: Odds ratio;CI: Confidence interval;CKD: Chronic kidney disease.
It is well-established that the diabetes duration majorly affects the occurrence and progression of DR[23,37].A case-control study in South Korea demonstrated that of 523 patients with T2DM,44.9% developed DR,and 13.6% developed PDR.The average diabetes duration to mild NPDR,moderatesevere NPDR,and PDR was 14.8,16.7,and 17.3 years,respectively[38].Based on the Chinese population,a meta-analysis indicated that the prevalence of DR in patients newly diagnosed with diabetes and patients with a disease course of ≥ 10 years was 9.00% and 55.52%,respectively[12].Univariate analysis (Table 1) revealed that the diabetes duration in the DR group was substantially longer than that in the WDR group (P< 0.001).In contrast,the diabetes duration did not differ significantly between the PDR and NPDR groups (P=0.221).However,logistic regression analysis (Figures 1 and 2) revealed that a diabetes duration ≥ 10 years was an extremely risk for the occurrence and progression of DR.Crucially,the diabetes duration was classified as the root node of the DR decision tree model (Table 3 and Figure 3),emphasizing that the diabetes duration is critical in DR risk assessment.
In addition to the diabetes duration,good glycemic control is considered a key factor for reducing vascular complications of diabetes[39].This study focused on two blood-glucose-related indicators,Glu0 and HbA1c.Compared with the transient characteristics of Glu0,HbA1c reflects the overall level of blood glucose control of patients in the prior 2 to 3 months.In this study,univariate analysis (Table 1) indicated that both Glu0 and HbA1c were substantially greater in the DR group than in the WDR group (allP< 0.05).As shown in Figure 1,HbA1c but not Glu0 was retained in the logistic regression equation.These findings suggest that poor HbA1c control is associated with a higher risk of DR.In conclusion,compared to Glu0,HbA1c,which reflects long-term glucose control levels,is more relevant for the prevention of DR.However,HbA1c did not negatively affect the progression of DR.Of note,large clinical studies such as the UKPDS[40,41] and the Diabetes Control and Complications Study[42] have demonstrated that early and intensive glucose control can reduce the occurrence and progression of diabetic vascular complications,including DR.However,good glycemic control is not equivalent to excessive control.Indeed,extensive evidence indicates that recurrent hypoglycemic episodes caused by excessive strict glycemic control with insulin are associated with the early deterioration of DR,but the underlying mechanisms are unclear[43-45].
Previous studies have demonstrated that hypertension is linked to the development and severity of DR[46,47].Since patients with diabetes are prone to have complications of postural blood pressure changes[48,49],data on standing and supine blood pressure were collected simultaneously.Univariate analysis (Table 1) revealed that standing or supine SBP and supine DBP were significantly lower in the WDR group than in the DR group (allP< 0.001),but there was no obvious difference in standing DBP between the groups (P=0.501).Although supine SBP and supine DBP were lower in the NPDR group than in the PDR group (allP< 0.05),no significant intergroup differences existed in standing SBP and standing DBP (allP> 0.05).Further logistic regression analysis (Figures 1 and 2) indicated that SBP had an effect on DR occurrence but not DR progression.In addition,supine SBP ≥ 140 mmHg was the leaf node of the decision tree model,second only to diabetes duration.Our results emphasize the detrimental effects of elevated SBP (especially supine SBP) on DR,suggesting that good blood pressure control is vital for the prevention of DR.Furthermore,the benefits of certain antihypertensive drugs,particularly angiotensin-converting enzyme inhibitors and angiotensin receptor blockers,are not limited to lowering blood pressure[50,51] and may also benefit DR through neuroprotection[52,53],increasing insulin sensitivity[54],anti-inflammatory effects[55],and inhibiting the blood-eye barrier[56,57].
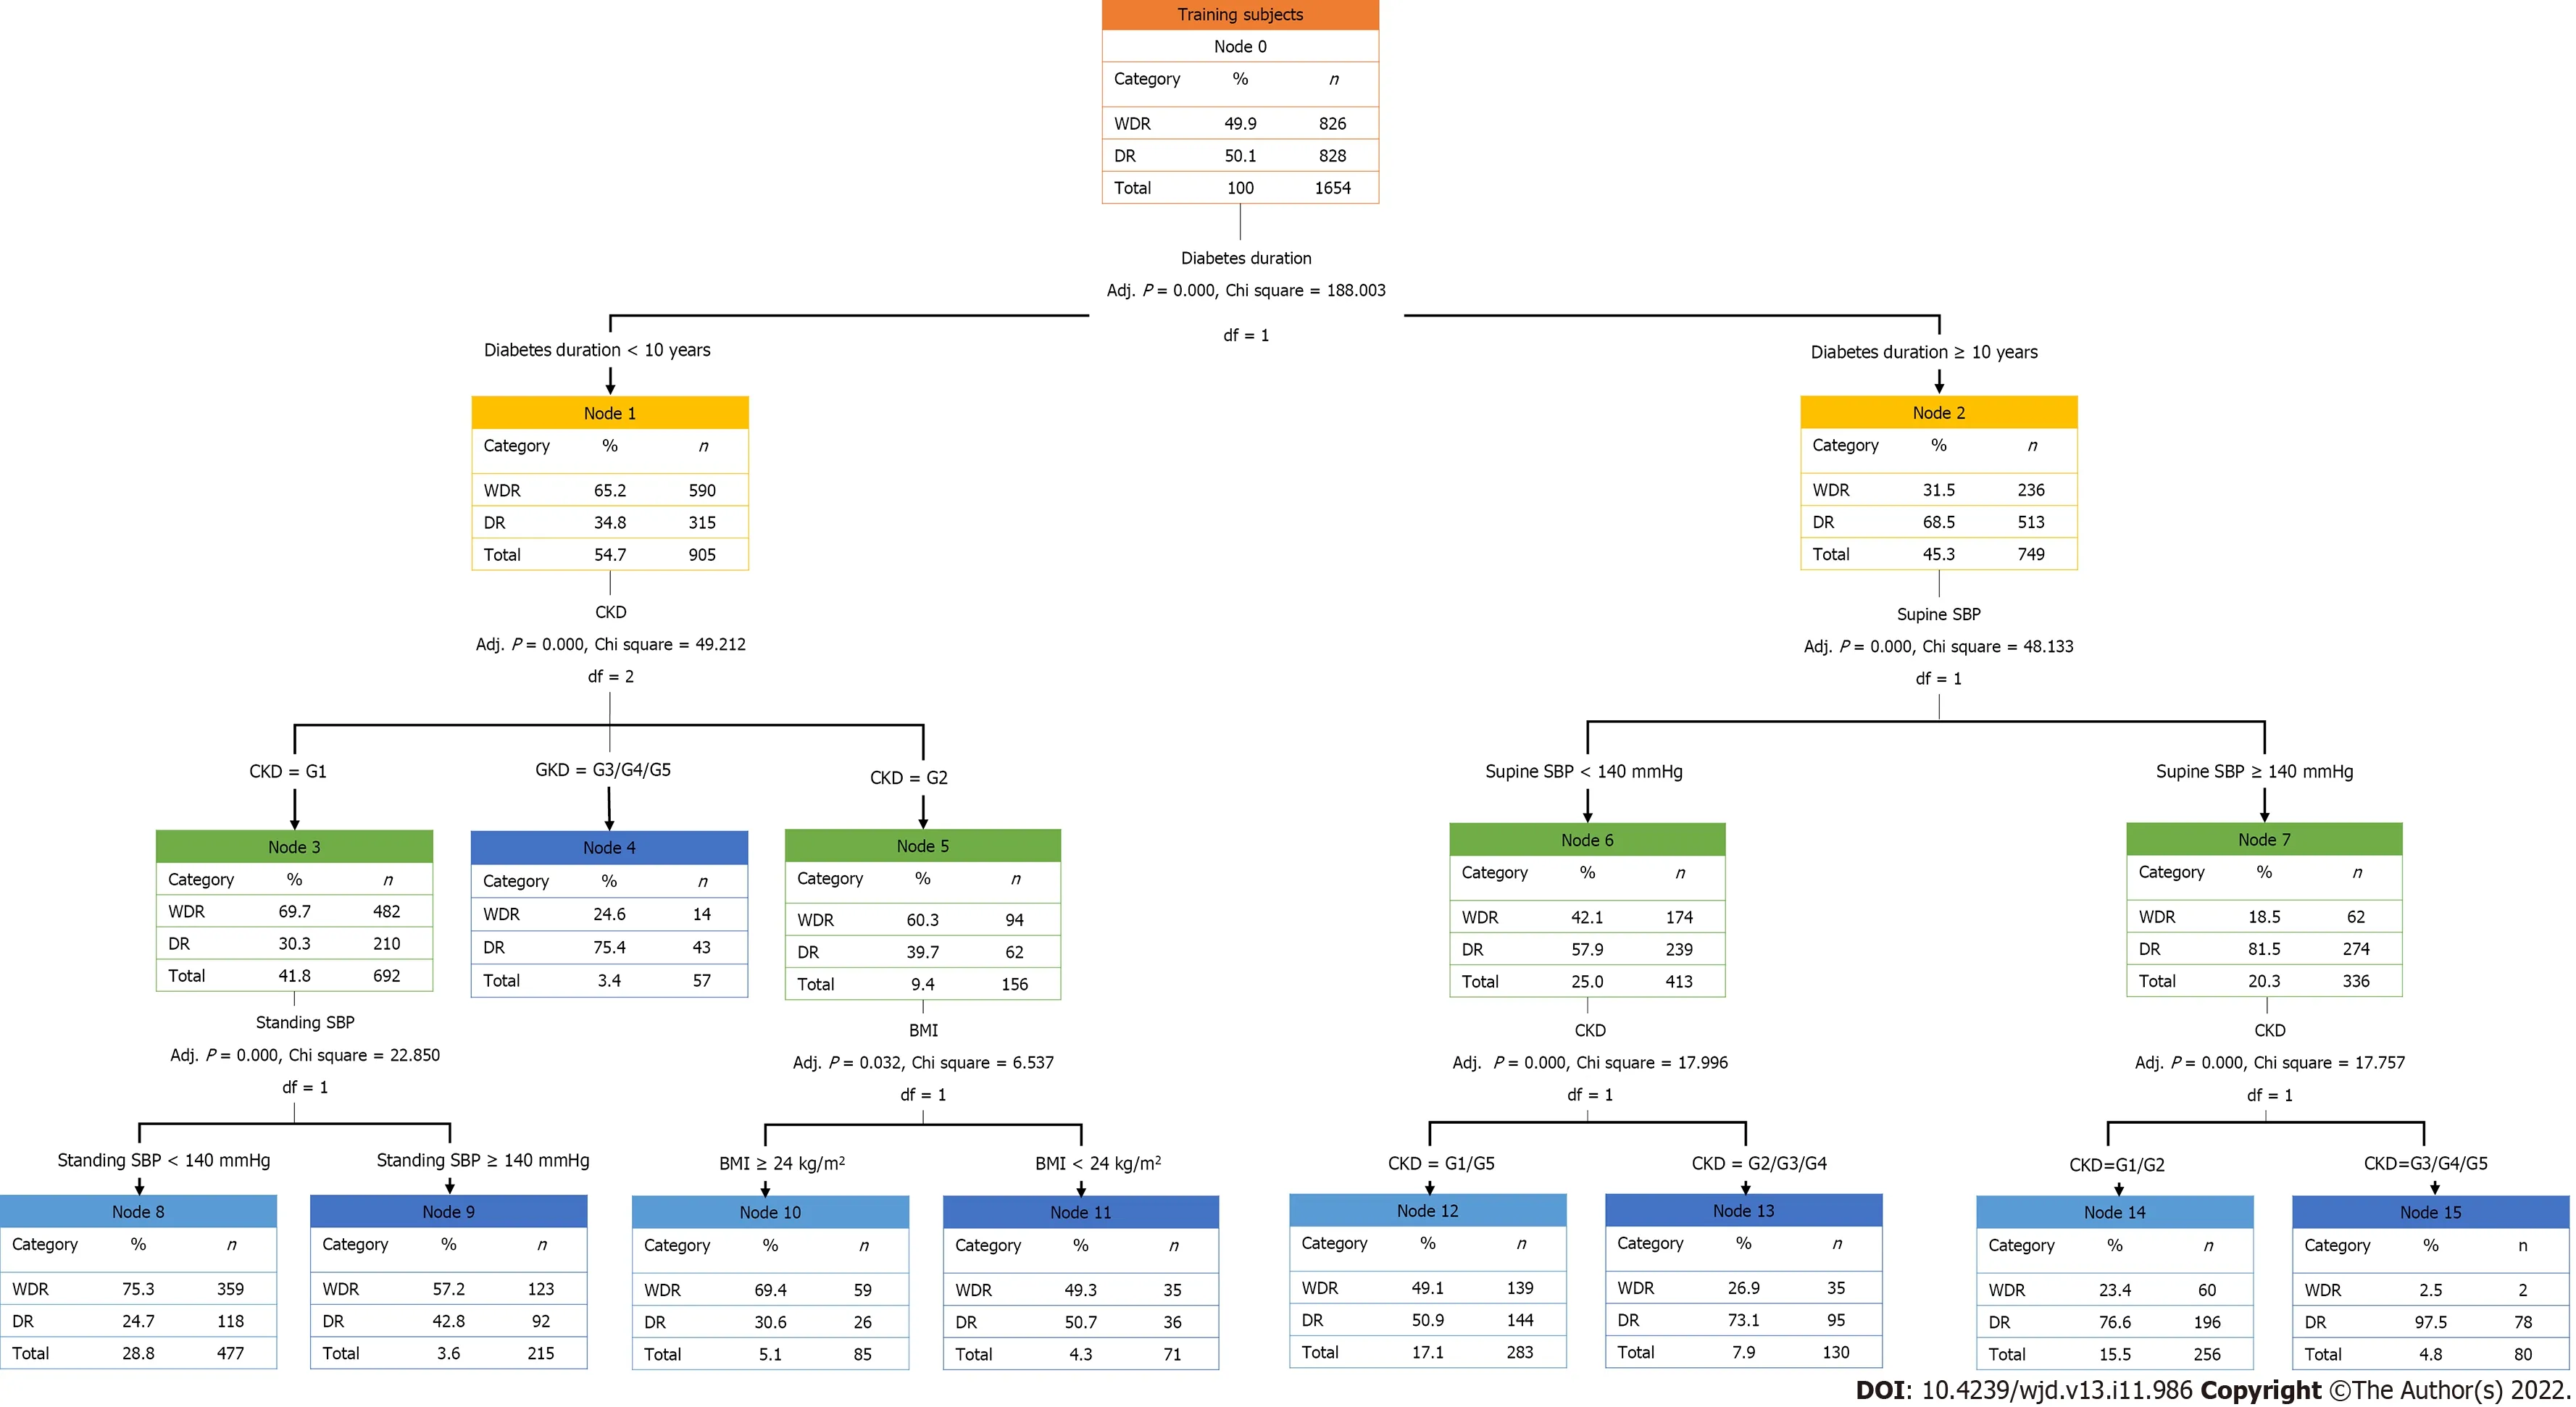
Figure 3 Training dataset of decision tree model for diabetic retinopathy.Based on the decision tree model constructed in this study,the diabetic retinopathy classification outcomes are obtained by evaluating standing systolic blood pressure (SBP) or body mass index according to the chronic kidney disease (CKD) stage for patients with a diabetes duration < 10 years and the evaluation of CKD stage according to the supine SBP for patients with a diabetes duration ≥ 10 years.WDR: Without diabetic retinopathy;DR: Diabetic retinopathy;CKD: Chronic kidney disease;SBP: Systolic blood pressure;BMI: Body mass index.
To date,the complex link between dyslipidemia and DR has remained controversial[10,47,58,59].In this study,the occurrence and development of DR seemed to be more strongly affected by Chol than by Trig,HDL-C,and LDL-C Univariate analysis (Table 1) revealed that Chol was significantly higher in the DR group than in the WDR group (P< 0.001) and significantly higher in the PDR group than in the NPDR group (P=0.013).Moreover,as shown in Figures 1 and 2,Chol increased the risk of developing DR in patients with T2DM,but had no remarkable impact on DR progression.A recent meta-analysis revealed that lipid-lowering drugs exerted a protective effect on the progression of DR[60] but did not affect the deterioration of visual acuity or aggravation of hard exudate.Therefore,further large-scale clinical trials are urgently needed to substantiate the necessity of early application of lipid-lowering drugs in patients with DR.
In parallel with the tremendous rise in the global prevalence of obesity,the prevalence of obesityrelated T2DM has also increased annually[2].However,the relationship between obesity and DR has not been fully elucidated.Reports from Wisconsin illustrated that obesity (defined by BMI) was not independently implicated in the occurrence or progression of DR in patients with T2DM within 10 years[61].Similarly,in the Hoorn study,WHR,but not BMI,was related to the occurrence of DR[62].However,data based on Asian populations have provided the opposite conclusions.For example,based on a sample of 420 Asian patients with T2DM,Manet al[63] reported that BMI was negatively correlated with mild,moderate,and severe DR,but WHR was positively correlated with DR severity.Subsequently,a Korean study demonstrated that higher BMI,increased waist circumference,and higher body fat content (measured by dual-energy X-ray) were notably correlated with a lower risk of DR[64].In this study,data regarding relevant body mass indicators were collected,including those on BMI,waist circumference,hip circumference,and WHR.Univariate analysis (Table 1) revealed that BMI and hip circumference in the DR group were remarkably lower than those in the WDR group (allP< 0.001),but waist circumference was did not differ across the groups (P=0.060).Although the PDR group had a lower hip circumference than the NPDR group (P=0.046),there were no significant intergroup differences in BMI and waist circumference (P> 0.05).In addition,an obvious difference in WHR was not noted among groups (allP> 0.05).Although the logistic regression model ultimately did not retain BMI,waist circumference,hip circumference,and WHR (Figures 1 and 2),the decision tree model (Table 3 and Figure 3) supported the protective effect of higher BMI for the assessment of DR risk.In general,although the relationship between these obesity-relevant indicators and DR is yet to be confirmed,it can be conjectured that excessively low BMI is not conducive to protection against DR in the Asian population.
Among BUN,Scr,and UA,eGFR calculated using Scr is the gold standard for CKD staging[65].In addition,CKD staging is an essential approach to evaluating the severity of diabetic nephropathy in clinical practice.Univariate analysis (Table 1) indicated that eGFR was significantly lower in the DR group than in the WDR group (P< 0.001) and was significantly lower in the PDR group than in the NPDR group (P=0.001).Furthermore,Figures 1 and 2 highlight the importance of CKD staging in the risk assessment of DR.In this regard,the risk of occurrence and progression of DR increased stepwise with each additional risk level of CKD staging.Notably,in the decision tree model (Table 3 and Figure 3),CKD staging was second only to diabetes duration for DR risk assessment.In particular,CKD staging is a key indicator of diabetic nephropathy,and the current results also suggest that DR is often comorbid with diabetic nephropathy.This highlights the need to simultaneously screen for diabetic nephropathy in patients with DR.
Differing from traditional statistical methods such as logistic regression analysis,decision trees are successfully employed in the field of medicine with its advantages in solving classification problems,that is,qualitatively judging the possibility of each risk factor at a specific level.Decision trees obtain a set of effective classification rules by systematically learning multiple attributes of the samples with known classification results.When faced with new unknown samples,the appropriate classification or characteristic attributes can be quickly obtained based on the set of rules extracted from the established decision tree[18-20].In other words,three basic elements compose the decision tree: root node,internal node,and leaf node.The root node is the main feature attribute in the model,the internal node is the secondary attribute judgment based on the root node,and the leaf node is the final classification outcome of the model.
This study extended traditional statistical analysis by building a DR decision model using machine learning based on the attributes of T2DM samples.In the decision tree model,diabetes duration was demonstrated to primarily affect the occurrence of DR in patients with T2DM,namely,the root node.The extraction rules were interpreted as follows: for patients with diabetes duration < 10 years,if they met the criteria of: (1) CKD stage=G3/G4/G5;(2) CKD stage=G2 and BMI < 24 kg/m2;or (3) CKD stage=G1 and standing SBP ≥ 140 mmHg,then DR was prone to occur.In contrast,for patients with diabetes duration ≥ 10 years,if they met the criteria of: (1) Supine SBP < 140 mmHg and CKD stage=G2/G3/G4;or (2) supine SBP ≥ 140 mmHg and CKD stage=G3/G4/G5,then DR was prone to occur.This model may assist clinicians in Yunnan province (particularly primary medical staff who lack relevant DR detection approaches such as ophthalmoscope) to make more effective clinical predictions of DR risk in patients with T2DM.Our decision tree model is simple and intuitive,highlighting its potential for application in clinical practice.
However,there are several limitations that should be noted.First of all,this study did not record in detail the medication of patients,especially the use of anti-diabetic,lipid-lowering and antihypertensive drugs.Secondly,Yunnan province is located in the western plateau of China,and its climate,cultural and economic conditions are very different from those of plain areas.Therefore,these confounding factors should be included in the future to enhance the integrity and reliability of research conclusions.
CONCLUSION
Female sex,diabetes duration ≥ 10 years,standing or supine SBP ≥ 140 mmHg,Chol ≥ 6.22 mmol/L,deterioration of CKD stage,and HbA1c are key DR-related risk factors in the Han population with T2DM in Yunnan province.The concise and intuitive DR prediction model developed through machine learning in this study could help clinicians quickly predict DR outcomes based on patients' potential risk factors and conduct early individualized interventions.
ARTICLE HIGHLIGHTS
Research background
Yunnan province has a high prevalence of diabetic retinopathy (DR).Accordingly,it is of great significance to explore the DR-related factors and to construct an economic and intuitive clinical prediction model.
Research motivation
The research motivation is early intervention using the DR-related risk factors from the perspective of a predictive model to reduce the prevalence of DR in patients with type 2 diabetes mellitus (T2DM).
Research objectives
The research intends to establish a prediction model that allows clinically early prevention and treatment of DR.
Research methods
A total of 1654 Han population with T2DM were recruited in this study and were grouped in the without DR and DR groups.The DR group was further subgrouped according to the severity of DR.Then,univariate analysis,logistic regression analysis,and clinical decision tree models of clinical data were performed.
Research results
Based on the decision tree model constructed in this study,DR classification outcomes were obtained by evaluating diabetes duration followed by stages of chronic kidney disease,supine systolic blood pressure (SBP),standing SBP,and body mass index.
Research conclusions
Personalized interventions for DR-related risk factors based on a decision tree model may potentially reduce the prevalence of DR.
Research perspectives
In this study,patients with T2DM in Western China were taken as samples to analyze the influencing factors of DR and build a clinical prediction model.In the future,it is hoped that the prediction model can produce certain social and economic benefits in clinical practice.In addition,when comparing with other clinical studies on DR,we found some controversies,such as the impact of sex and body mass index on DR,which opened up a new direction for future research.
FOOTNOTES
Author contributions:Zhou YY contributed to the conception and design,acquisition of data or analysis and interpretation of data,and drafting the article or revising it critically for important intellectual content;Yang Y and Zhou TC were responsible for supervision,project administration,and funding acquisition;Chen N and Zhou GZ were responsible for literature and formal analysis;Wang JR,Bai CF,Long R,Xiong YX,Zhou HJ,and Li XD were responsible for patient recruitment and clinical data curation;all authors gave final approval of the version to be published.
Supported bythe Natural Science Foundation of China,No.82 160159;Natural Science Foundation of Yunnan Province,No.202101AY070001-199;Scientific Research Fund of Yunnan Education Department,No.2021J0303;and Postgraduate Innovation Fund of Kunming Medical University,No.2020D009.
Institutional review board statement:The study was reviewed and approved by the Ethics Committee of Affiliated Hospital of Yunnan University (Approval No.2021062).
Informed consent statement:Written informed consent was obtained from all participants.
Conflict-of-interest statement:All the authors report no relevant conflicts of interest for this article.
Data sharing statement:No additional data are available.
STROBE statement:The authors have read the STROBE Statement-checklist of items,and the manuscript was prepared and revised according to the STROBE Statement-checklist of items.
Open-Access:This article is an open-access article that was selected by an in-house editor and fully peer-reviewed by external reviewers.It is distributed in accordance with the Creative Commons Attribution NonCommercial (CC BYNC 4.0) license,which permits others to distribute,remix,adapt,build upon this work non-commercially,and license their derivative works on different terms,provided the original work is properly cited and the use is noncommercial.See: https://creativecommons.org/Licenses/by-nc/4.0/
Country/Territory of origin:China
ORCID number:Yuan-Yuan Zhou 0000-0003-2608-4866;Chao-Fang Bai 0000-0003-4724-6537;Ying Yang 0000-0001-5753-7106.
S-Editor:Chen YL
L-Editor:A
P-Editor:Chen YL
杂志排行
World Journal of Diabetes的其它文章
- Dietary Nε-(carboxymethyl) lysine affects cardiac glucose metabolism and myocardial remodeling in mice
- Role of defensins in diabetic wound healing
- Combination therapy of hydrogel and stem cells for diabetic wound healing
- Nutritional supplementation on wound healing in diabetic foot: What is known and what is new?
- Advances in neovascularization after diabetic ischemia
- Orthotic approach to prevention and management of diabetic foot: A narrative review
