Associations between body mass index in diff erent childhood age periods and hyperuricemia in young adulthood: the China Health and Nutrition Survey cohort study
2022-11-08QianYaWeiKongNaYiJunWanYinKunaYn
i Qian · Ya-Wei Kong · NaYi-Jun Wan · Yin-Kun aYn
Keywords Age · Body mass index · Children · Hyperuricemia · Obesity
tInroduction
Uric acid is the end product of purine metabolism from dietary and endogenous. Either increased production of uric acid or decreased renal excretion may lead to hyperuricemia.It has been well recognized that hyperuricemia causes gout and chronic nephrosis, and predicts the increased risks of various cardiometabolic disorders, including hypertension,type 2 diabetes, metabolic syndrome, and cardiovascular disease [ 1— 4]. The prevalence of hyperuricemia has been rising signif icantly in recent years. A recent meta-analysis showed that hyperuricemia aff ects 13.3% of Chinese adults [ 5]. A previous study in Wuhan, China showed that the prevalence increased most sharply in young adults aged 20—39 years during the past ten years [ 6]. Uric acid is of particular signif icance as a predictor of metabolically unhealthy status and cardiovascular dysfunction in young populations [ 7, 8].
Population studies suggested that hyperuricemia is closely related to overweight and obesity in children [ 9,10]. Although complications of hyperuricemia are extremely rare in children and adolescents, the pathophysiological process starts in early life [ 11]. Screening children with a higher risk of hyperuricemia before an alert age would be most benef icial. However, there is a paucity of knowledge concerning the specif ic age period in childhood when the association of obesity with adult hyperuricemia begins to be operative. Therefore, we investigated whether the association between increased childhood body mass index (BMI)and the risk of adulthood hyperuricemia diff ers among different childhood age periods. Our investigation was based on data from the China Health and Nutrition Survey (CHNS)cohort study conducted from 1989 to 2009 [ 12, 13].
Methods
Study population and design
Data were from the CHNS, an international collaborative project between the National Institute for Nutrition and Health of the Chinese Center for Disease Control and Prevention and the University of North Carolina in Chapel Hill. The survey procedures have been described in detail elsewhere [ 13, 14]. In brief, the CHNS is a multipurpose longitudinal dynamic cohort study based on surveys done in 1989, 1991, 1993, 1997, 2000, 2004, 2006, 2009, and 2011. Height, weight, and triceps skinfold thickness (TSF)were measured in all surveys. Waist circumference (WC)was measured in all surveys except for the survey in 1989.Fasting blood samples were collected in 2009, and serum uric acid was measured. The CHNS was approved by the institutional review boards of the University of North Carolina at Chapel Hill, the Ministry of Health of the People's Republic of China, the National Institute for Nutrition and Health, and the Chinese Center for Disease Control and Prevention. Informed consents have been obtained from participants (or their parent or legal guardian in the case of children under 16).
The present study included 676 subjects who had data on uric acid when they were aged ≥ 18 years in 2009 and had at least one measurement of BMI when they were aged 0 to 18 years in surveys conducted between 1989 and 2006. Participants were entered into f ive age groups according to their age at diff erent time points during the childhood follow-up period, including the groups of age ≤ 5 years, age 6—9 years,age 10—12 years, age 13—15 years, and age 16—18 years.
Clinical measurements
Standard procedures were followed by well-trained examiners [ 14]. Height and weight in childhood and in early adulthood were measured without shoes and in lightweight clothing. Height was measured to the nearest 0.1 cm using a portable stadiometer. Weight was measured to the nearest 0.1 kg on a calibrated beam scale. BMI was calculated as weight in kilograms divided by the square of height in meters. BMIZscores for boys and girls were calculated based on 2000 Center for Disease Control and Prevention growth charts for the United States [ 15]. WC was measured at a point midway between the lowest rib and the iliac crest in a horizontal plane using nonelastic tape. TSF was measured using skin calipers and was recorded to the nearest 0.5 mm at the triceps on the right arms (between the tip of the olecranon process of the ulna and the acromion process of the scapula). Waist-to-height ratio (WHtR) was calculated as WC in meters divided by height in meters.
For childhood, overweight and obesity were defined according to the international cut-off points of BMI for overweight and obesity by sex between 2 and 18 years [ 16]. For adults (including both females and males), overweight was def ined as a BMI ≥ 24.0 kg/m 2 , and obesity was def ined as a BMI ≥ 28.0 kg/m 2 [ 17].
After at least 8 hours of overnight fasting, blood samples were collected from household respondents, and then the plasma and serum samples were frozen and stored at - 86℃. All samples were analyzed in a national central lab with strict quality control. Serum uric acid levels were analyzed by the enzymatic colorimetric method. Hyperuricemia was def ined as fasting serum uric acid exceeding 420 μmol/L(7 mg/dL) for males and 360 μmol/L (6 mg/dL) for females in a normal purine diet [ 18].
Statistical analysis
Data were presented as mean (standard deviation) orn(%).Comparison of characteristics between sexes was conducted by Chi-square tests for categorical variables and Student’sttests for continuous variables. Linear regression analysis was used to examine the associations between childhood obesity indices and adult uric acid. Logistic regression models were used to calculate the odds ratios (ORs) and 95%conf idence intervals (95% CIs) of hyperuricemia in adulthood. All regression analyses were adjusted for sex and adult age (continuous). All statistical analyses were performed with SPSS 22.0. Statistical signif icance was referred to at a 2-tailedP< 0.05.
Results
Characteristics of the study population
Table 1 shows characteristics of the study population. We included 676 participants who were aged 18 to 37 years in 2009. There were 357, 365, 358, 427, and 432 observations among groups of ≤ 5 years, 6—9 years, 10—12 years,13—15 years, and 16—18 years, respectively. In adulthood, the prevalence of overweight and obesity was 17.3% and 6.4%,respectively. Age, BMI, uric acid, and the prevalence of
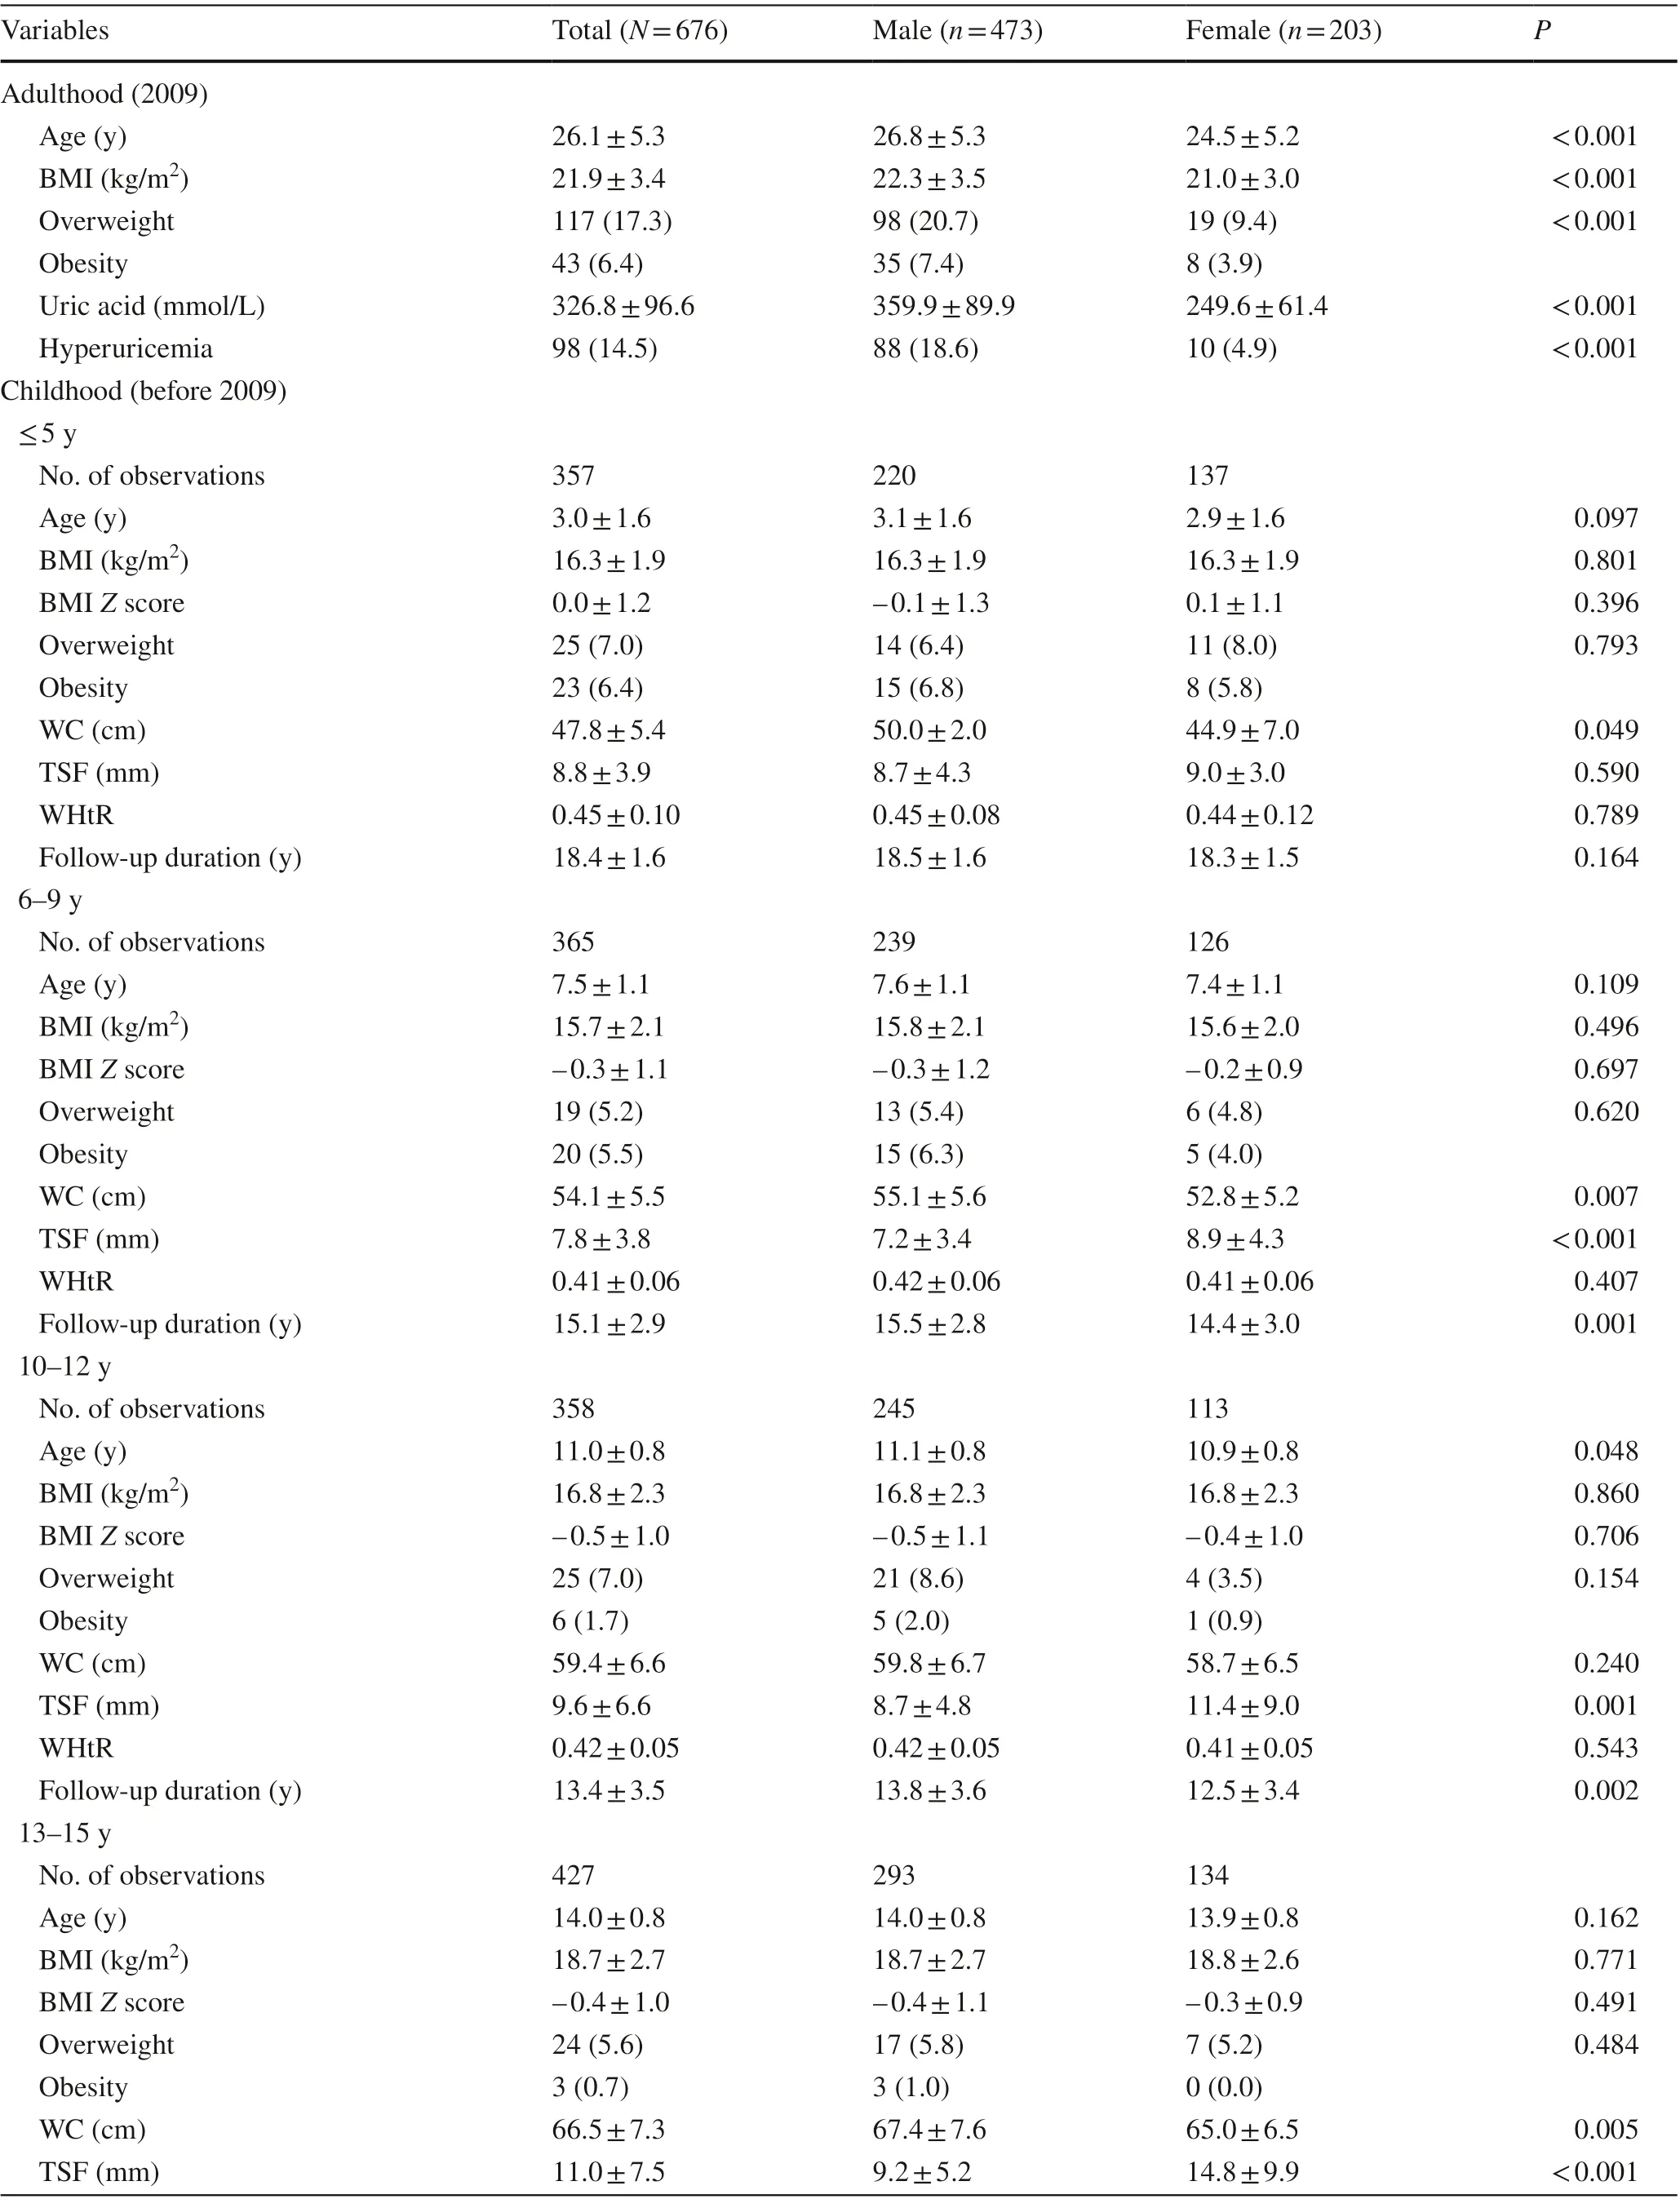
Table 1 Characteristics of the study population

Table 1 (continued)
overweight, obesity, and hyperuricemia were higher in males than in females. The prevalence of overweight was 7.0%for the group of ≤ 5 years, 5.2% for the group of 6—9 years,7.0% for the group of 10—12 years, 5.6% for the group of 13—15 years, and 3.9% for the group of 16—18 years. The prevalence of obesity was 6.4%, 5.5%, 1.7%, 0.7%, and 0%, respectively. The follow-up duration decreased from 18.4 years for the group of ≤ 5 years to 10.0 years for the group of 16—18 years. Girls versus boys had higher BMI and BMIZscore in the group of 16—18 years.
Association between childhood BMI Z score and adult uric acid
Table 2 shows the association between childhood BMIZscore and adult uric acid in 5 age groups adjusted for sex and adult age. Childhood BMIZscores measured at age ≤ 5 years, 6—9 years, 10—12 years, and 13—15 years had no statistical association with adult uric acid. In comparison,childhood BMIZscores measured at age 16—18 years were signif icantly associated with adult uric acid (β= 11.539,P= 0.007), and the strength of association was stronger in girls (β= 18.565,P= 0.002) than in boys (β= 9.209,P= 0.087).We further explored the associations of WC, TSF, and WHtR with adult uric acid, and we found that adult uric acid was signif icantly positively associated with WHtR measured at 6—9 years and 16—18 years and with TSF measured at 16—18 years (Supplementary Table 1). No signif icant association was observed for WC in all age groups.
Association between childhood BMI Z score and the risk of adult hyperuricemia
Table 3 shows the association between childhood BMIZscore and the risk of adult hyperuricemia in logistic regression models adjusted for sex and adult age. For groups ≤ 5 years, 6—9 years, 10—12 years, and 13—15 years,there was no significant association between childhood BMI and adult hyperuricemia. In comparison, for group16—18 years, childhood BMI was associated with an increased risk of adult hyperuricemia (OR = 1.323, 95%CI = 1.003—1.746,P= 0.048). We found no signif icant association in all age groups for both sexes.
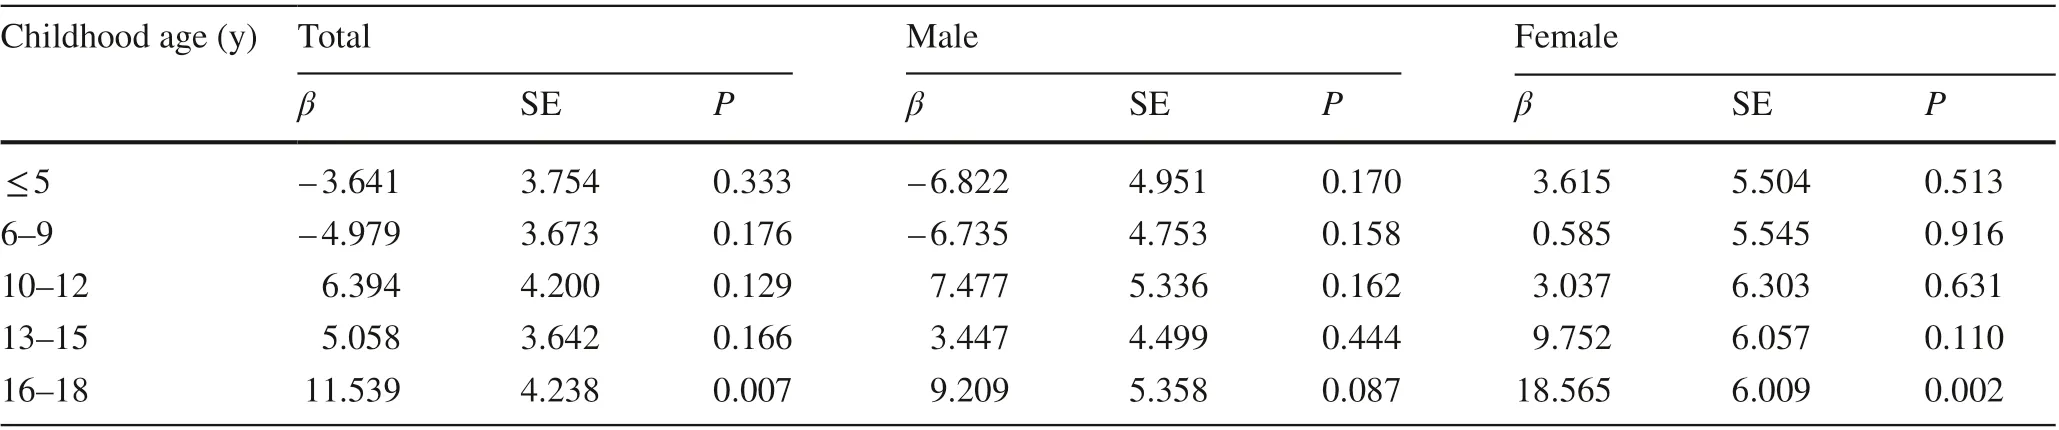
Table 2 Linear regression of adult uric acid with childhood body mass index Z score stratif ied for age a
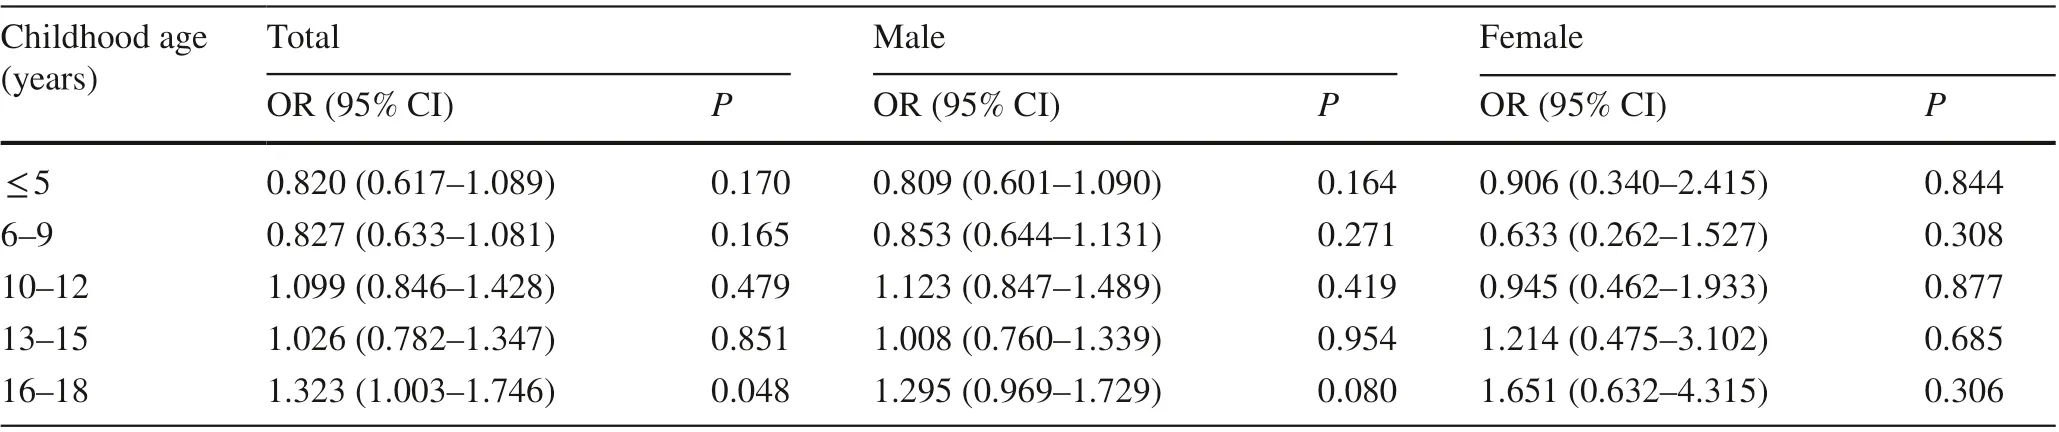
Table 3 Odds ratios of adult hyperuricemia with childhood body mass index Z score stratif ied for age a
We further explored the associations of WC, TSF, and WHtR with adult hyperuricemia and found that WC measured at 6—9 years was associated with increased risk of adult hyperuricemia, not for other age groups. No signif icant association was observed for TSF and WHtR in all age groups(Supplementary Table 2).
Discussion
This longitudinal cohort study with multiple follow-up surveys from childhood to adulthood suggests that children with increased BMI at 16—18 years had higher risk of hyperuricemia in young adulthood, and no association was observed in other age groups. In addition, the association between BMI measured at 16—18 years and adult uric acid was stronger in girls than in boys. The association between childhood BMI and young adulthood hyperuricemia was inf luenced by childhood age.
We found that the prevalence of hyperuricemia was signif icantly higher in males (18.6%) than in females (4.9%),which is consistent with previous f indings [ 19]. This difference could be explained by the diff erence in fat storage patterns that males accumulate more metabolically harmful abdominal fat, whereas females accumulate more peripheral fat, which is less metabolically harmful. In addition,males have higher muscle mass than females, which can partly explain the diff erent prevalence of hyperuricemia [ 20,21]. Further studies are needed to explore the underlying etiology.
Several cross-sectional studies of Chinese children and adolescents showed that BMI was signif icantly associated with elevated uric acid [ 9, 10, 22]. A retrospective study among children aged 4—18 years in Denmark also found a correlation between uric acid and BMI and observed that uric acid decreased after losing weight [ 23]. Yun et al.examined the temporal relationship between BMI and uric acid in a longitudinal cohort study from childhood to adulthood and found that changes in BMI precede alterations in uric acid [ 24]. These f indings suggest that obesity is an important risk factor for hyperuricemia. Few cohort studies have examined the association between childhood BMI and adult hyperuricemia. A recent prospective cohort study of 298 Japanese children aged 6—12 years found that a greater change in BMI was associated with increased uric acid levels in young adulthood after adjustment for adult BMI [ 25].Several reports have demonstrated that programs for reducing body weight through lifestyle interventions eff ectively decreased uric acid levels in children with obesity [ 26, 27]and that uric acid was associated with reduction of fat mass during weight loss in children and adolescents with obesity[ 28]. Our study conf irmed these f indings. In addition, the participants in our study covered all age periods throughout childhood, allowing us to perform analyses stratif ied by childhood age.
We found that, for children aged 16—18 years, childhood BMI was positively associated with adult uric acid and the risk of adulthood hyperuricemia, but no association was observed in other age groups. Studies in diff erent areas of the world, such as Latin America, have shown similar association in children [ 29, 30]. These results suggested that for children in diff erent age periods, BMI may play diff erent roles in predicting the risk of developing hyperuricemia in adulthood. The lack of signif icance in other age groups may be due to low statistical power. Further studies with larger sample sizes and more precise age grouping were needed to f igure out whether there exists an age inf lection point.
In this study, we found that the association between BMIZscore measured at age 16—18 years and adult uric acid was signif icantly stronger in girls than in boys. Consistent with our f indings, previous studies have found that the association of obesity with cardiometabolic disease risk diff ered between females and males, and the diff erence changed during the early life [ 31, 32]. It has been reported that boys gain more muscle mass, whereas girls gain more fat mass during puberty period because of hormonal changes [ 33]. These f indings could partly explain the diff erence in the association of BMI with uric acid between boys and girls.
We also explored the association of adult hyperuricemia with some other obesity indices that ref lect body fat distribution, including WC, TSF, and WHtR. We found that adult uric acid was signif icantly positively associated with WHtR measured at 6—9 years and 16—18 years and with TSF measured at 16—18 years. However, no signif icant association with hyperuricemia was observed except for the association of WC measured at age 6—9 years, which may be due to the insuffi ciency of sample size. Further longitudinal cohort studies with larger sample sizes are needed to identify whether fat distribution in childhood impacts the development of adult hyperuricemia.
The mechanism underlying the association between obesity and uric acid has not been fully clarif ied. Visceral fat deposits have been more closely associated with the overproduction of uric acid than subcutaneous fat deposits [ 34]. Tsushima et al. reported that in mouse models,the production and secretion of uric acid were enhanced in obesity, which might contribute to hyperuricemia and may be related to hypoxia in adipose tissue and active lipid metabolism [ 35]. In turn, uric acid may promote adipogenesis through increasing reactive oxygen species production and upregulating the renin-angiotensin system in white adipose tissue [ 36].
The present study is one of the few investigations concerning the association between childhood BMI and adult hyperuricemia based on a longitudinal cohort with multiple follow-up surveys. We explored the specif ic age period when this association begins to be operative, which may help to inform the right time to start clinical screening of childhood obesity for future risk of adult hyperuricemia and related cardiometabolic disorders.
The study also has some limitations. First, we have not obtained information about factors that may aff ect adult uric acid, such as dietary habits and physical activity. Second,we did not f ind signif icant associations in some age groups,which may be due to the insuffi ciency of sample size. Third,due to the short follow-up duration, we were not able to analyze the association between childhood BMI and hyperuricemia-related complications. Fourth, our data were collected in a selected Chinese sample, which is not representative of the whole Chinese population.
In conclusion, our results showed that the association between childhood BMI and young adulthood hyperuricemia was inf luenced by childhood age. Our f indings emphasized the importance of screening obesity among children in preventing future hyperuricemia and related complications.
Supplementary InformationThe online version contains supplementary material available at https:// doi. org/ 10. 1007/ s12519- 022- 00573-x.
Author contributionsQY contributed to writing of the original draft(lead), formal analysis (equal), reviewing and editing (equal). KYW contributed to data curation (supporting), formal analysis (supporting),reviewing and editing (equal). WNJ contributed to conceptualization(supporting), methodology (equal), reviewing and editing (equal).YYK contributed to conceptualization (lead), data curation (lead),methodology (equal), formal analysis (equal), reviewing and editing(equal). All the authors approved the f inal version of the manuscript.
FundingThis research received no external funding.
Data availabilityThe datasets generated and analyzed during the current study are available in the China Health and Nutrition Survey repository, www. cpc. unc. edu/ proje cts/ china .
Declarations
Ethical approvalThe China Health and Nutrition Survey was approved by the institutional review boards of the University of North Carolina at Chapel Hill, the Ministry of Health of the People's Republic of China,and the National Institute for Nutrition and Health, Chinese Center for Disease Control and Prevention. Informed consent to participate in the study have been obtained from participants (or their parent or legal guardian in the case of children under 16).
Conflict of interestNo f inancial or non-f inancial benef its have been received or will be received from any party related directly or indirectly to the subject of this article. The authors have no conf lict of interest to declare.
杂志排行
World Journal of Pediatrics的其它文章
- Single ventricle: amphibians and human beings
- Clinical diff erences among racially diverse children with celiac disease
- Effi cacy of live attenuated vaccines after two doses of intravenous immunoglobulin for Kawasaki disease
- Frequency and safety of COVID-19 vaccination in children with multisystem inf lammatory syndrome: a telephonic interview-based analysis
- Music therapy and pediatric palliative care: songwriting with children in the end-of-life
- Secondary genomic f indings in the 2020 China Neonatal Genomes Project participants