Performance Analysis for Mobility Management of Dual Connectivity in HetNet
2022-11-03WeiHuangLinGuoKaiSun
Wei Huang, Lin Guo, Kai Sun
Abstract: Dual connectivity (DC) is regarded as a promising technology to increase users’ throughput, provide radio link robustness, and improve load-balancing among base stations (BSs). However, since the introduction of DC makes the mobility of network more complex and diversified,especially the mobility management of heterogeneous networks (HetNets) based on DC faces great challenges. Taking event-A3-based measurement report as the trigger condition for handover (HO),this paper compares and evaluates the influences of HO of master nodes (MNs) and secondary nodes (SNs) on link reliability in different bearing modes. Particularly, hybrid automatic repeat request (HARQ), throughput, channel quality indicators (CQIs), and data packets queuing time are taken as link reliability analysis indicators. Besides, we study how DC utilizes the traffic split ratio between MNs and SNs to maximize the superiority of throughput. Simulation results show that DC can effectively reduce the impact of HO on the number of HARQ and increase the throughput of users. When the data traffic is tilted to the secondary nodes, the superiority of throughput is more obvious.
Keywords: dual connectivity; heterogeneous network (HetNet); mobility management; traffic split ratio
1 Introduction
With the improvement of communication architecture in 5th generation mobile networks (5G)and the largescale popularization of mobile user equipments (UEs), the demand for mobile traffic data generated in user’s side is increasing exponentially. To address the demands of future wireless communication, many emerging technologies have been proposed [1,2]. Among them,dual connectivity (DC) is considered as a popular technology that can improve the throughput of edge UEs by allowing them to transmit and receive data from two cell groups simultaneously via master nodes (MNs) and secondary nodes(SNs) [3]. For DC, much research has been conducted on the application scenarios [4,5], network architecture [6,7], resource allocation [8,9], performance analysis [10,11], and mobility management [12−15].
The deployment of DC in typical scenarios was studied, including cities, suburbs, high-speed rails, and highways [4,5]. In order to adapt to different network scenarios, different types of technologies are used, such as ultra dense network (UDN), long term evolution (LTE) and wireless local area network (WLAN) aggregation (LWA), enhanced LWA (eLWA), and heterogeneous network (HetNet) [6,7]. The cooperative radio resource management algorithms among these different standard networks are mainly divided into two types: centralized method and distributed method [8,9]. Ba et al.[10] compared the performances between multiconnectivity and coordinated multi-point(CoMP) transmission and reception, and the results proved that DC could improve the throughput of UEs in the case of low user density. Sharma et al. [11] investigated the mechanisms of discontinuous reception and sleep mode,and evaluated the performance based on Markov model.
In general, the mobility management of DC can be divided into two categories: handover(HO) performance analysis [12], and HO scheme and its optimization [13−15]. The HO performance of UEs in DC with millimeter-wave technology was compared through Network Simulator 3 (NS-3) system-level simulation [11]. The scheme selects the connection based on the signal to interference plus noise ratio (SINR) measurement of the UE. He et al. [13] considered the HO problem of DC between dedicated shortrange communication (DSRC) and LTE, and proposed a scheme based on raptor code which can significantly reduce the number of communications between MNs and SNs. Hsieh et al. [14]implemented DC in the architecture with control plane (CP) and user plane (UP) separation,and proposed a DC-based pre-handover scheme to improve the robustness of HO. Wang et al.[15] proposed an intelligent strategy for mobility management based on deep learning. The simulation results show that the intelligent mechanism proposed in this paper can significantly improve the quality of service (QoS) of users in the HO process while ensuring the energy efficiency of the network.
In conclusion, networks with different standards will use different mobility management schemes and QoS evaluation methods, and the introduction of DC makes the mobility of network more complex and diversified, for example,resulting in cumbersome HO and interaction procedures. However, the above works on the DC mobility management mainly focus on the improvement of the HO algorithm, ignoring the comparison and analysis of the impact of the moving speed on the network performance. In addition, link-level simulations are usually used in most of the related works, and system-level simulations are rarely used to model DC protocol stacks. Based on the above research status,this paper studies the mobility performance of DC in HetNet through system-level simulation,mainly focusing on the following points:
1) The influence of MN/SN HO on the number of hybrid automatic repeat request (HARQ)attempts in different bearing modes is analyzed;
2) The relationship between throughput and moving speed of UEs in different bearers is analyzed;
3) The way how traffic split ratio improves throughput is analyzed.
2 System Model
In this section, the models for signal and protocol stack are elaborated, respectively.
2.1 Signal Model
The model of path loss can be expressed as

wherenis the factor of path loss,dis the distance between the UE and base station (BS) in m,fcis carrier frequency in GHz,Xis the shadow attenuation in dB. In the urban scene, with the line of sight,n=2,X=4.1; with the non-line of sight,n=3,X=6.8.
The reference signal receiving power(RSRP) can be expressed as

wherePtis the transmit power of the BS,Gtis the transmit antenna gain,Gris the receive antenna gain,Ris the number of physical resource blocks allocated by the system.
The SINR of the UE can be written as
whereIis the sum of the RSRP of the co-channel BSs,N0is the noise power.
2.2 Protocol Stack Model
According to the 3rd generation partnership project (3GPP) standardized modeling of DC[16], four bearing modes are considered in this paper. The protocol stack models of LTE evolved node B (eNB) and new radio (NR) generation node B (gNB) are shown in Fig. 1. They all consist of packet data convergence protocol (PDCP)sublayer, radio link control (RLC) sublayer and medium access control (MAC) sublayer.
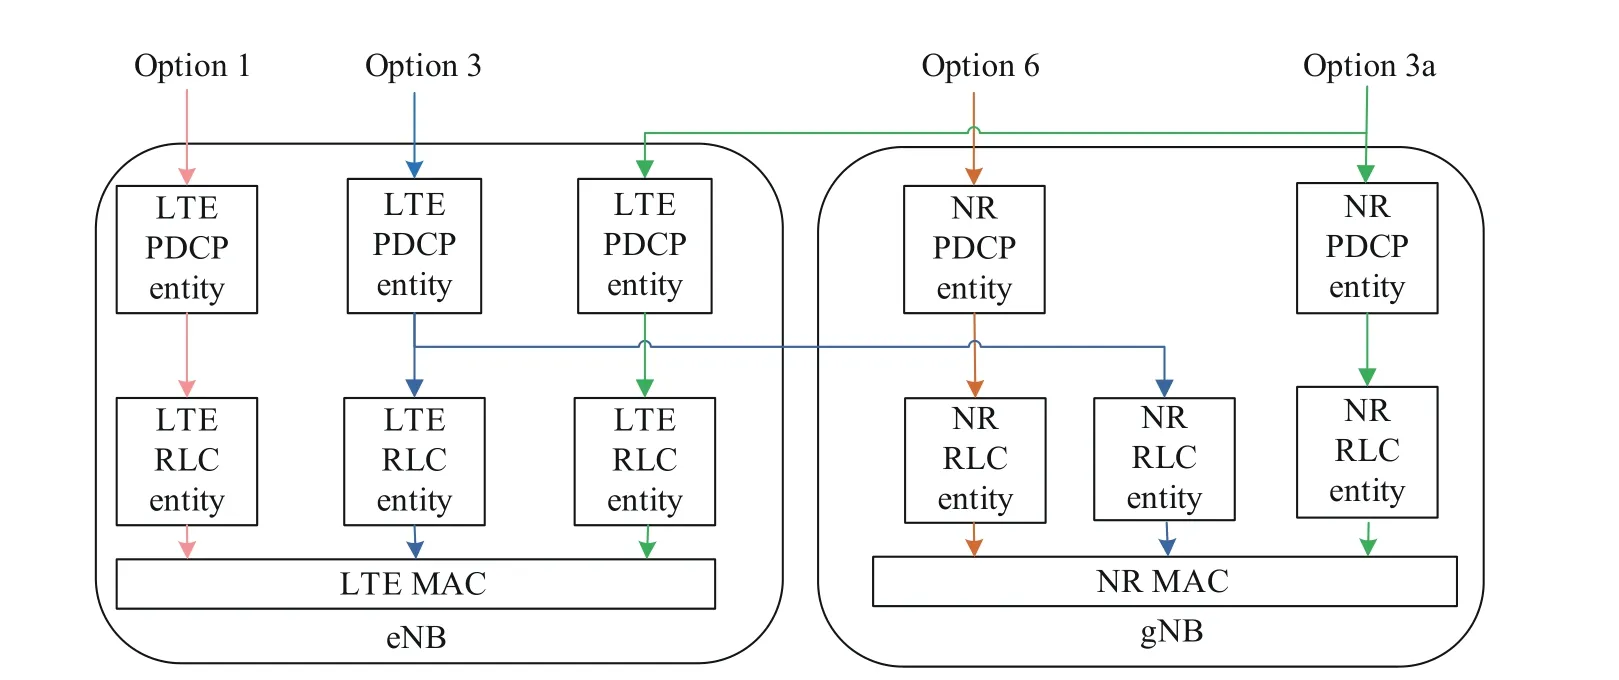
Fig. 1 Protocol stack model
1) Option 1: MN bearer (master cell group(MCG) bearer), in which the UE is served by eNB, and CP data and UP data are independently undertaken by eNB.
2) Option 6: SN bearer (secondary cell group (SCG) bearer), in which the UE is served by gNB, and CP data and UP data are independently undertaken by gNB.
3) Option 3: Split bearer, in which the UE is served by gNB and eNB. The eNB is connected to core network (CN), and the gNB has no direct connection with the CN. During the downlink, all data must flow through eNB [15]. UP data is divided at PDCP entity of MN, and then distributed to UE by different BSs. During the uplink, the PDCP layer will reorder the data packets, and then present the service to the upper layer.
4) Option 3a: The UE is served by gNB or eNB, and both eNB and gNB are connected to CN. During the downlink, the UP data are divided at the CN, and flow to the eNB or gNB before passing through the PDCP entity, but the CP data are all handed over to the eNB, and then communicate with the gNB through the Xx interface to ensure its MN status.
3 Event-A3-Based Handover Strategy
The HO trigger condition adopted in this paper is based on event A3, which is typically used for intra-frequency or inter-frequency HO procedures. The HO procedure will be triggered when the entering condition shown below is met.

wherePNis RSRP of the neighboring candidate BS,PSis RSRP of the source BS.His the hysteresis of trigger event that is mainly used to adjust the threshold for entering and leaving the trigger condition, and it determines the time that the UE stays in the trigger event. Similarly, the HO procedure will be cancelled when the leaving condition shown below is met.

Adjusting the value ofHcan adjust the difficulty of reporting measurement events, which can reduce frequent triggering of events due to wireless signal fluctuations.
The signaling procedure applied for DC is shown in Fig. 2, and it is summarized as follows[17]
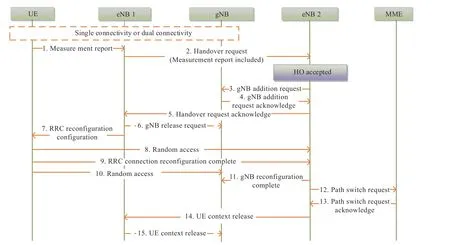
Fig. 2 The signaling procedure of HO in DC
Step 1: Measurement report is sent to eNB 1 and HO is triggered.
Step 2: eNB 1 sends HO request to eNB 2 along with UE’s measurement report, which is used for eNB 2 to select an appropriate gNB to continue dual connectivity, if possible.
Step 3: If eNB 2 decides to add or keep the gNB, eNB 2 sends “gNB addition request” to gNB. If UE is in DC with the gNB and eNB 1 before the HO, eNB 2 includes the “gNB UE X2 application protocol identifier (AP ID)” as a reference to the UE context in the gNB that is established by eNB 1.
Step 4: The gNB replies with “gNB addition request acknowledge” and may also provide forwarding addresses to eNB 2.
Step 5: eNB 2 replies with “Handover request acknowledge”.
Step 6: eNB 1 sends “release request” to the gNB.
Step 7: eNB 1 triggers the radio resource control (RRC) connection reconfiguration procedure. The RRC message includes secondary cell group (SCG) configuration.
Step 8: Random access is performed towards eNB 2.
Step 9: UE replies with “RRC connection reconfiguration complete” to eNB 2.
Step 10: Random access is performed towards the gNB.
Step 11: Upon completion of the RRC connection reconfiguration procedure, eNB 2 confirms the reconfiguration with the gNB.
Step 12: eNB 2 sends “Path switch request”to switch the bearers in both eNB 2 and the gNB. If the gNB is kept, eNB 2 may include the same tunnel endpoint identifier (TEID) used for SCG bearer.
Step 13: Mobility management entity(MME) replies with “Path switch request acknowledge”. If new uplink (UL) TEIDs at the serving gateway (S-GW) are included, eNB 2 performs “eNB initiated gNB modification” procedure to provide them to the gNB.
Step 14: eNB 2 sends “UE context release”to eNB 1.
Step 15: eNB 1 sends “UE context release”to the gNB.
4 Simulation and Result Analysis
4.1 Simulation Scenario
As shown in Fig. 3, on a road with a length of
2 km, 2 eNBs and 10 gNBs are arranged, of which gNBs numbered 1-5 are SNs of eNB 1,and gNBs numbered 6-10 are SNs of eNB 2. 50 UEs are randomly distributed in the system.
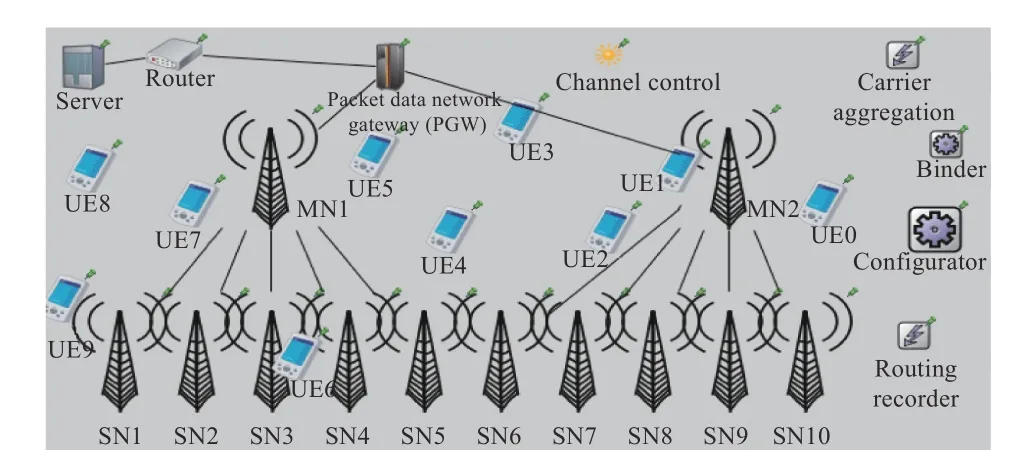
Fig. 3 Simulation scenario
The performance of the mobility management is evaluated by Objective Modular Network Testbed in C++ (OMNet++) simulator[18] in Ubuntu 16.02. The main simulation parameters are shown in Tab. 1.
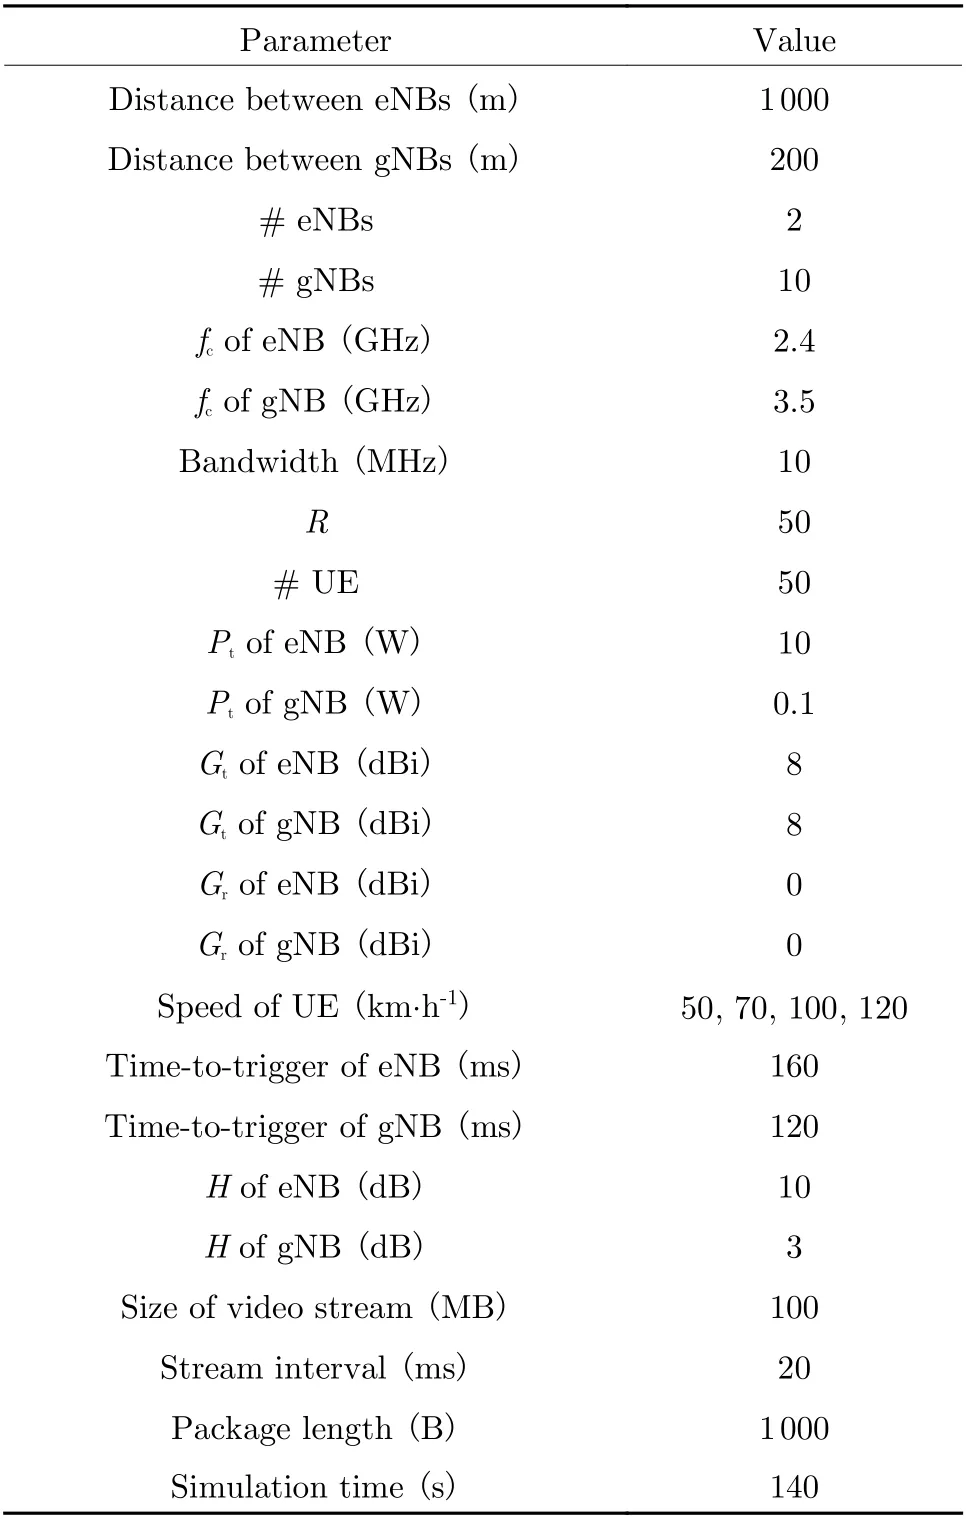
Tab. 1 Simulation parameters
4.2 Results and Analysis
Fig. 4 shows the evolution of SINRs of UE 6 from the eNBs and gNBs during its moving. The SINR can reflect the quality of the corresponding wireless link. It can be found that the MN performed HO around 75.075 s, and the SN was also forced to HO.
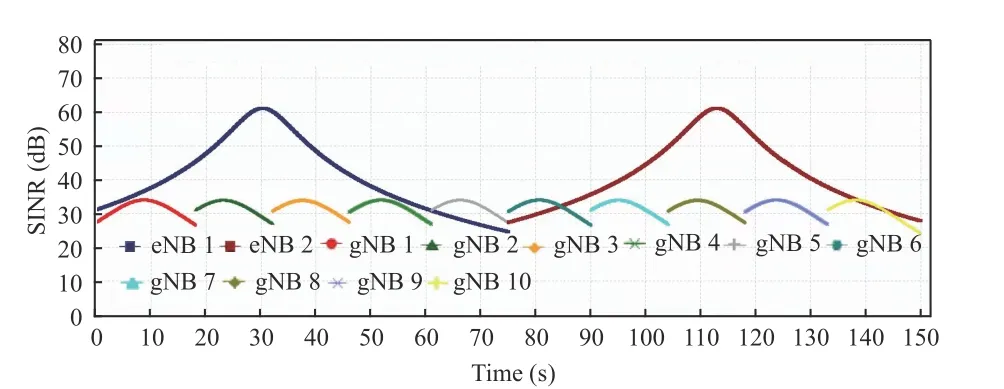
Fig. 4 The SINR of UE 6
Fig. 5 shows the number of HARQ attempts of UEs in four different bearing modes. It can be found that the average number of HARQ attempts increases during the HOs, especially when both MN and SN perform HOs. This is because UEs will not put off the HO to transmit the HARQs, and the HARQs will be accumulated when the link is interrupted. In Option 1 and Option 6, the curves fluctuate at 43 s, 61 s,98 s, and 161 s. This is because HO of SN is performed very frequently. Before and after the link is restored, the HARQs are initiated more frequently due to packet transmission interruption.In contrast, the traffic is split, so the impact of HO of MN is alleviated in Option 3 and Option 3a. Therefore, the DC can reduce the number of HARQs as a whole, which means it has more advantages in maintaining link stability.

Fig. 5 The number of HARQ attempts
Fig. 6 shows the average throughput of UEs under different bearing modes and moving speeds. At the four moving speeds, the throughput of the DC network is significantly higher than that of the single-connection network. The throughput of UE in Option 3 is 19% higher than that of Option 1 at 50 km/h, and the throughput of UE in Option 3a is 28.5% higher than that of Option 1. The throughput of UE in Option 3 is only 11% higher than that in Option 1 at 100 km/h, and the throughput of UE in Option 3a is 20.5% higher than that in Option 1. This proves that adding a gNB as a SN on the eNB side is an effective and economical method to improve throughput. It is a remarkable fact that, the faster the UE moves, the less the throughput advantage will be.
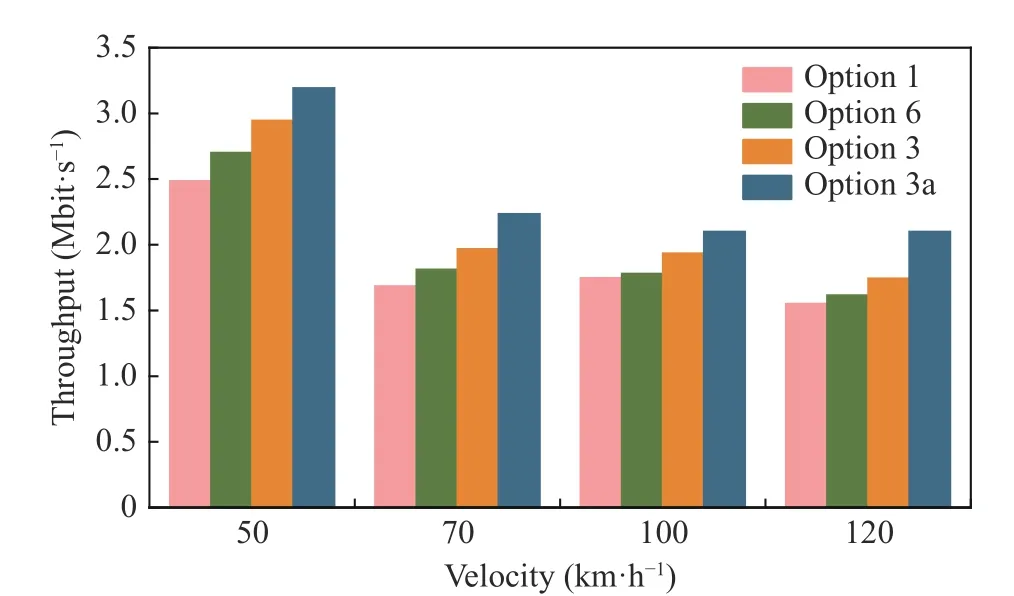
Fig. 6 The average throughput of UEs
Fig. 7 shows the evolution of the channel quality indicator (CQI) value of UE 6 at two different speeds in Option 3 bearer. When the speed is 100 km/h, the CQI curve changes violently.This is because the SINRs of the MN and SN will fluctuate greater when the UE moves faster.Then, the modulation scheme and transport block size change frequently according to the feedback CQI value, and the number of resource blocks scheduled in each scheduling period also changes, which exacerbates throughput in the downlink decreases, with the superiority of dual connectivity reduced.
Fig. 8 shows the impact of different traffic split ratios on the throughput and queueing time of MN and SN in Option 3. The red curve represents the queuing waiting time versus different traffic split ratios of MN and SN when the speed of UE is 100 km/h. It can be found that the packet queuing time reaches the minimum value when the traffic is split by a ratio of 5:5, and the throughput reaches the maximum value when the traffic is split at a ratio of 3:7. This proves that adjusting traffic split rate in dual connectivity based on networks is a simple and available way to schedule resources. When the data traffic is tilted to the secondary nodes, the superiority of throughput is more obvious.
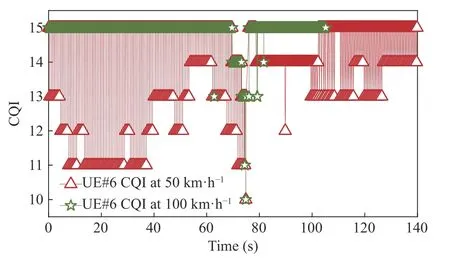
Fig. 7 CQI of UE 6
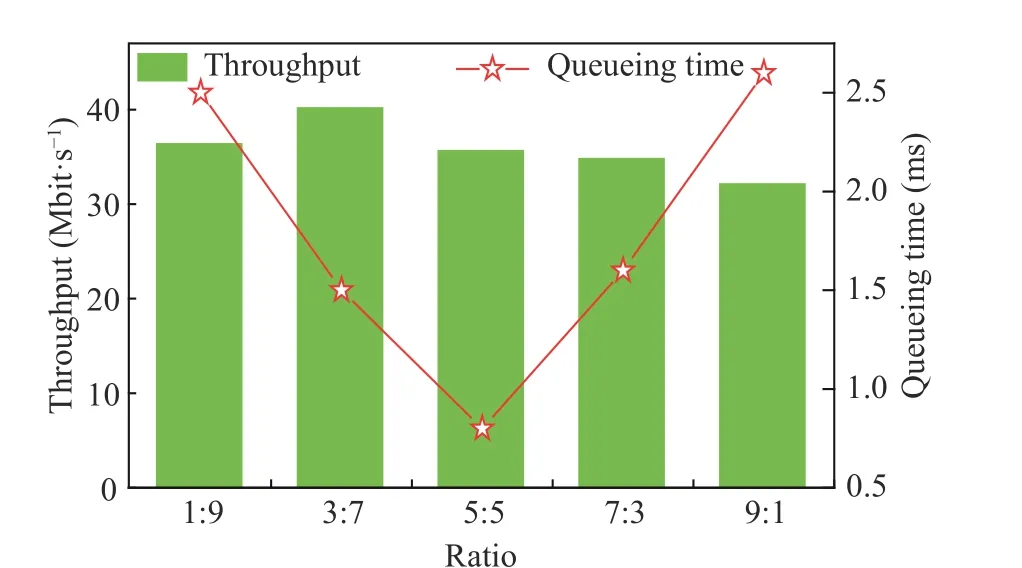
Fig. 8 The throughput and queueing time vs. traffic split ratio
Fig. 9 compares the resource block utilization of MNs and SNs under different traffic split ratios. As can be seen from the figure, when the traffic split ratio of MN and SN is 3:7, the average resource block utilization rate of SNs is close to 100%. Under this ratio, the SN can be utilized more fully, and the resource block of MN is more used for traffic scheduling and signaling management. It can be inferred that, in the Option 3, when the SN undertakes about 70% of the sending tasks, the resource blocks can be utilized to the greatest extent.
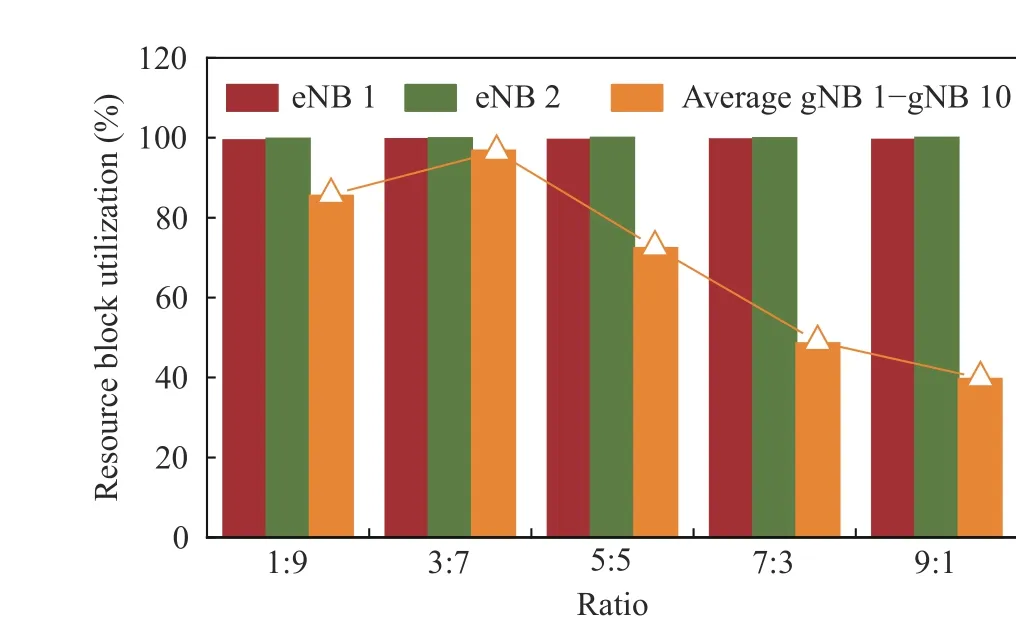
Fig. 9 Resource block utilization vs. traffic split ratio
5 Conclusion
Through the analysis and comparison of the mobility management performance of DC and single connectivity, there are three main findings.Firstly, DC reduces the times of HARQs as a whole, and has more superiority in maintaining service continuity and reducing latency. Secondly, adding a gNB as a secondary note on the eNB side is an effective and economical method to improve throughput. That is, DC has obvious superiority in increasing cell throughput. Thirdly,adjusting traffic split rate in dual connectivity based on networks is a simple and available way to schedule resources which can bring additional gain for throughput.
杂志排行

Journal of Beijing Institute of Technology的其它文章
- Resource Allocation for Uplink CSI Sensing Report in Multi-User WLAN Sensing
- A Multi-Vehicle Cooperative Localization Method Based on Belief Propagation in Satellite Denied Environment
- Optimization and Design of Cloud-Edge-End Collaboration Computing for Autonomous Robot Control Using 5G and Beyond
- Optimize the Deployment and Integration for Multicast-Oriented Virtual Network Function Tree
- Symbol Synchronization of Single-Carrier Signal with Ultra-Low Oversampling Rate Based on Polyphase Filter
- Intelligent Reflecting Surface with Power Splitting Aided Symbiotic Radio Networks