Interaction-Aware Cut-In Trajectory Prediction and Risk Assessment in Mixed Traffic
2022-10-26XiangleiZhuWenHuZejianDengJinweiZhangFengqingHuRuiZhouKeqiuLiandFeiYueWang
Xianglei Zhu, Wen Hu, Zejian Deng, Jinwei Zhang, Fengqing Hu, Rui Zhou,Keqiu Li,, and Fei-Yue Wang,
Abstract—Accurately predicting the trajectories of surrounding vehicles and assessing the collision risks are essential to avoid side and rear-end collisions caused by cut-in. To improve the safety of autonomous vehicles in the mixed traffic, this study proposes a cut-in prediction and risk assessment method with considering the interactions of multiple traffic participants. The integration of the support vector machine and Gaussian mixture model (SVM-GMM) is developed to simultaneously predict cut-in behavior and trajectory. The dimension of the input features is reduced through Chebyshev fitting to improve the training efficiency as well as the online inference performance. Based on the predicted trajectory of the cut-in vehicle and the responsive actions of the autonomous vehicles, two risk measurements are introduced to formulate the comprehensive interaction risk through the combination of Sigmoid function and Softmax function. Finally, the comparative analysis is performed to validate the proposed method using the naturalistic driving data. The results show that the proposed method can predict the trajectory with higher precision and effectively evaluate the risk level of a cut-in maneuver compared to the methods without considering interaction.
NOMENCLATURE
HV Host vehicle
PV Preceding vehicle
CV Cut-in vehicle
LV Leading vehicle
SVM Support vector machine
GMM Gaussian mixture model
MTTC Modified time to collision
MTHW Modified time headway
CRI Comprehensive risk index
LC Lane-change
LK Lane-keep
IA-GMM Interaction-aware Gaussian mixture model
CTRA Constant turn rate and acceleration
I. INTRODUCTION
THE aggressive lane-change maneuver called cut-in is one of the main reasons for the side and rear-end collisions[1], [2]. As a common traffic situation in both highway and urban roads, the lane change behavior has been widely studied with the focus on the behavior recognition and influence factors in past years [3]. However, only a few of the previous publications involve the strong interactions existing in the cutin situations. Therefore, the research gaps still exist in the influence of the interactions on the cut-in prediction, risk assessment and reactive planning [4]. The purpose of this study is to improve the accuracy of cut-in trajectory prediction and risk estimation by considering the interactions among road users. It is beneficial for the collision avoidance of the autonomous vehicle when it encounters a cut-in vehicle in the mixed traffic [4].
The predicted object may have various motion states at each time step due to the constraints of other vehicles, even if it carries out a special driving behavior. However, the majority studies of interaction-aware prediction consider interaction only at behavior level [5]. Besides, although there are numerous studies that focus on the individual prediction or risk assessment for the cut-in behavior [3], they do not entail these fields in a systematic framework for the mixed traffic.
Therefore, this work studies the interaction behavior and realizes online risk estimation for the cut-in scenarios in the mixed traffic, as shown in Fig. 1. The SVM model is firstly designed to estimate the cut-in behavior, and the GMM is developed to predict the trajectory of the cut-in vehicle. To reduce the dimension of the input variables, the Chebyshev fitting is adopted to process the perceived states of the surrounding vehicles. Furthermore, two risk metrics are modified to synthesize the risk when a vehicle executes the cut-in. Finally,the performances of the prediction and risk assessment are validated using the naturalistic driving dataset, and the differences are analyzed and compared between the methods whether considering the interactions.
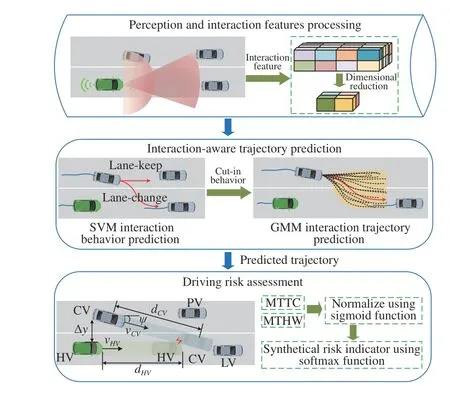
Fig. 1. Interaction-aware motion prediction and risk assessment framework.
The main contributions of this paper are summarized as: 1)An integrated trajectory prediction and risk assessment framework is proposed for the autonomous vehicle in cut-in scenarios. 2) To compromise the computation efficiency and performance of the online application, a hierarchical interactionaware prediction method is proposed. The SVM-GMM is developed to model the interaction behavior of the cut-in scenarios. 3) To compensate the deficiency of the existing risk measures and improve the adaptability for various driving environments, a new risk assessment method is proposed to assess the threat of a cut-in maneuver by combining different risk measurements.
The rest of this paper is organized as follows: The related works are reviewed in Section II. Section III presents a detailed formulation of the interaction-aware motion prediction and risk assessment problem. The validations of our methods are described in Section IV. Finally, the conclusions and future works are presented in Section V.
II. RELATED WORK
A. Cut-In Driving Behavior
Behavior prediction is a common topic among the cut-inrelated researches, and deep learning, regression models are frequently used. Lyuet al.developed a cut-in intention and trajectory predictor for the collision warning of advanced driving assistant systems based on SVM and long short-term memory network [6]. A recurrent neural network is designed in [7] to recognize the cut-in behavior, and then used to guide the trajectory control of autonomous vehicles. Besides the behavior prediction, the influence factors and the risk analysis of cut-in events are also the research focus [3]. The relative distance is demonstrated to have a greater influence on the perceived risk level of the lag vehicles than the velocity differences [8]. Aramrattanaet al.defined a novel cut-in risk indicator based on time-to-collision and applied it to the platooning merging [9]. Xieet al.developed a learning model with the decision tree and SVM to map the extracted features of a cut-in scenario to three impact levels [10]. However, the interactions between the traffic participants are not stressed well in the majority of cut-in researches.
B. Motion Prediction
It is essential to predict the evolution of the traffic situation and the future trajectories of other vehicles for accurately estimating risk [11], [12]. The physics-based and maneuver-based methods have been demonstrated incapable of solving the prediction problem in the complex driving environment where the interplay exists among the traffic anticipants [13]. The interaction-aware prediction has attracted wide attention due to its long-term prediction capability [1]. Generally, a set of special behaviors are predefined and assigned as labels for the collected data. The well-trained model is then used to recognize the driving behavior or intention [14], [15]. Machine learning is a frequently-used technology to model interaction behavior [16]. Schulzet al.proposed a prediction framework based on dynamic Bayesian network and Monte Carlo to infer the evolution of the future scenes and trajectories for each agent [17]. Xionget al.designed a collision predictor for early warning of driving assistant systems, in which the SVM is used to recognize the lane-change scene and then the collision incident is estimated by hidden Markov model [18]. Yoonet al.used the Gaussian process regression to model the interaction behavior and estimate the parameters of a lane-change maneuver [19]. In the above researches, the future trajectory is generated through polynomial or other kinematics-based methods after predicting the driving intention [5], and the interactions are only considered at behavior level.
A few studies focus on the interactions at both behavior and trajectory levels. Daiet al.proposed a modified multi-level long short-term memory network to model the interactions, in which the driving policy is predicted in the higher level and the future trajectory is generated in the lower level [20]. Xieet al.developed a driving behavior awareness network based on the Bayesian theory, and then adopted the interactive multiple model to conduct the motion prediction [21]. The well-demonstrated neural network and Bayesian network have a great performance to predict the trajectories in complex environments[13]. However, they depend on the design of network structure and the feed of mass data, the spatiotemporal complexity and heavy computation limit their application on cut-in scenarios to a certain extent. In addition, the deep discussion regards to the influence of interaction factors on predicted trajectory is insufficient.
C. Risk Assessment
The driving risk can be assessed through three methods: surrogate safety measurement, statistics-based metrics and fieldbased metrics. Single surrogate safety measurement, such as time-to-collision, time-to-brake and time headway, cannot accurately determine the driving risks in some scenarios [22].Thus, some researches modified or integrated those single indicators to increase the applicable scenarios for the risk measurement [23]. The statistics-based metrics are usually implemented based on the probability distribution with the uncertainty considered [22]. The Monte Carlo sampling and Markov model are frequently used to predict the trajectories of the surrounding vehicles based on the particle filter [24].Then the collision probabilities were calculated through the collision detection algorithm [25]. Field-based is another method to assess the driving risk, in which the obstacles, road boundary and driver will produce potential field, kinetics field and behavior field [26]. On the basis of these fields, the risks caused by different factors can be modeled and integrated[27]. Although the statistics-based method and field-based method can take the uncertainty and multi-factors into account, they have limited performance in online application due to the complexity of the required parameters and the huge computation [25].
III. PROBLEM FORMULATION
In the foreseeable future, the autonomous vehicles have to share the driving spaces with human-driven vehicles. In a typical mixed-traffic scenario presented in Fig. 2, the driverless host vehicle (HV) drives on the right lane, and a humandriven vehicle (CV) in the left lane intends to change lanes in front of the HV. The collisions mainly occur between the CV and the HV in these conditions. The risk is especially high when there is a sudden cut-in conducted by the human-driven CV, and the driverless HV does not have enough time to brake. To address this challenge, the cut-in prediction model and risk assessment method are developed in this work to assist the later decision-making and planning of collision avoidance for the autonomous vehicle.

Fig. 2. A typical cut-in scenario.
As shown in Fig. 2, the interaction mainly exists among four vehicles, i.e., HV, CV, lead vehicle (LV) and preceding vehicle (PV). It can be known that the slower preceding vehicle is the main motivation for the cut-in behavior of the CV.The CV will change his longitudinal and lateral velocities according to the actions of HV and LV. Conversely, the HV will adjust the driving decision to keep a safe distance if the cut-in behavior is observed.
The purpose of the interaction-aware motion prediction is to estimate the conditional probability distribution of future trajectory ξobj(τ+Tf) of the objective vehicle based on the historical perceived trajectory information ξint(τ-Th) of the interacted vehicles and their interaction featuresψ( τ-Th). The interaction-aware prediction problem is formulated as follows:

whereThandTfdenote the history horizon and prediction horizon respectively. The trajectory vector can be defined as follows:

whereτis the time index;xτ,yτ,vτ,aτandθτdenote the longitudinal and lateral position, the speed the heading angle of the interacted vehicles, respectively.
A. Interaction-aware Cut-In Prediction
The trajectory prediction accuracy can be greatly improved if the driving intention is predicted in advance. Therefore, a hierarchical interaction-aware motion prediction method is designed by integrating SVM and GMM, as shown in Fig. 3.
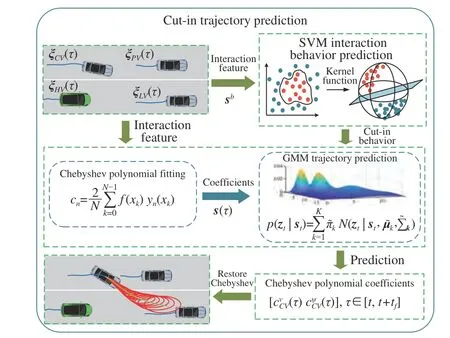
Fig. 3. Hierarchical interaction-aware motion prediction.
1)Interaction-Aware Behavior Prediction
As a machine learning method with strong prediction capability, the SVM technology is applied in the interaction behavior prediction module. The driving behavior is classified into two categories, i.e., lane-change and lane-keep, which is a typical binary classification problem. The cut-in maneuver is the result of mutual effect among the four vehicles, and the input features are therefore defined as
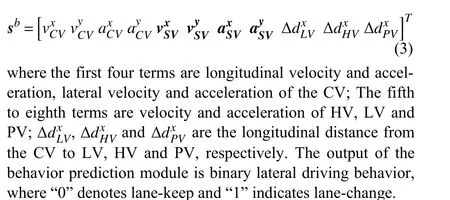
The purpose of behavior prediction is to obtain a decision function that can be used to determine the class of the new data. It is formulated as the constrained optimization problem.
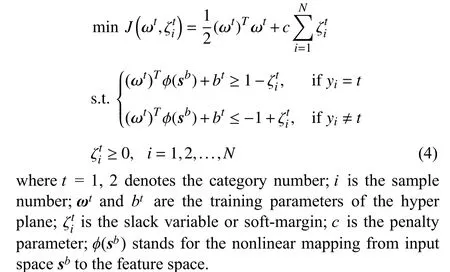
The Karush-Kuhn-Tucker (KKT) condition is introduced and the optimization problem of (4) is transformed into the Lagrange minimization problem [18].
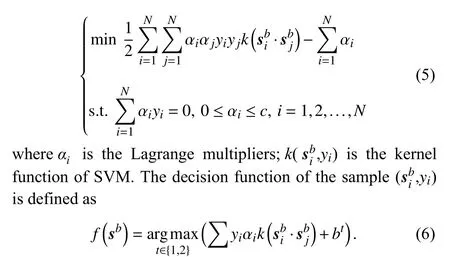
The kernel function is the core of SVM and is generally used to transform the features into higher dimension space if the features cannot be linearly classified in the lower dimension space. Thus, it has a great impact on prediction accuracy and computation efficiency. The linear function, Gaussian radial basis function (RBF), polynomial function and sigmoid function are commonly used as kernel functions. The RBF and polynomial function with more parameters normally have better performances than the linear function and sigmoid function. In this study, the RBF is selected to balance the performance and efficiency.
The parameters and support vector of SVM can be obtained by training with the naturalistic driving data. With the welltrained SVM model, the interactive cut-in behavior can be predicted online and served as one of the input features for the trajectory prediction.
2) Interaction-Aware Trajectory Prediction
The GMM combines multiple Gaussian distributions and it has great strength to address and model the problems with uncertainty due to its excellent approximation properties [28].Therefore, it is chosen here to construct the relationship between the past driving states and the probability distributions of the future motion trajectory.
Interactive cut-in trajectory is influenced by the longitudinal gap distance, relative speed and driving intention of surrounding vehicles. Furthermore, the position of vehicles is related to the velocity. In other words, the longitudinal and lateral positions can be deduced if the corresponding velocities are obtained. Therefore, the system input variables of GMM are defined as (7), which contains the historical information and the interaction features vector Ξ.
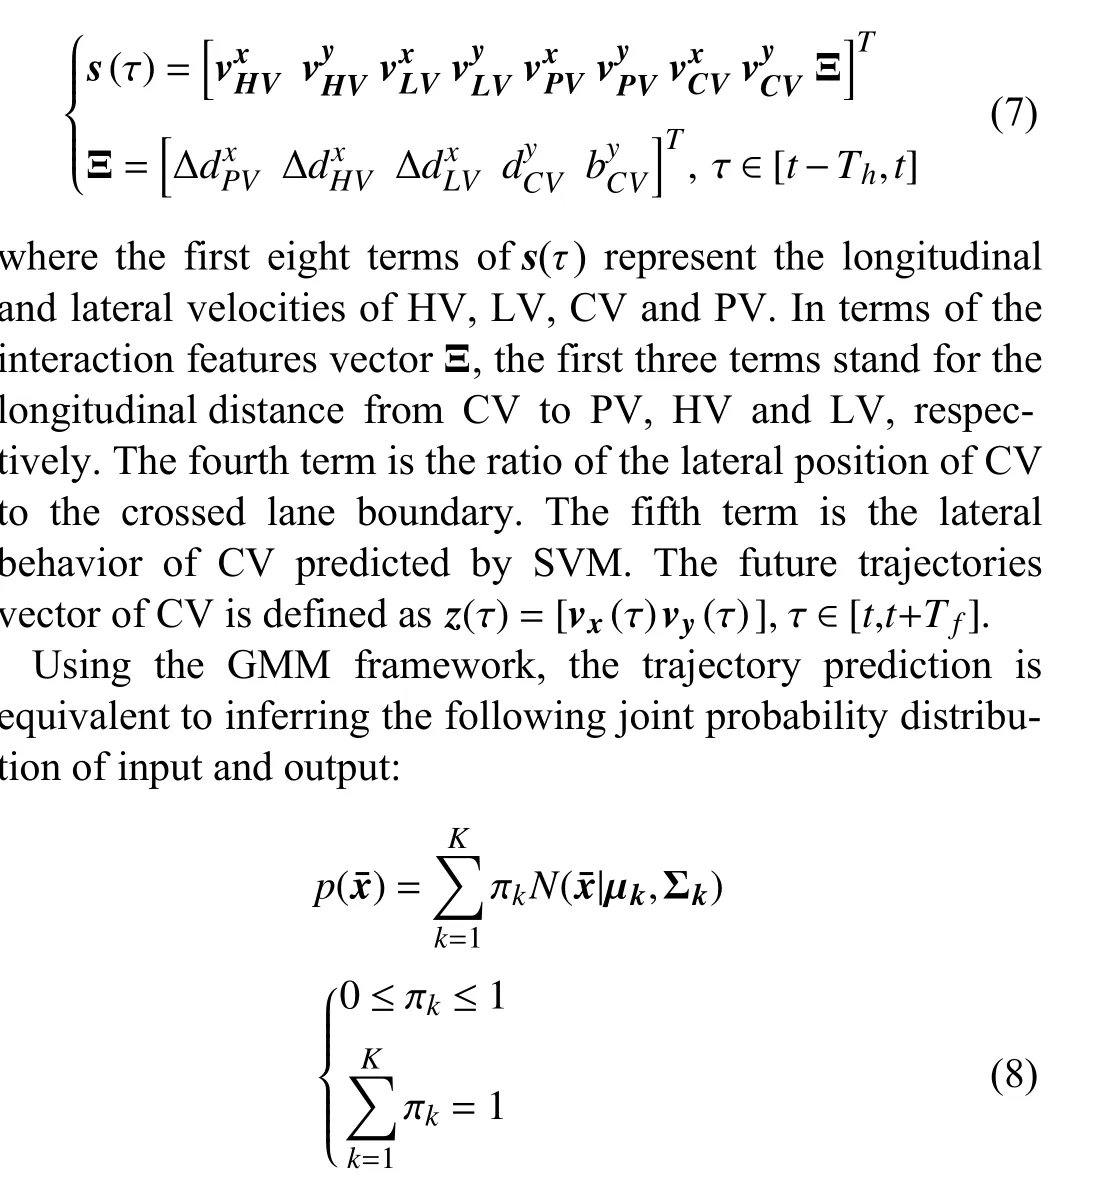
wherexis a multi-dimensional random variable and it is represented asx=[s(τ),z(τ)];Kindicates the number of Gaussian components;kindicates a specific Gaussian component;πk, μk, Σkare the estimated parameters of GMM, they represent the weighting of components, mean value matric and covariance matric.
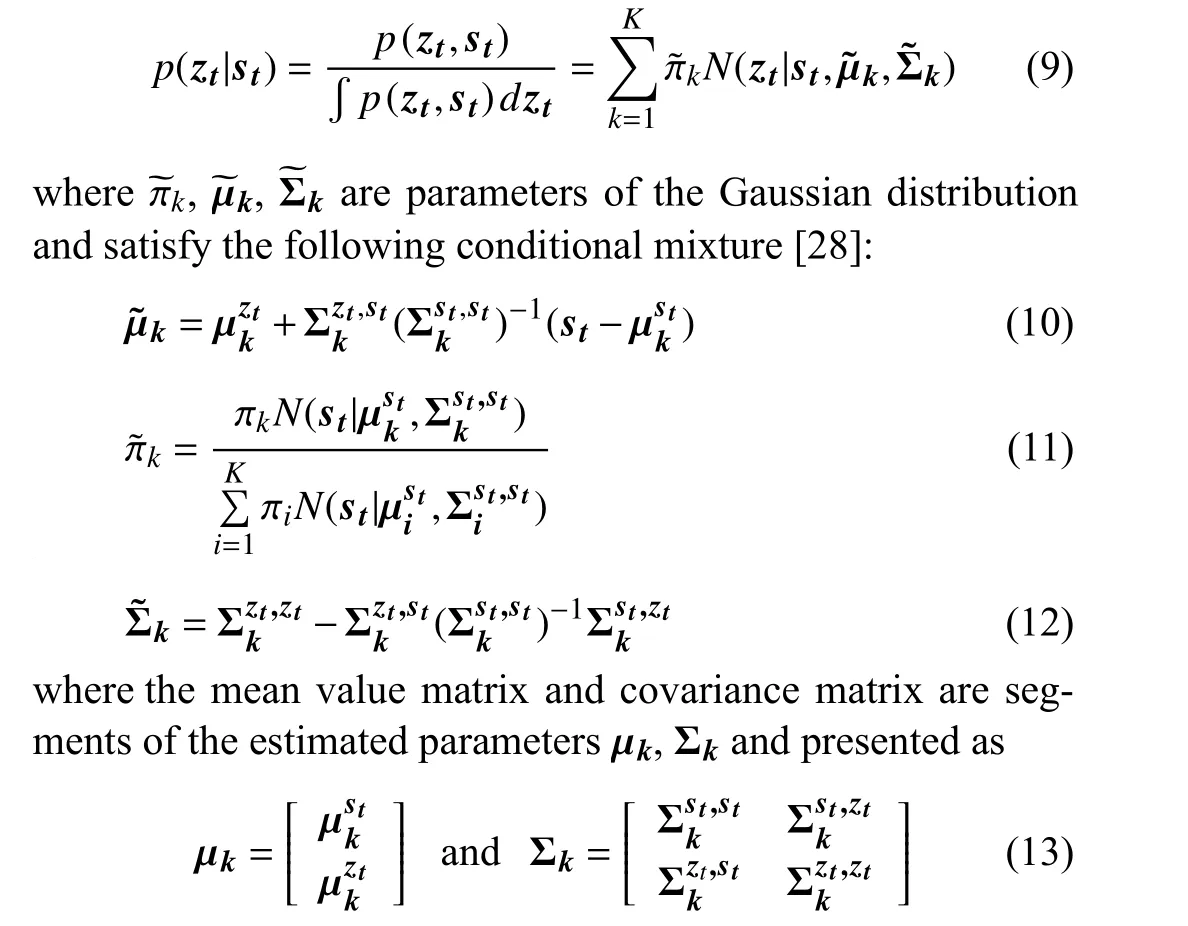
Given a history feature inputst, the future motion states can be predicted by calculating the following conditional distribution of the estimated outputzt:

3) Feature Dimension Reduction
The input information of the motion prediction should be the states in the past time period, which include a huge number of input variables. For example, if the trajectories of the past 3 seconds are considered with the sampling frequency of 25 Hz, the dimension of the input variable will be 3 × 25 × 8 +5 = 605. The computation burden will be huge and the prediction accuracy will be decreased. In order to reduce the dimension of feature variables, the Chebyshev fitting is adopted.First, the Chebyshev polynomialynwith degreenis defined as[2], [28]:
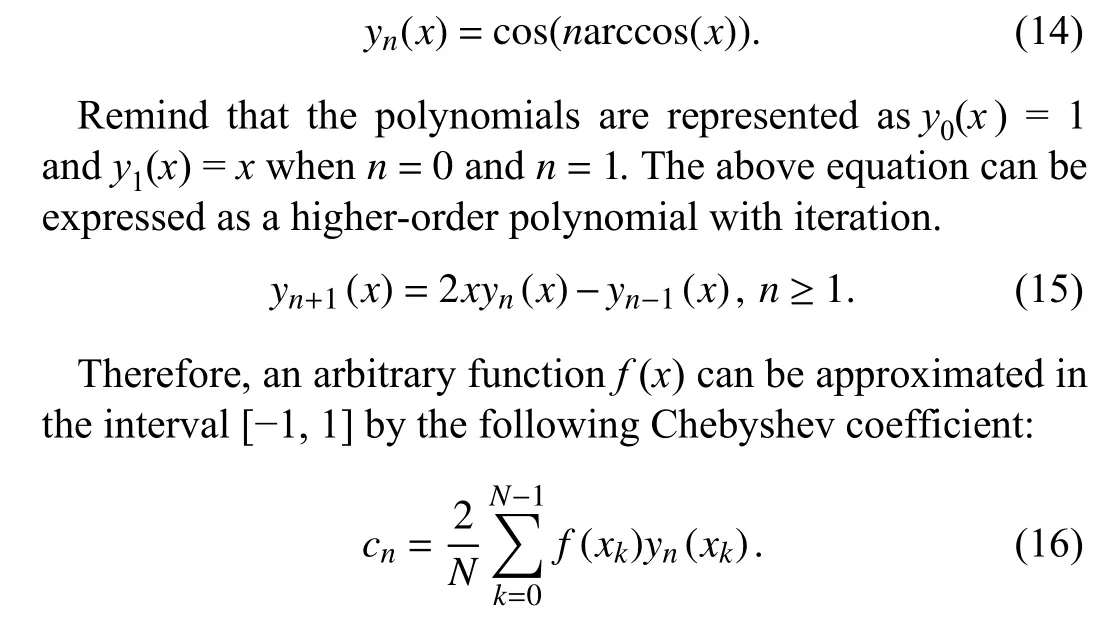
The discrete velocity profile can be approximated after obtaining the coefficients of Chebyshev. Besides, the same process is used to restore the physical trajectory information from the predicted coefficients of the polynomial.
With the application of Chebyshev polynomial, the input velocity profile with sizeh×fcan be transformed into the coefficients with sizen, wherehandfrepresent the past time horizon and sampling frequency, respectively. If a four-order Chebyshev polynomial is adopted, the dimension of the input vector with 3 × 25 × 8 + 5 = 605 elements can be reduced to 5 × 8 + 5 = 45. Obviously, the dimension of input features is greatly reduced so that the computation efficiency of the model in both learning and test stages will be improved.
B. Risk Assessment
The risk for the host vehicle is high when the surrounding human-driven vehicle cuts in suddenly and aggressively.Thus, the interaction risk needs to be assessed after the cut-in behavior and trajectories are predicted to assist the collision pre-warning and trajectory planning of the driverless host vehicle.
An effective automatic driving system is expected to respond and keep a safe distance to the cut-in vehicle. Therefore, a response-based intelligent driver model is proposed to predict the trajectory of the host vehicle, relying on the recognized lateral behavior. The predicted accelerationaHV(τ) is expressed as follows [29]:

whereamaxandbmaxare the maximum acceleration and deceleration respectively, andbmax<aHV(τ) <amax;vdis the desired speed;s0andsddenote the allowable minimum and desired Euclidean distances to the leading vehicle, respectively;Tis the response time.
The host vehicle is following the LV in normal driving situations, and it will switch to follow the CV when a cut-in maneuver is observed. Therefore, the real Euclidean distance Δs(τ) with the followed target is expressed as follows:


After the trajectories of CV and HV are predicted, we need proper metrics to assess the current and future risks between the two vehicles. Although the derived metrics time to collision (TTC) is a frequently-used metric for the potential collision prediction, it fails to assess the risk between two vehicles in different lanes. The index of modifiedTTC(MTTC) is therefore proposed in this study to evaluate the cut-in risk. As shown in Fig. 4, the rest distance before a collision is defined as the distance difference betweendHVanddCV, wheredHVis the distance between the HV and the potential conflict area,anddCVis the distance between the CV and the potential conflict area with keeping the current velocity. Thus, theMTTCis defined as the ratio of the rest distance to the relative scalar speed.


Fig. 4. Two-dimension risk in cut-in.
To comprehensively evaluate the driving risk, the other risk measure of modified time headway (MTHW) is supplemented.

Thesigmoidnormalization function is applied to unify the scale of different risk measurements.

It is noted that thesigmoidfunction is monotonically increasing, while a higher risk will be indicated with smallerMTTCandMTHW. Besides, the same normalized value may indicate different risk levels for different risk measurements.Therefore, both theMTTCandMTHWare normalized by using the following way:

whereαis the sharp factor and it determines the rate of change, and a largerαwill cause a steeper curve;βis the corresponding value of the independent variable where the function value is 0.5. These two parameters can be determined using the following equations:

where the (T1,R1) and (T2,R2) are two points in the risk function. It represents the relationship between the desired normalized risk value and the corresponding risk measurement value.
In order to generate a final risk evaluation of the cut-in scene for the host vehicle by combining different risk metrics,theSoftmaxfunction is introduced.
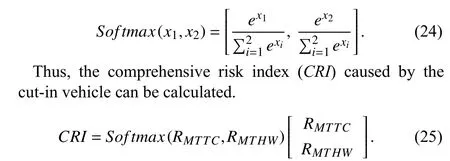
According to the definition ofCRI, the higher each normalized risk value is, the larger weight it occupies.
The normalized risk metric is shown in Fig. 5(a). It can be seen that different parameters have a great influence on normalized risk value. For example, anMTTC= 5 s could be 0.13, 0.2, 0.54, 0.76, 0.83 or 0.95 after normalization with different parameters. Therefore, the proposed normalized function provides a possible way that expresses different risks of different drivers or traffic scenarios when the same risk measurement is calculated. Moreover, theMTTCandMTHWcan select different parameters to represent the different emergency degrees of the two metrics.
The relationship between theSoftmaxfunction-based comprehensive risk and single normalized risk is shown in Fig. 5(b).It is shown that the comprehensive risk is not high when one of the risk measurements is small enough. A great risk will be obtained when both the two risk measurements are large.Therefore, the possible misjudgment and the drawback of single risk measurement can be compensated through the proposed risk assessment method.
IV. RESULTS AND ANALySIS
A. Model Training
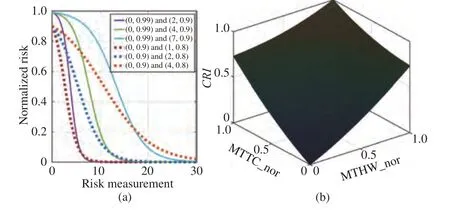
Fig. 5. (a) Normalized risk of single risk measure with different parameters;(b) Comprehensive risk assessment with combining normalized MTTC and normalized MTHW.
The cut-in scenes with strong interactions are extracted from thehighDdataset and processed to train and test the model.HighDdataset is a large-scale naturalistic vehicle trajectory dataset, consisting of 16.5 hours’ recordings [30]. The sampling frequency is 25 Hz with a time interval of 0.04 s. Each vehicle is visible for a median duration of 13.6 s and 420 m length inhighDdataset. The cut-in scenarios require strong interactions between the HV and CV, which means the distance between them should be short enough. Moreover, some lane-change trajectories are not covered completely. Thus, the following three conditions are defined to extract the suitable cut-in scenarios.
The first condition is the selected cut-in trajectory should include the starting timeTs, the crossing timeTcand the ending timeTe. As shown in Fig. 2, the starting time is defined as the instant when the lateral velocity firstly approaches 0.3 m/s. The crossing time is the time stamp when the geometrical center of CV touches the lane marking. The ending time is defined when the lateral velocity decreases to 0.2 m/s. The second condition is the corresponding HV should be within the recording range and keep lane during the whole cut-in duration. The corresponding LV and PV should be recorded beforeTc. The third constraint is that the longitudinal gap distances from CV to HV and LV are small enough to guarantee the interactions. It means that the time headway between HV and CV is less than 3 s at crossing time, and the distance between CV and LV is less than 50 m.
There are 1622 valid cut-in scenes extracted fromhighDdataset by applying the above conditions. For the training of the SVM-based upper behavior prediction model, the data beforeTsand afterTeare assigned label “0”, i.e., lane-keep(LK), and the data within [Ts,Te] are labeled “1”, i.e., lanechange (LC). In terms of the trajectory prediction module based on GMM, the data during the historical horizonThare used as the input, and the data during the prediction horizonTfare the model output. The time window moves along the time axle with an interval of 0.1 s, and the cut-in process is divided into multiple fragments.
The number of Gaussian kernels is set to 600 in this study,and the aforementioned EM algorithm is employed to train the GMM with the maximum iterations 1000 and convergence threshold value 0.001. Additionally, both two models adopt the “10 times 10-fold” cross-validation test. The trajectory information of the past 1 second is considered and the prediction horizon is set to 6 s.
In order to reduce the dimension of the state vector, the longitudinal and lateral velocity profiles are transformed to the speed scalarvand heading angleψ.
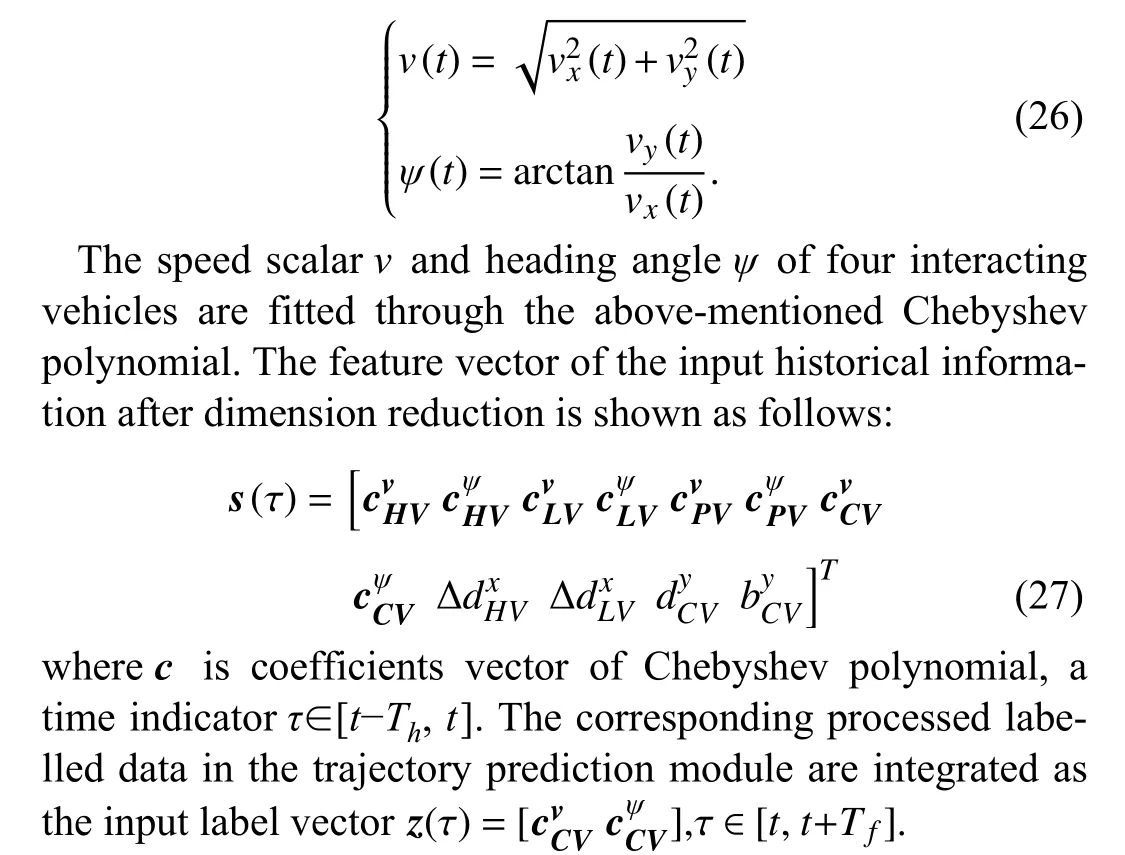
The new input vector has a better approximation ability with a higher degree of the function and more coefficients, and the computation burden is heavier. To determine the optimal degree, different degrees from 1st to 6th are tested using the same trajectory. It is observed from Fig. 6 that the best fitting performance is achieved at the 4th Chebyshev polynomial.Consequently, each coefficientcin inputs(τ) and labelz(τ) is a vector with five elements. With the dimensional reduction,the total training time consumption of behavior and trajectory prediction model is decreased from 1832 s to 706 s.
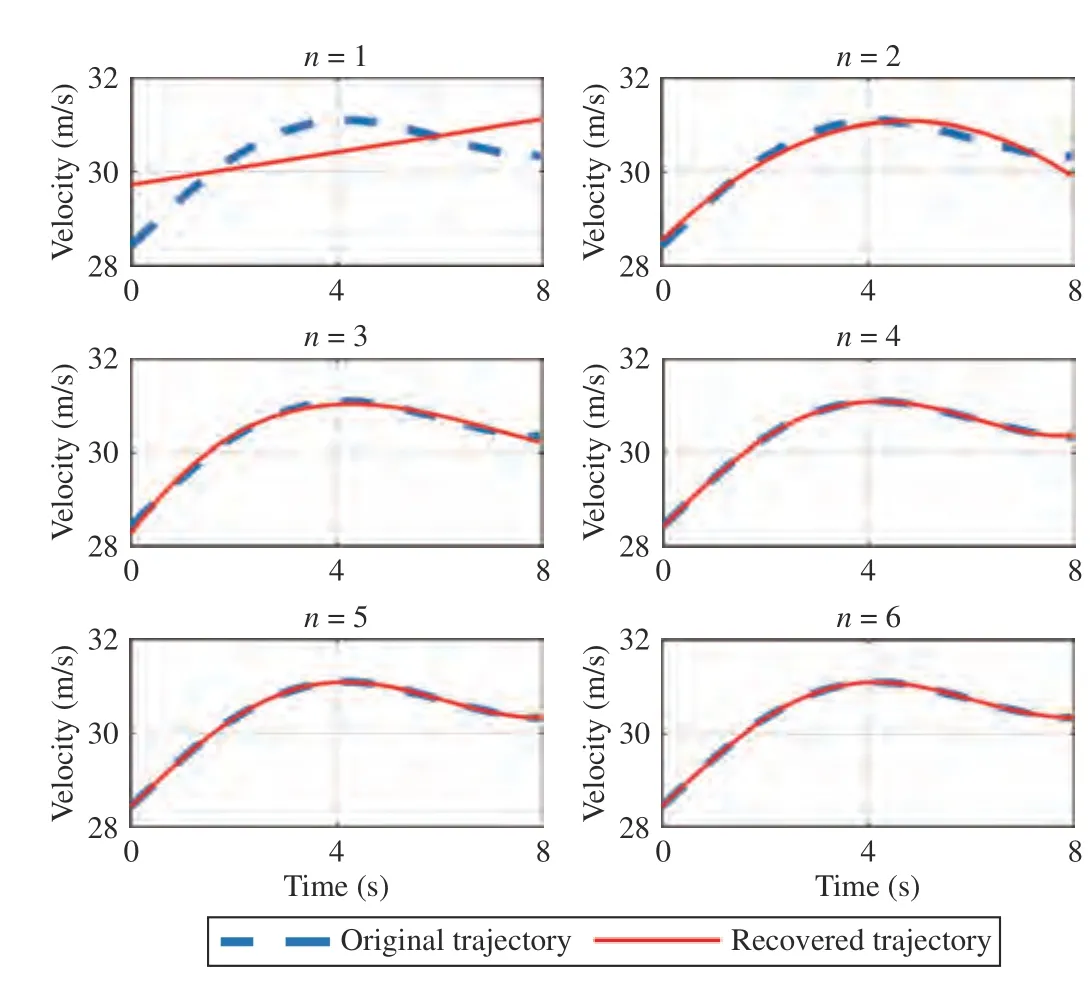
Fig. 6. Approximation performance of Chebyshev with different degrees.
B. Prediction Results and Compares
The cut-in behavior prediction is evaluated by comparing two SVM predictors with different features input. The input of one predictor is shown as (3), and the input of the other predictor only contains states of the cut-in vehicle. The trajectory prediction results are then discussed among three methods,i.e., the proposed hierarchical interaction-aware trajectory prediction model (IA-GMM), the GMM predictor considering only historical information of the cut-in vehicle and without feature dimension reduction, and the physical-based model with constant turn rate and acceleration (CTRA) [19].
1) Cut-In Behavior Prediction
The confusion matrix of the cut-in behavior prediction is shown in Table I with 10 000 samples tested. The precision and recall of the predictor with the interactive features are both superior to those without the interactions considered. The wrong prediction of the latter is much more than the former. A similar conclusion is obtained from Fig. 7 , in which the behavior prediction results of two cut-in scenes are presented.It can be seen that the results of the predictor with the interactive features are closer to the real human driver in both starting and ending of the cut-in.
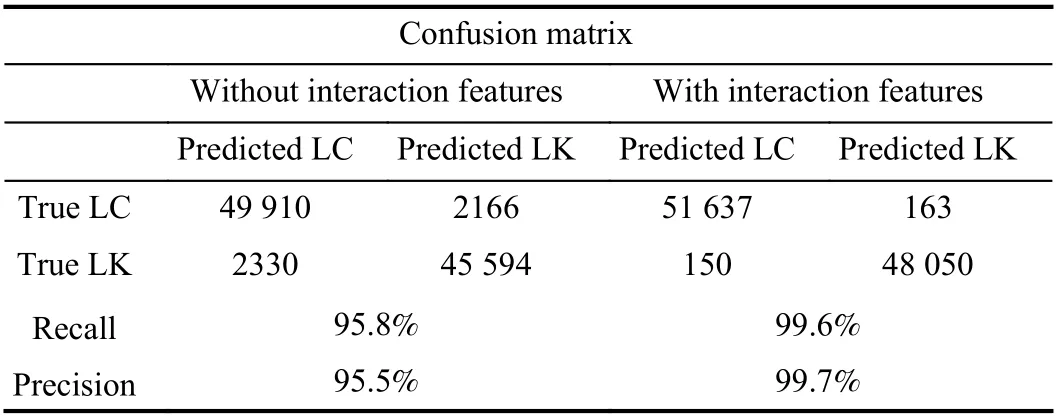
TABLE I PREDICTION PERFORMANCE OF INTERACTION BEHAVIOR
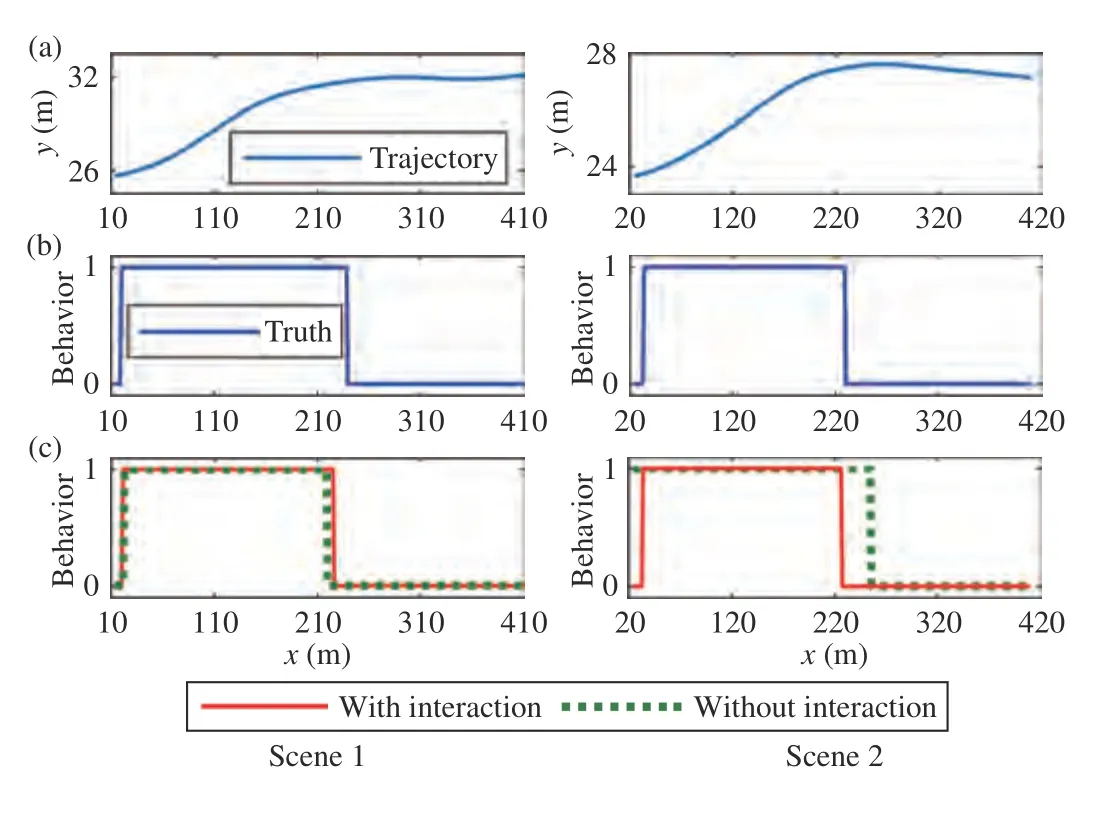
Fig. 7. Cut-in behavior prediction of two scenes. (a) The driving trajectory;(b) The ground truth of driving behavior; (c) The predicted diving behavior from the predictors with interaction or without interaction considering.
2) Cut-In Trajectory Prediction
Fig. 8 presents the trajectory prediction results in the right and left cut-in scenarios. In the right cut-in case, the CV drives in the leftmost lane with a high speed of 38 m/s and intends to change the lane. The distance from CV to LV decreases because the CV has a larger speed during cut-in,and the CV is forced to slow down and keep a safe distance. It is observed from the predicted speed profile that the IA-GMM captures the interaction deceleration behavior better than the GMM because the interactive information of the leading vehicle is considered. Moreover, the CV drives much faster than HV, and the distance between them is gradually increasing.Thus, the cut-in maneuver can be executed and it is predicted by both the IA-GMM and GMM, but the future heading angle and trajectory generated by the IA-GMM predictor are closer to the ground truth. In terms of the CTRA, it fails to estimate the cut-in trajectory when the prediction horizon is over 2 s.
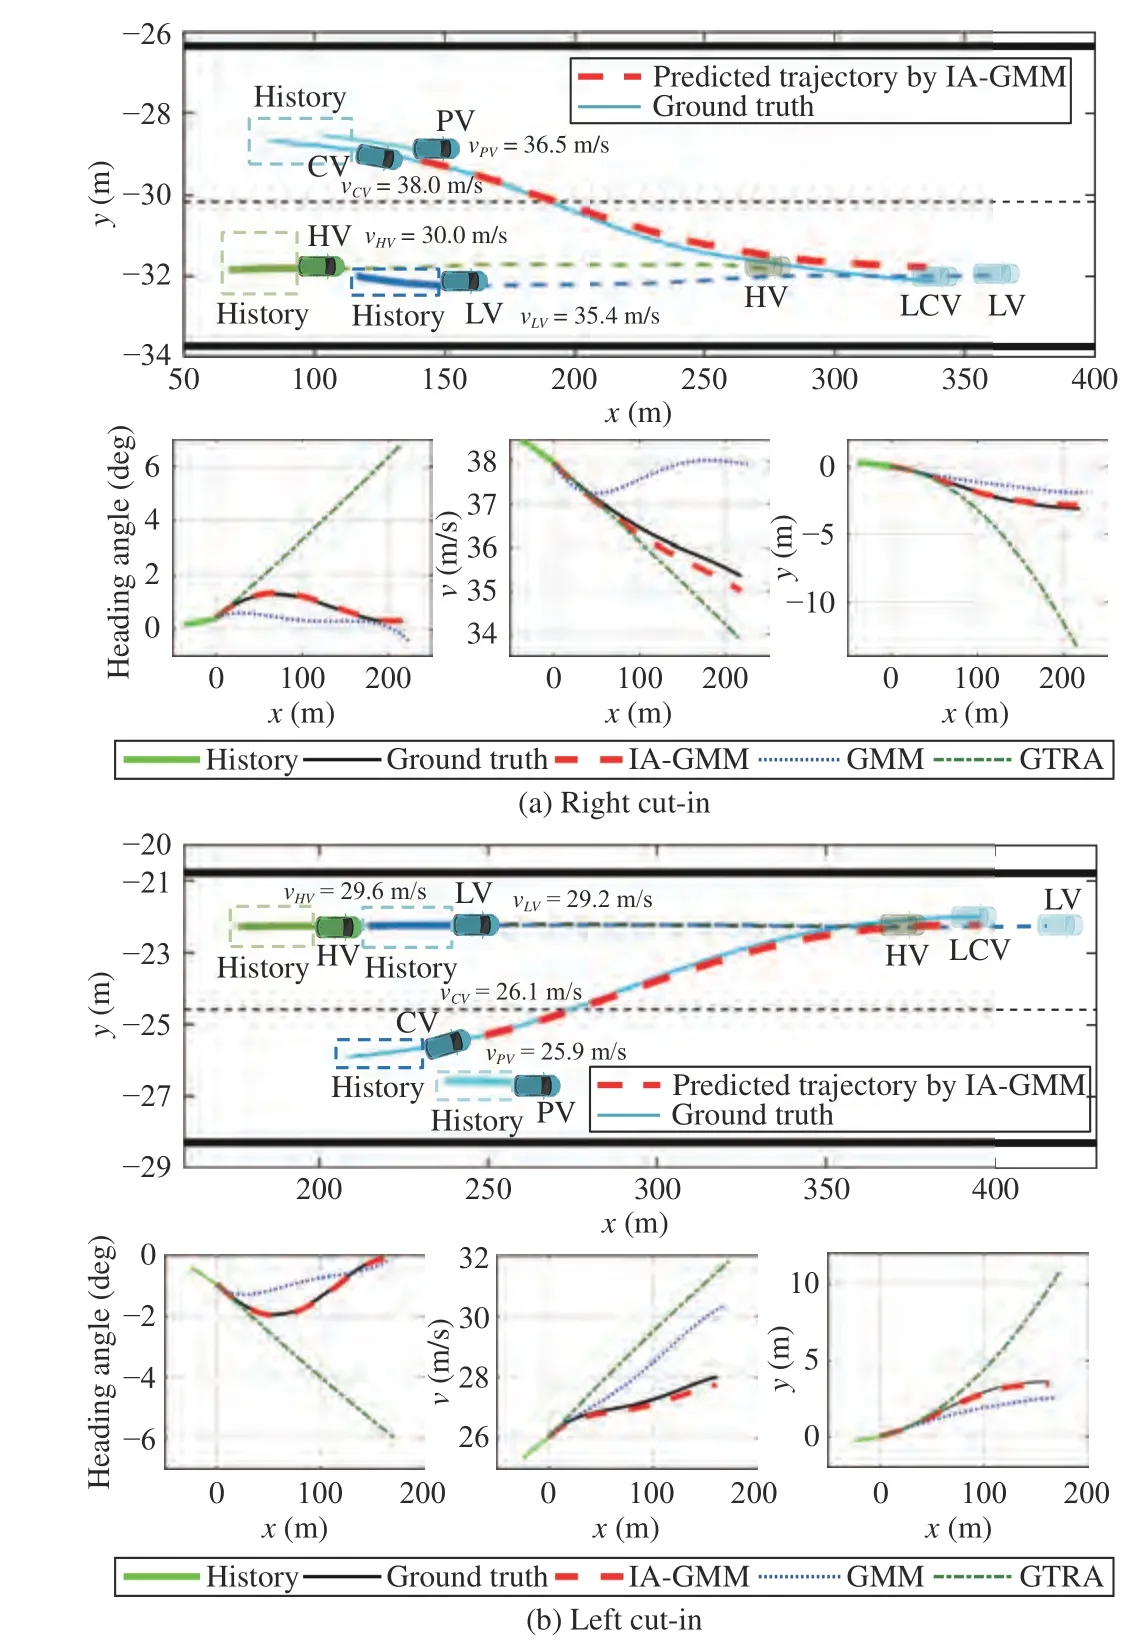
Fig. 8. Trajectory prediction results of two cut-in scenarios, (a) right cut-in;(b) left-cut in. In each scenario, the top figure presents the driving environments, the bottom three figures are predicted heading angle, longitudinal velocity and trajectory from the three predictors, respectively.
In the left cut-in case, the CV drives in the right lane and generates the lane-change intention due to a slower preceding vehicle. Speeding up is required for CV to execute the cut-in maneuver because its driving speed is less than the HV and LV in the target lane. However, the drivable space between CV and LV is short at the beginning of the cut-in, which limits the feasible driving speed of the CV. The IA-GMM can model this accelerating behavior among the four vehicles with the interaction features considered. Subsequently, the velocity and path profiles of the cut-in vehicle are accurately predicted.In contrast, the GMM based predictor generates higher future acceleration because it is large in the past 1 s. The CTRA predicts a linear increasing trend for both heading angle and driving speed. Consequently, two baseline predictors produce future motion trajectories with relatively larger error.
Furthermore, the root mean square error (RMSE) is selected for the longitudinal, lateral, and Euclidean distance within prediction horizons to evaluate the prediction performances of the proposed model and two baseline methods.

The prediction performances of the test data are shown in Fig. 9. The error increases sharply with the increase of the prediction horizon for all three models. However, the proposed IA-GMM has a smaller error on threeRMSEindicators,because the interaction-aware features are included and the cut-in behavior of CV is pre-estimated through SVM. The GMM based predictor cannot accurately capture the accelerating or decelerating behavior, which results in a larger error compared with the IA-GMM. The prediction model based on the CTRA has a greater lateral error than the longitudinal and Euclidean distance because it fails to predict the cut-in behavior, especially when the prediction horizon is over 3 s. It is shown that an unstable prediction appears without the interaction features because the driver may change his behavior when the surrounding vehicles’ states change.
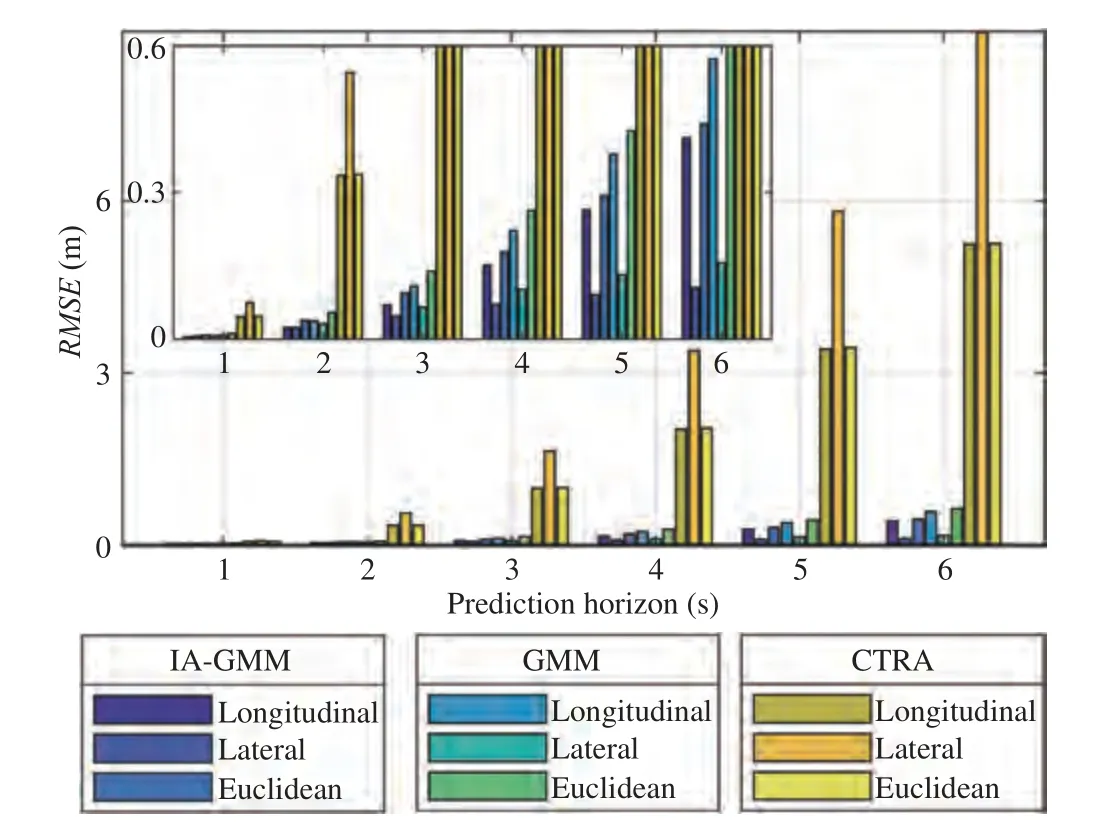
Fig. 9. Prediction performances of three prediction models.
As a whole, the proposed IA-GMM has excellent prediction performances in terms of the heading angle and speed because the interaction-aware behavior features are considered. Therefore, the position predicted by the IA-GMM is closer to the ground truth, compared with the other two methods. The GMM without the interaction features considered shows good prediction performances in the heading angle, but it has inferior results in speed. The CTRA shows the worst prediction performances due to the assumption of the constant acceleration and turn rate. Therefore, the conclusion can be obtained based on the above discussion that the interaction features are essential for improving the prediction accuracy.
C. Driving Risk Analysis
The risk for HV is analyzed based on the predicted trajectory in this subsection when the CV executes the cut-in maneuver. Three typical scenarios are extracted from the naturalistic cut-in data, in which two of them have high a potential collision possibility between HV and CV, and the other one is a relatively safe cut-in. Considering the differences in the variation range ofMTTCandMTHW, the normalization of these two risk measurements is conducted usingSigmoidfunction. Then two points of (0, 0.99) and (1, 0.6) are adopted for theMTHW, and (0, 0.99) and (5, 0.8) are applied for theMTTC.
The risk assessment results based on the human driving data are shown in Fig. 10, and the predicted maximum risk is presented in Table II. In Scenario (a), the velocity of CV is always larger than that of HV during cut-in so that the normalizedMTTCis close to zero, which indicates that there is no possible collision. However, this situation is dangerous from theMTHWindex with a maximum value of 0.9 because the distance between them is 2.24 m when starting the cut-in, and it increases to 11.14 m in the ending. It is concluded that the proposedCRIgives a compromisingly high risk level, which is more suitable for evaluating this traffic scene.
The risk levels are high for bothMTTCandMTHWin Scenario (b) as the velocity of HV is greater than that of CV in the whole cut-in duration. The distance between the two vehicles decreases from 27.7 m to 9.44 m, which results in the large variation range ofMTHW. All three risk indexes show a high value in the second half of cut-in, which means the rearend collision between HV and CV may occur with high probability. In Scenario (c), the distance between the two vehicles is around 35 m during cut-in, and their velocities are close.Therefore, all three risk indexes indicate a relatively safe cutin. It can be summarized from three scenarios that the proposed comprehensive risk index is better than a single risk measurement. Moreover, it has a better generality for the collision pre-warning in various traffic environments, especially for the cut-in scenario in the mixed traffic.
Furthermore, it can be seen from Table II that the predicted maximumMTTChas a great error compared with the ground truth because the predicted relative velocity varies in a large range, and may be positive or negative in the prediction horizon. The error ofMTHWis small because it depends on the estimated distance which has a small variation scope. Similarly, the prediction error ofCRInarrows down after the normalization and integration ofMTTCandMTHW. Moreover,the unstable speed predictions in the long horizon of the GMM based predictor lead to great errors inMTTCandMTHW. It is demonstrated that the singleMTTCorMTHWis insufficient to assess the future driving risk in the mixed traffic on account of the shortcoming of risk measurement and the error of trajectory prediction. The proposed IA-GMM andCRIcan generate more accurate evaluations of the risk level compared with other prediction models because the predictor with interaction features considered has a small speed error.
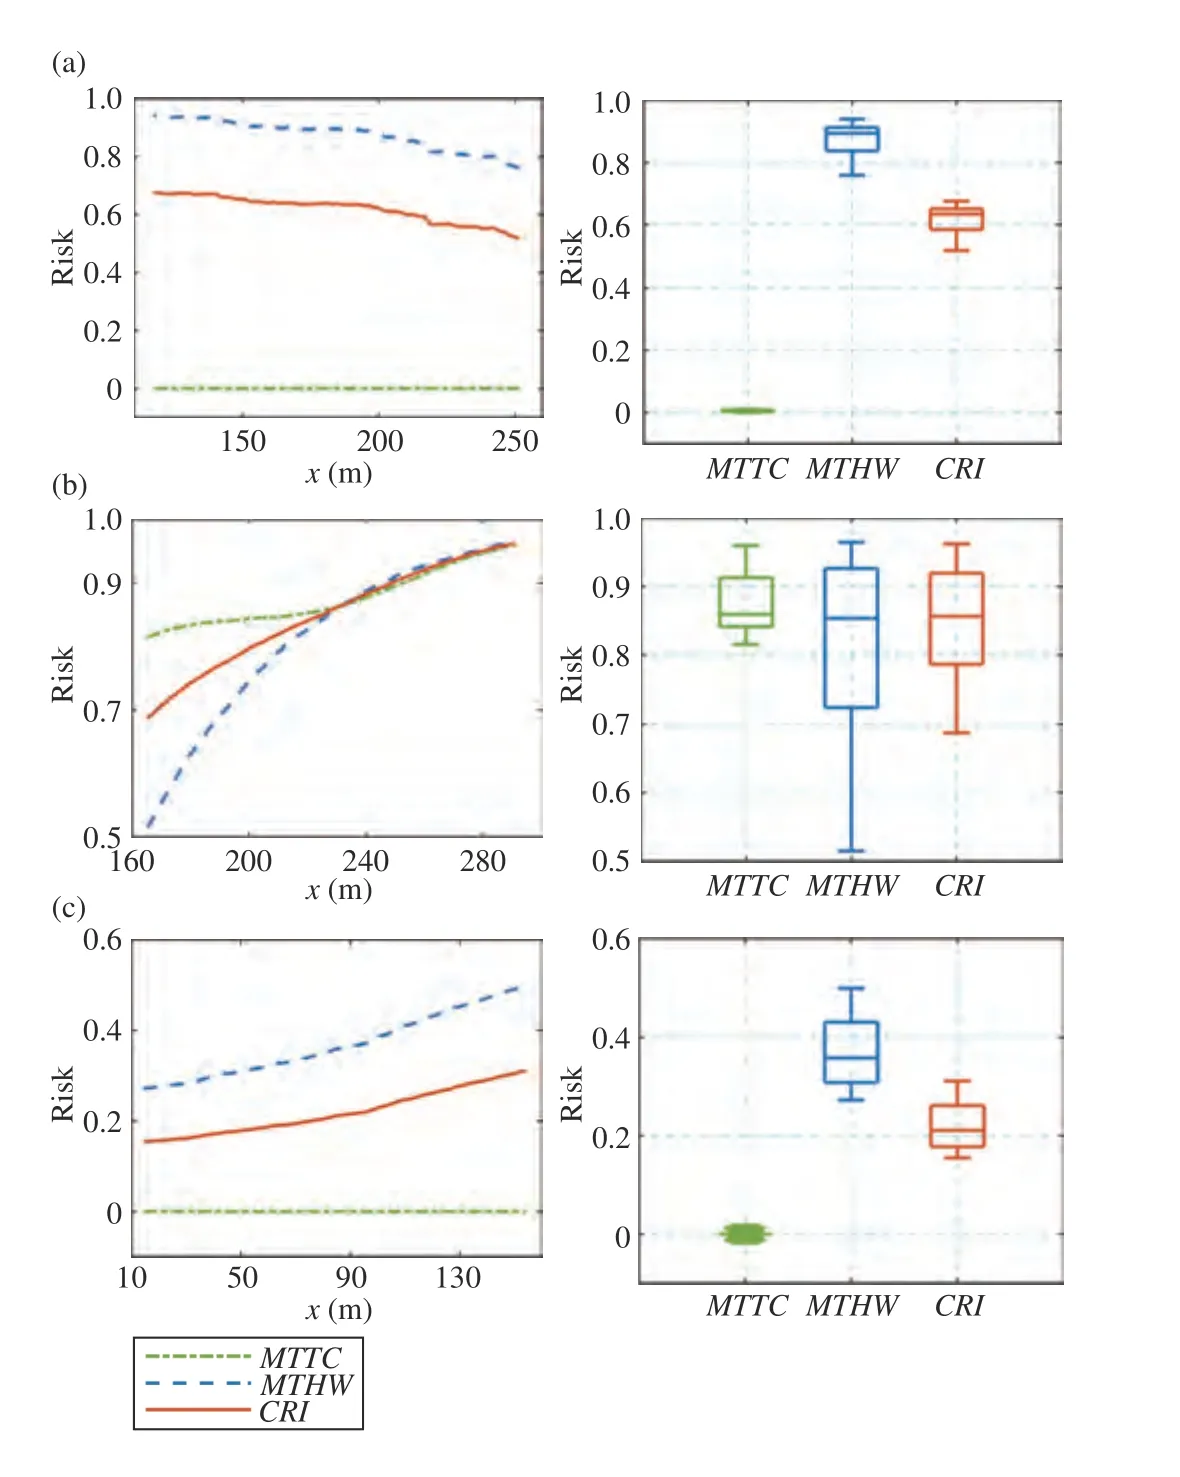
Fig. 10. Risk assessment results in three cut-in cases, (a), (b) and (c), both the MTTC and MTHW denote the value after normalization.
V. CONCLUSION
This study proposed an interaction-aware cut-in prediction and risk assessment framework to improve the accuracy of trajectory prediction and risk estimation in the mixed traffic.A hierarchical motion prediction model was proposed. The interactive cut-in behavior prediction in the upper layer was designed based on the SVM. The lower layer developed the IA-GMM predictor to predict the trajectories with the interaction features considered. With the HV trajectory estimated by the response-based intelligent driver model, two metrics were integrated into theCRIthroughSigmoidfunction andSoftmaxfunction, which was utilized to evaluate the performances of the proposed model compared with the human driving data.
The simulation results show that the IA-GMM predicts the future motion trajectories of the cut-in vehicle that are closer to the ground truth in the naturalistic driving data, compared with the GMM-based predictor and CTRA model. Moreover,the risk assessment validations show that the proposed IAGMM andCRIcan evaluate the risk level of the cut-in maneuver in mixed traffic more accurately.
However, the validation of motion prediction and risk assessment in this study is carried on based on driving data.Thus, further studies using driving simulators or real experiments will be considered in future work. Additionally, the cutin intention of the predicted object may also be induced by other factors, such as the traffic rules and the driving behaviorof the vehicles on the other lane. Therefore, these factors will be introduced in future work to improve the prediction performance further.

TABLE II PREDICTED MAxIMUM RISK DURING CUT-IN
杂志排行
IEEE/CAA Journal of Automatica Sinica的其它文章
- Distributed Cooperative Learning for Discrete-Time Strict-Feedback Multi Agent Systems Over Directed Graphs
- An Adaptive Padding Correlation Filter With Group Feature Fusion for Robust Visual Tracking
- Designing Discrete Predictor-Based Controllers for Networked Control Systems with Time-varying Delays: Application to A Visual Servo Inverted Pendulum System
- A New Noise-Tolerant Dual-Neural-Network Scheme for Robust Kinematic Control of Robotic Arms With Unknown Models
- A Fully Distributed Hybrid Control Framework For Non-Differentiable Multi-Agent Optimization
- Integrating Conjugate Gradients Into Evolutionary Algorithms for Large-Scale Continuous Multi-Objective Optimization
