Corrosion and wear resistance of coatings produced on AZ31 Mg alloy by plasma electrolytic oxidation in silicate-based K2TiF6 containing solution: Effect of waveform
2022-10-24MrymRhmtiKeyvnReissiMohmmdRezToroghinejdAminHkimizdMoniSntmri
Mrym Rhmti ,Keyvn Reissi ,Mohmmd Rez Toroghinejd ,Amin Hkimizd ,Moni Sntmri
a Department of Materials Engineering,Isfahan University of Technology,Isfahan 84156-83111,Iran
b Yekta Mobaddel Pars Co.,Science and Technology Campus,Yazd University,Yazd 89158-18411,Iran
c Dipartimento di Ingegneria,Università di Palermo,Viale Delle Scienze,Ed.6,90128,Palermo,Italy
Abstract In this research,plasma electrolytic oxidation coatings were prepared on AZ31 Mg alloy in a silicate-based solution containing K2TiF6 using bipolar and soft sparking waveforms with 10,20,and 30% cathodic duty cycles.The coatings displayed a net-like surface morphology consisted of irregular micro-pores,micro-cracks,fused oxide particles,and a sintered structure.Due to the incorporation of TiO2 colloidal particles and the cathodic pulse repair effect,most of the micro-pores were sealed.Long-term corrosion performance of the coatings was investigated using electrochemical impedance spectroscopy during immersion in 3.5 wt.% NaCl solution up to 14 days.The coating grown by the soft sparking waveform with a 20% cathodic duty cycle having the lowest porosity (6.2%) and a sharp layer concentrated in F element at the substrate/coating interface shows the highest corrosion resistance.The friction coefficient of this coating has remained stable during the sliding even under 5 N normal load,showing relatively higher wear resistance than other coatings.The coating produced using the equivalent unipolar waveform,as the reference specimen,showed the highest friction coefficient and the lowest wear resistance despite its highest micro-hardness.
Keywords: Plasma electrolytic oxidation;Pulsed waveforms;AZ31 Mg alloy;Dipotassium titanium hexafluoride;Corrosion resistance;Wear resistance.
1.Introduction
To meet the requirements of lower fuel consumption and less environmental pollution,the demand for light alloys in high-performance weight-sensitive applications such as the automotive and aerospace industry is increasing [1].Magnesium alloys show relatively low density,high strength-toweight ratio,good cast-ability,good weld-ability,and high damping capacity compared to other structural metals [2].However,the weak corrosion and wear resistance as well as the low hardness of magnesium alloys significantly limit their applications [3].The urgent need to overcome these problems has boosted the development of novel treatments capable of improving the long-term corrosion performance and wear resistance of such advanced alloys [1].Plasma electrolytic oxidation (PEO) is considered one of the most promising surface modification techniques for light alloys [1].Although there are some other engineering techniques for Al and Ti alloys,it is worth mentioning that PEO is the only field applicable choice for Al alloys with copper as the primary alloying and Mg alloys[4].PEO process is environmentally friendly(in alkaline solutions not acidic or containing hexavalent chromium ions),providing thick (up to 200 μm),uniform coverage of complex shapes,and very adhesive coatings.The PEO coatings normally contain two distinctive layers,i.e.a more compact inner barrier layer and a porous (usually thicker) outer layer,generated by intensive micro-discharge,gas evaluation,and entrapping[5,6].The higher thickness of the porous outer layer has limited the use of PEO in many industrial applications.There are several known ways to limit and reduce the thickness of this layer,such as optimizing electrical parameters and the composition of the electrolytic solution.Reducing anodic to cathodic charge ratio (C.R.<1) or incrementing duty cycle decreases the number of strong micro-discharges and thus increases the thickness of the more compact inner layer.Therefore,it is very promising to carry out a PEO process under a so-called “soft sparking” regime,which is often observed using a bipolar waveform with a higher cathodic to anodic current ratio [6].On the other hand,the composition of the electrolyte and additives significantly affect the composition and microstructure of PEO coatings leading to modifying their properties [7].Also,PEO coatings could be a basis for the formation of composite coatings,for example,by applying various substances and additives to a rough oxide surface and embedding them into the pores of the outer layer[4,8].Compounds containing fluorine such as KF [9],K2TiF6[10],and K2ZrF6[11] are considered the most useful additives to form thick and dense coatings on Mg alloys with high hardness,corrosion,and wear resistance.Previous studies on PEO in phosphate and silicate-based electrolyte using DC or unipolar waveform revealed that the formation of the MgF2phase at the coating/substrate interface is promoted by the addition of K2TiF6in the electrolyte,with the consequently improved corrosion resistance of the coatings [12–14].On the other hand,it is also known that the incorporation of TiO2particles modified the corrosion properties of coatings [15].Also,the incorporation of TiO2particles into PEO coatings allows the formation of solid ceramic-like coatings with high micro-hardness and wear-proof functions [16].
It was reported that many parameters affect the uptake process of particle and ionic additives.The most important ones are the electrolyte composition and electrical parameters [7].For the current mode effect,Matykina et al.[17]have reported that the use of the “soft sparking” regime limits inward mass transfer of zirconia particles in the PEO process of Al alloys.Heydarian et al.[18] revealed that MgF2content is raised in both coating/substrate interface and outer layer of the coating produced on AZ91 Mg alloy when a bipolar waveform with a high cathodic duty cycle is applied.The current mode determines the type of micro-discharges that occur during the PEO.The contributions of substrate and electrolyte elements are determined by deep (B-type) and surface (A and C-type)micro-discharges,respectively [19].Thus,it is important to study the effect of the current mode,especially under the soft sparking regime,on the incorporation rate of the electrolyte species.
The present work is focused on studying plasma electrolytic oxidation of AZ31 Mg alloys using bipolar and soft sparking waveforms,with a special interest in the corrosion and wear resistance of the produced coatings.PEO was carried out in silicate solutions containing dipotassium titanium hexafluoride (K2TiF6),in order to assess the effect of fluoride and titanium incorporation on the coatings as a function of the different waveforms.
2.Experimental procedure
2.1.Sample preparation
Disk-shaped samples with dimensions of 16 mm × 3 mm(Ø×H) of AZ31 Mg alloy with the chemical composition(wt.%) of 4.770 Al,0.809 Zn,0.758 Mn,<0.005 Cu,<0.020 Si,and balance Mg was used as the substrate.Both flat sides of the samples were ground down using SiC abrasive papers until obtaining an average roughness (Ra) of 0.08 ±0.01 μm.Then,they washed in deionized water and pure ethanol and finally dried in cold airflow.Each sample connected to a copper wire was used as a working electrode in the PEO process.
2.2.Plasma electrolytic oxidation (PEO) treatment
PEO treatment was carried out in 7 L of a silicate-based electrolyte containing 6 g l-1liquid-glass sodium silicate ((Na2O)x.SiO2,37 wt.%),8 g l-1potassium hydroxide (KOH) and 5 g l-1dipotassium titanium hexafluoride(K2TiF6).The solution has a pH value of 12.33 and conductivity of 15.86 mS cm-1.In similar bath composition,the effect of K2TiF6concentration on morphology,structure,and corrosion resistance of the PEO coatings grown using a unipolar waveform was studied before [20].It was found that the barrier performance of the PEO coatings was improved in the presence of 5 g l-1K2TiF6.To avoid any precipitation,sodium silicate,K2TiF6,and KOH were separately dissolved in deionized water and then mixed [15].The electrochemical cell was made of 316 L stainless steel equipped with a submersible centrifugal electrical pump for stirring.The cell was placed in a water-filled bath in which a chiller controlled the solution temperature.The external cell walls were acted as the counter electrode as well as the heat exchanger for cooling the solution to keep the temperature at 15 ± 1 °C.
A switching power supply capable of delivering independent positive and negative voltages was designed,implemented,and used for this work.It was able to supply 700 V and -300 V for positive and negative voltages respectively,both of them with a maximum average current of 30 A.The independent current measuring systems,based on hall-effect sensors,read the average cathodic and anodic currents with the accuracy of 0.1 A and minimum reading capability of 0.2 A.An H-bridge IGBT-based pulser generated the requested unipolar or bipolar waveforms using the above-mentioned independent converters.
The specimens were coated for 10 min using different waveforms of bipolar (B1) and soft sparking (B2 and B3)at 1 kHz,where anodic (positive) peak potential and cathodic(negative) ones were 440 and 24 V,respectively.During the PEO process,the waveform modes were monitored by a GPS 2024 digital oscilloscope.The recorded waveforms,applied electrical parameters,bath composition,sample codes,and visual appearance of the coatings are displayed in Table 1.

Table 1 Sample codes,waveform shapes,electrical parameters applied for the PEO process,and visual appearances of the resulted coatings in baths containing K2TiF6(with pH and conductivity of the bath).
2.3.Coating characterization
Field emission scanning electron microscopy(FESEM,FEI model Quanta FEG 450) was used to examine the surface and cross-sectional morphology of the coatings.The crosssection of the coatings was ground through successive grades of silicon carbide (SiC) papers (up to 2400 grit) and final polishing using alumina particles (0.5 μm).Afterward,the prepared samples were washed in deionized water and ethanol using an ultrasonic cleaner and finally dried in cold airflow.The chemical composition and elemental maps of the coatings were determined with an energy dispersive spectrometer (EDS,EDAX Octane Elite).The average thickness and porosity percent values were measured on the crosssection of FESEM micrographs using metallurgical image processing (MIP) software.The average surface roughness and topography of the PEO coatings were determined using a profilometer (LPM-01).The phase composition of the coatings was evaluated by grazing incident beam X-ray diffraction (GIXRD,model ASENWARE AW-XDM300).The XRD patterns were obtained over 2θrange of 20–80° with a step size of 0.05° and time per step of 3 s with an incident beam angle of 5° using Cu Kα(40 kV,30 mA,andλ=0.15,406 nm).PDF2 (Powder Diffraction File for inorganic materials) database was employed to analyze the XRD patterns.
2.4.Evaluation of the coatings corrosion behavior
The electrochemical behavior of the PEO-coated specimens was evaluated using electrochemical impedance spectroscopy (EIS) after long-term immersion in 3.5 wt.% NaCl(pH 6.5 ± 0.1) by an AMETEK potentiostat/galvanostat(model PARSTAT 2273).The corrosion tests were carried out in a three-electrode cell,where one face of the coated samples with 1.33 cm2,as the working electrode,was exposed to the aggressive solution.A platinum plate and a saturated Ag/AgCl were used as the counter and reference electrode,respectively.EIS measurements were carried out at a frequency range from 100 kHz to 100 mHz,and ±10 mV peak-to-peak voltage amplitude versus open circuit potential (OCP).The EIS data were fitted and analyzed through Z view software.
2.5.Micro-hardness and wear measurement
The average micro-hardness of the coated samples was measured on the cross-section using Knoop indenter,based on ASTM E 384–05A standard,using 0.25 N loads.The wear behavior of the coatings was investigated via a homemade tribometer machine in a reciprocating ball-on-flat.The tests were carried out using 3 and 5 N as normal load using a SiC ball (Ø=5 mm) as a counterpart reciprocated in a 7 mm stroke length at 14 mm/s sliding velocities.The tests were stopped when the total wear distance reached 100 m.After the wear test,the specimens were ultrasonically cleaned in ethanol,followed by drying in cold airflow.The wear tracks samples were characterized using the mentioned FESEM.The volume loss of the samples was calculated based on the geometries of the wear tracks obtained by a profilometer (model Mitutoyo SJ 210).The Coefficient of friction (COF) was recorded using a dynamometer connected to the computer for data acquiring during wear tests.
3.Results and discussion
3.1.Current density-time responses during PEO treatment
Fig.1 shows the responses of anodic and cathodic current density versus time recorded during PEO treatment.During the first 60 s,anodic and cathodic voltages are linearly ramped to their final magnitude of 440 V and -24 V,respectively;while the current densities in each waveform reach their maximum values(see Table 2).According to Fig.1,the maximum values of both anodic and cathodic current densities increase by increasing the cathodic duty cycle.

Table 2 Maximum anodic and cathodic current densities obtained at various waveforms.

Table 3 The average thickness and porosity percent of the coatings obtained by the various waveforms.
According to Fig.1,three consecutive discharge stages can be distinguished in the anodic and cathodic current density.In stage I (in the early stage of the process),the current density increases with a very steep slope,which mainly involves the rapid electrochemical formation of a first insulating oxide film,the occurrence of breakdown voltage,hydrogen evaluation in the pores,and absorption and incorporation of cations[21,22].In stage II,the current density decreases,characterized by numerous fine sparks moving rapidly and uniformly over the entire sample surface.The intensive discharges,as orange glow,are observed in stage III,which are randomly distributed all over the sample surface with slow-moving[23].The strong current density oscillations are attributed to the physical stirring of the solution,breaking of coating,and the non-uniform formation of the coating with a porous surface during the PEO process [24,25].
3.2.Surface morphology and roughness of the coatings
The surface morphology of the coatings in two magnifications is shown in Fig.2.Micro-pores,micro-cracks,and fused oxide particles are observed on the surface of all coatings.The micro-pores and granules of oxide compounds are usually originated from random discharge channels,gas entrapping,and ejected materials,respectively [26].The micro-pores are irregular-shaped pores from different sizes resulted by discharging and sudden film breakdown [27].The micro-pores consist of three types: open mouth,semi-sealed,and fully sealed,as seen in Fig.3 in higher magnification.The cathodic half-period applies a negative charge to the oxide;therefore,the system conductivity increases,and hence the barrier (dielectric breakdown) potential is reduced.On the other hand,the coating attracts cations such as H+.Then,hydrogen evolution facilitates the transfer of electrons through the oxide layer and increases the pH near the sample surface due to the local alkalization [22],which encourages the formation of magnesium hydroxide complexes.The hydrogen trapped in discharge channels increases the plasma temperature and facilitates the transformation of magnesium hydroxide complexes to hydroxide and oxide at these locations.This repairs the defects and seals the micro-pores effectively during the PEO process.
The micro-cracks are considered to be footprints of the rapid solidification and the difference between thermal coefficients of coating and substrate [19,28].This surface morphology is similar to a net-like and/or scaffold that is commonly formed on the coatings produced on Mg alloys in a silicatebased solution and also appeared as a sintered structure in the coatings [23,29].
The 3D profiles and roughness (Ra) of the coatings are presented in Fig.4.There is no significant difference between the roughness values of bipolar (B1) and soft-sparking (B2 and B3) waveforms.The coatings display structures with low roughness and high uniformity.Nevertheless,the B2 coating has the lowest roughness,which causes a slight change in morphology [22,30].

Fig.1.The responses of anodic (a) and cathodic (b) current density versus time during PEO treatment.

Fig.2.Surface morphology of the coatings produced using various waveform: (a) B1,(b) B2,and (c) B3.
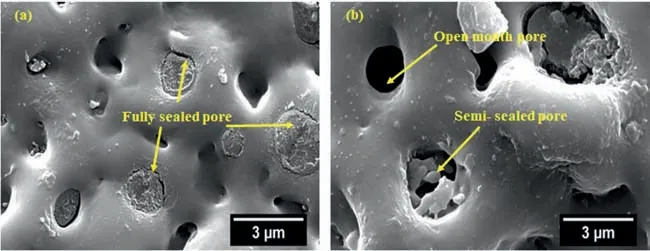
Fig.3.Surface morphology of the coating produced using B2 waveform at various time coating: (a) 60 s and (b) 150 s.
3.3.Cross-section,structure,and chemical composition of the coatings
Fig.5 shows the cross-sectional images of the coatings in two different magnifications.The substrate/coating interfaces have a wavy-jagged appearance,which makes them an integral part of the substrate as the result of substrate dissolution in the early stage of the PEO process [31].The non-uniform distribution of discharges can explain the variation in coating thickness,due to the continually local thickening of the coating,followed by breakdown events[2].The cross-sections clearly show that the coatings are composed of two distinct layers,a porous outer layer grown by the continuous discharge process and a more compact inner layer [32].Also,there is evidence of micro-pores and micro-cracks caused by various discharge types and thermal stresses [33].According to the growth model proposed by Cheng et.al.[32],five types of discharges could occur during sparking in the PEO process: Btype which occurs at the substrate/coating interface and forms deep channels connected to the substrate,A-type discharging originating in the upper side of coating at oxide/electrolyte interface or adhered gas bubbles attached to the coating surface,discharge type C which happens at oxide/electrolyte interface within pores and cracks of the coating,discharge type D that occurs inside the large pores at the inner/outer oxide layer interface,and finally,E-type which forms deep channels connected near to inner/outer oxide layer interface.As seen Fig.5,the most frequent discharge types are A,C,and D and the least frequent is E-type.Here,there are not deep pores elongated from the coating surface to the substrate,which means no intensive discharges (i.e.,B-type) happened.

Fig.4.3D surface profiles and Ra values of the coatings obtained by different waveforms: (a) B1,(b) B2,and (c) B3.

Fig.5.Cross-sections of the coatings produced using different waveforms: (a) B1,(b) B2,and (c) B3.The images inserted below of each cross-section demonstrate the porosity percentage using MIP software.
The porosity percent and average thickness values of the PEO coatings at 60 s (stage I),150 s (stage II),and 600 s(stage III),estimated from FESEM cross-sectional images using MIP software (Fig.5),are listed in Table 3.The low porosity percentages are obtained for all coatings due to the elimination of strong discharges and increment of A-type discharge [6,28].Also,the repairing defects and sealing pores happen in the cathodic half-periods help the coating to become less porous.According to Table 3,after 60 s of PEO processing,the average thickness of the coatings formed using the bipolar waveform (B1) is higher than that of the soft sparking ones (B2 and B3).In stage I,the largest contribution of the coating growth is related to anodizing and micro-arc oxidation across the oxide film.For the B1 specimen,the condition supports more powerful sparks,due to the smaller cathode pulse width,thus the rate of coating growth is higher than B2 and B3 coatings.However,in stage II,the coating growth rate raises which subsequently decreases the current density.With further increasing the processing time,the average thickness values increase for B2 and B3 coatings.With increasing the cathodic duty cycle,the incrementing thickness is not linear and the rate of this increase decreases at higher cathodic duty cycles.This can be attributed to the lower incorporation of some electrolyte constituents (anions) into the coatings by increasing the cathodic width [34].
Fig.6 shows the distribution maps of elements in the coating cross-sections.The occurrence of A and C-type discharges allows entering the relatively large amounts of solution components in the coating [33].Si and Ti elements from the solution are distributed almost uniformly across the coatings.However,the fluoride element is detected more intensively at the substrate/coating interface for all coatings,although it is lower for B1 coating.This accumulation at the metal/oxide interface leads to the formation of the MgF2phase (Fig.6)and is due to the faster migration rate of F-ions with respect to O2-/OH-ions [35,36].
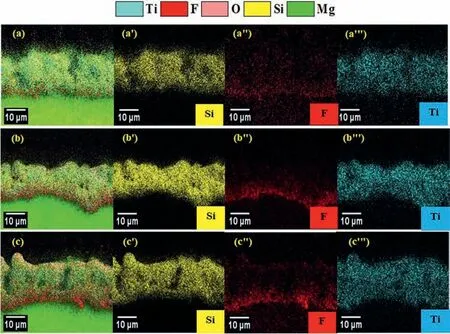
Fig.6.Elemental maps on cross-sections of the coatings consisting of Si,F and,Ti elements,as marked by yellow,red,and blue colors,respectively: (a,a’,a’’,a’’’) B1,(b,b’,b’’,b’’’) B2,(c,c’,c’’,c’’’) B3.
The incorporation of Ti occurs through the physical entrance of TiO2colloidal particles into the discharge channels [14].As reported in a previous paper [41],dipotassium hexa fluorotitanate added in the solution dissociates to K+and [TiF6]2-ions.At pH ≥6,[TiF6]2-ions naturally hydrolyzed with consequent formation of TiO2colloidal particles and fluoride ions.At the pH values higher than the point of zero charges (PZC=5.7),the surface of TiO2colloidal particles has a net negative charge reducing the adsorption of fluoride ions in competition with the hydroxyl groups on the sorbent active sites [37].As a result,the incorporation of TiO2particles reduced the content of F ions in the coating.The incorporated TiO2colloidal particles can be absorbed and accumulated as amorphous and crystalline TiO2particles in the vicinity and inside the micro-pores and make the pores semi-sealed,as seen in Fig.3b.TiO2colloidal particles can be up-taken during positive half cycles by electrostatic adsorption due to their net negative charge and sticking on the melting pools generated by the discharging and the erupted oxide from sparks.TiO2particles inertly incorporate into the coating due to their high chemical stability [38,39].On the other hand,the lower melting point of TiO2(1836°C) compared to other compounds (MgO (2852°C),Mg2SiO4(1910°C),and MgF2(1890°C)) facilitates the sintering process in the microdischarge [10].The incorporated TiO2colloidal particles can be accumulated as amorphous and crystalline TiO2particles in the vicinity and inside the micro-pores and make the pores semi-sealed,as seen in Fig.3b.
The atomic percentage (at.%) of Si,Ti,and F elements was obtained using EDS analysis from the cross-section of the coatings near the top surface.The Si content was almost the same (~13.0–14.1%) for all coatings.In addition,Ti and F concentrations do not change significantly with the waveforms(~2.7–3.3% for Ti and~2.1–3.6% for F).
3.4.The phase composition of the coatings
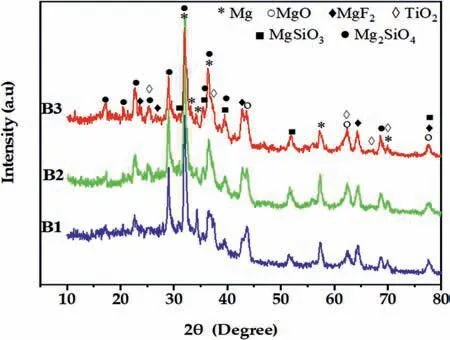
Fig.7.XRD patterns of the coatings grown using the various waveforms.
Fig.7 shows GIXRD results of the coatings grown in a solution containing K2TiF6using the various waveforms.The coatings obtained are mainly composed of periclase (MgOICDD PDF no.87–0653),forsterite (Mg2SiO4-ICDD PDF no.01–1290),enstatite (MgSiO3-ICDD PDF no.01-0773),sellaite (MgF2-ICDD PDF no.41–1443) and anatase (TiO2-ICDD PDF no.21–1272) phases.According to the XRD and EDS analysis,the possible reactions that occur during the PEO process in the silicate electrolytes to produce the abovementioned phases are [40–42]:
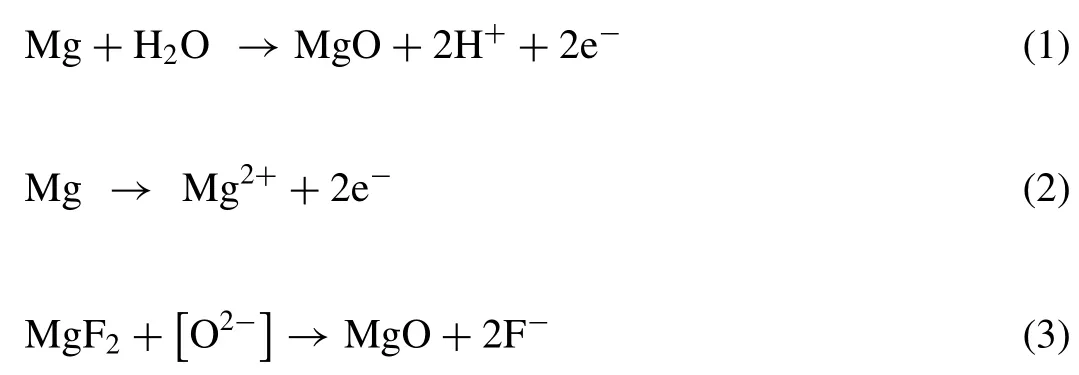

While reactions 2–4 occur during the breakdown,reaction 1 is running before that.
The high temperatures and pressures governed during the PEO process cause the following reactions:
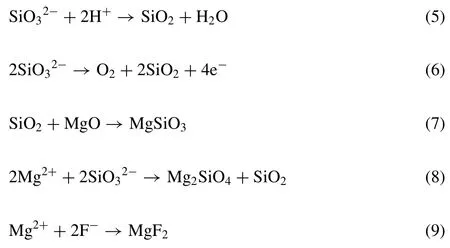
The peak intensities of TiO2are the same for all specimens,indicating that the type of applied waveforms does not affect the amount of TiO2incorporated significantly.Reflections relating to Mg substrate (ICDD PDF no.01–1141) are also evident,but their intensity decreases by increasing coatings thickness and by decreasing porosity.The patterns show a halo in the 2θrange of 20–40°,indicating the presence of an amorphous phase,which should be SiO2and/or TiO2[43,44].Indeed,the presence of K2TiF6in the solution promotes the incorporation of titanium oxide as crystalline and amorphous phases [44].
3.5.Long-term electrochemical impedance spectroscopy(EIS) measurements
To evaluate the long-term corrosion performance of the coatings,EIS spectra of the specimens immersed in 3.5 wt.%NaCl solution (pH 6.5 ± 0.1) for 1,4,7,and 14 days are obtained.The recorded Nyquist and Bode plots are shown in Fig.8.After 1 day of immersion,two humps are clearly evident in Bode-phase plots (Fig.8a’),indicating a two-time constant response and confirming the dual-layer structure of the coatings [36].The humps at low frequencies are relating to the more compact inner layer of the coatings and those at high frequencies are resulting from the outer porous layer.Correspondingly,in the Nyquist diagrams (Fig.8a),large capacitive loops indicate that the coatings have barrier properties toward the aggressive environment.With increasing the immersion time to 4 days,the humps are merged as seen in Fig.8b’.After 7 days of immersion,the high-frequency response disappears for the B1 coating,indicating that the porous layer of this coating has dismissed its action.Also,the inner layer has shown a weak performance against corrosive solution due to the lower fluoride content in substrate/coating interface than other coatings (Fig.6).For this coating,at the low frequencies,an inductive loop also appears indicating that the aggressive solution comes in direct contact with the substrate in some areas.Indeed,the inductive behavior can be explained by H2evolution on these uncoated Mg surfaces,thus suggesting that a part of the substrate is no longer protected by the coating [45,46].
These experimental findings agree with the higher thickness of B2 and B3 coatings (see Table 3).In these coatings,the outer layer is sealed by TiO2particles,which effectively slowdowns the diffusion of the aggressive solution toward the metal coating/interface.After 14 days,each Bode-phase plot shows one hump indicating that just the inner layer is responding,while the inductive loops prove that uncoated Mg areas are present for all the samples.
The best appropriate equivalent electrical circuits(ECs)for fitting the EIS data are presented in Fig.9.In these ECs,Rs,Rout,and Rincorrespond to the resistance of solution,outer layer,and the inner layer of the coatings,respectively.CPEoutand CPEinrepresent the constant phase elements introduced to model the non-ideal capacitance of the outer and inner layers,respectively.Inductor L and RLare also used to describe inductive behavior (where present).The bold lines in Fig.8 represent the fitting curves,and the best-fitting parameters(χ2<0.003)are summarized in Table 4.The data for the coating produced in a similar bath condition using the equivalent unipolar waveform (anodic peak potential of 440 V and 10% duty cycle) [20] are also added in Table 4 for comparison.
According to the fitting data (Table 4),after 1 day,the Routvalues are high due to the sealing effect of TiO2particles in the outer layers of the coatings [20,47].The Routincreases by raising the cathodic duty cycle.After 4 days of immersion,both Rinand Routvalues of the coatings fall(Table 4).The decay in Rinand Routis due to the uptaking of the corrosive solution via open pores of the outer layer and its direct contact with the inner layer of the coating.When it reaches the coating/substrate interface by prolonging the immersion times,the coating may not have the ability to protect the substrate anymore,and the inductive loop appears.Fig.10 shows the variation of Rinvalues of the coatings by passing the time.As seen,although B3 coating shows the highest Rinvalue at the earlier time of immersion (1 day),the Rinof B2 coating remains the highest after 7 and 14 days of immersion (Table 4).Thus,the coating with the highest corrosion resistance is B2.The coating produced using the unipolar waveform (U) shows the lowest Rinand Routvalues during the full immersion period.Although this coating has a high thickness (~20 μm),but its high porosity percent (~13%) reduces its outer layer resistance [14].In addition,the occurrence of strong discharges (B-type) during the growth of this coating can degrade its inner layer.This indicates that the applying of soft sparking waveform for PEO treatment of AZ31 Mg alloy in the presence of K2TiF6is beneficial to improve the barrier performance of the coating.In our previous work[29],the effect of the waveforms was investigated in the additive-free solution.It was found that the coatings produced using the soft-sparking B2 waveform revealed the highest Rinvalue[29].If the results of the present work compare with ref.[29],it is found that for the coatings produced in the K2TiF6-containing solution,only B2 coating shows a higher Rinvalue than the corresponding coating grown in the additive-free solution.However,with increasing the immersion time up to 7 days,all the coatings produced in the K2TiF6-containing solution showed higher Rinvalues than the coatings that are correspondingly formed in the additive-free solution.In addition,the outer layers of these coatings were improved effectively by the incorporation of TiO2particles,displaying the higher Routvalues.
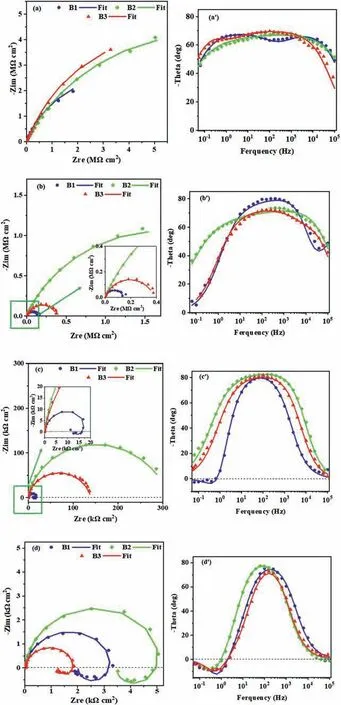
Fig.8.Nyquist and Bode-phase plots of the coated samples in 3.5 wt.% NaCl solution after exposure times of: (a,a’) 1 day,(b,b’) 4 days,(c,c’) 7 days,and (d,d’) 14 days.

Fig.9.The equivalent electrical circuit models used for fitting the EIS data: (a) two-time constant model,and (b) one time-constant along with an inductive element.
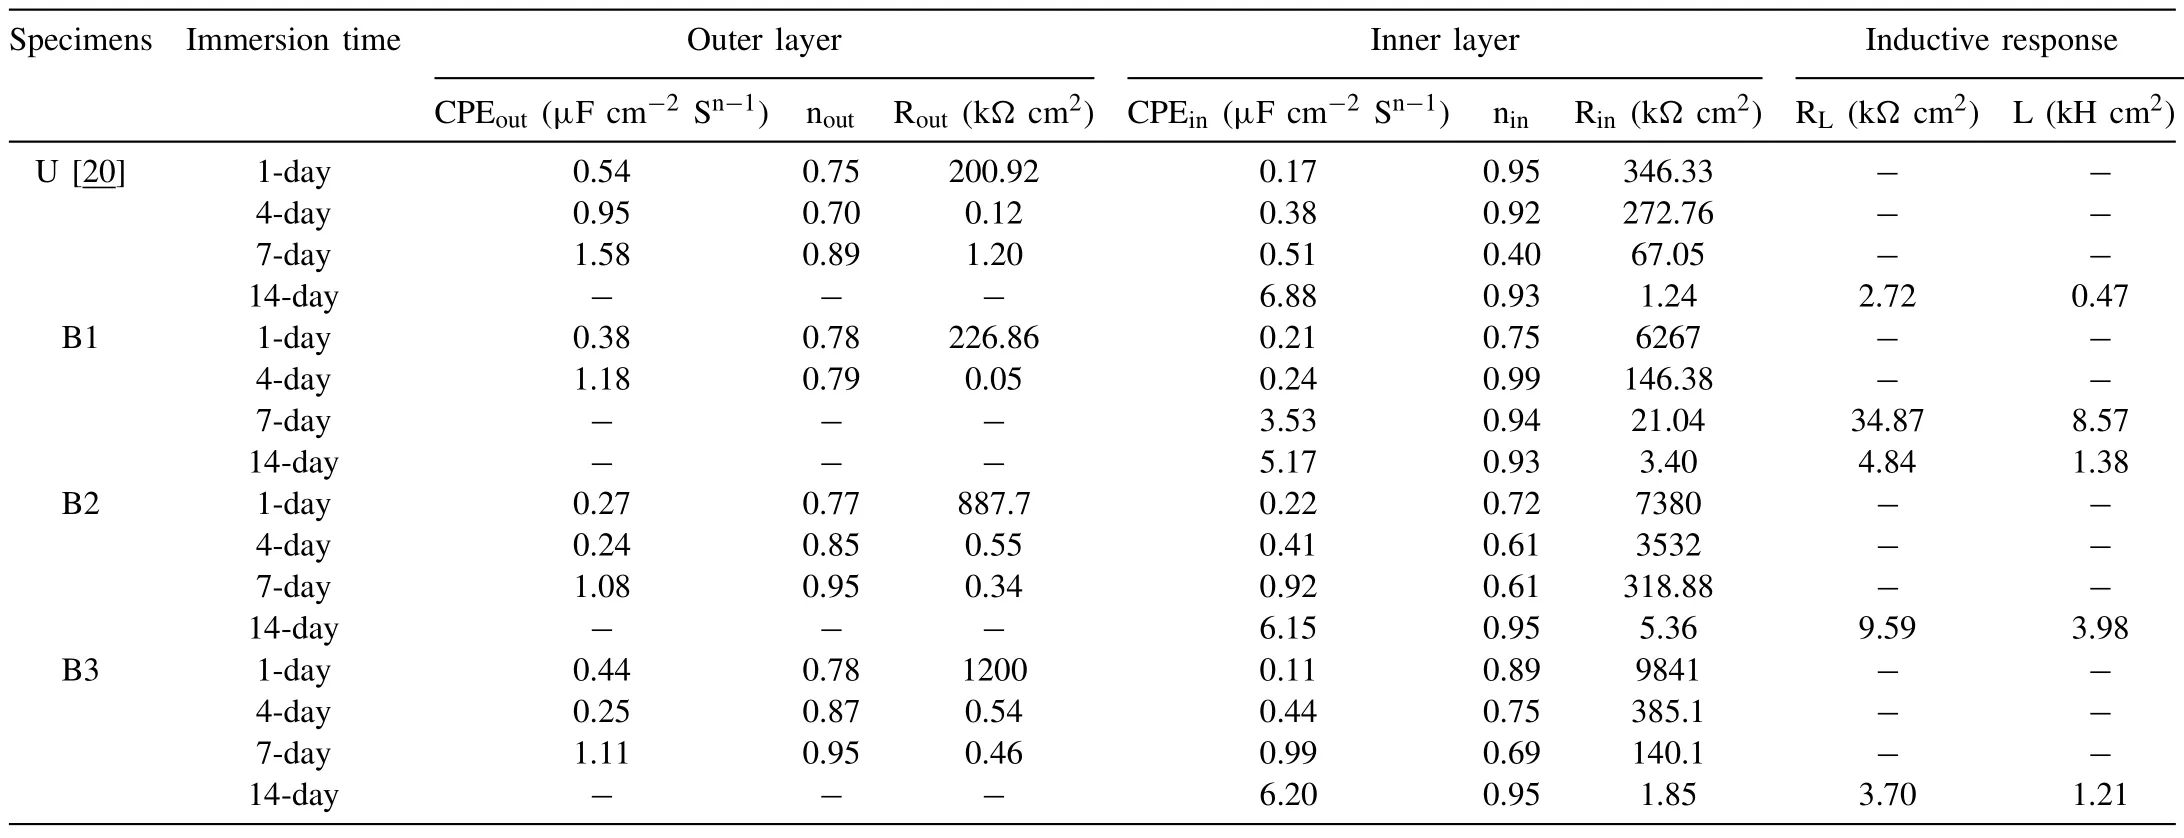
Table 4 Electrical elements values extracted from the EIS diagrams using Zview software for U,B1,B2,and B3 coatings.
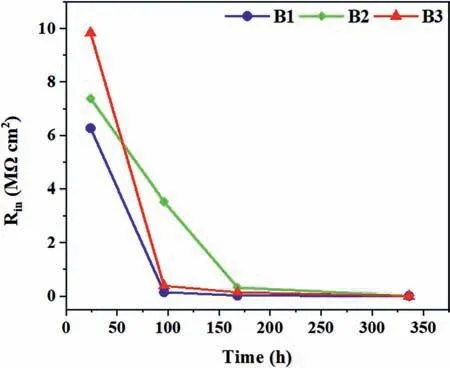
Fig.10.The variation of Rin versus immersion time in 3.5 wt.% NaCl for PEO coatings.
Fig.11 shows the surface morphologies of the coatings after 14 days of immersion in the corrosive solution.All the coatings show holes with different sizes on their surfaces due to localized attacks starting at the weakest parts of the coatings.Less damaged look the samples coated by soft sparking waveforms.According to the obtained results,increasing the cathodic duty cycle up to 20% (B2) has more effectively reduced the corrosion defects.
3.6.Wear resistance of the coatings
The wear resistance of the coated samples is evaluated using pin-on-flat test under dry condition using SiC (Ø=5 mm)ball as a counter body up to 100 m distance.Fig.12 presents the coefficients of friction (COF) versus sliding distance under 3 and 5 N normal loads for the coated samples.

Fig.11.Surface morphology of coated specimens after 14 days of immersion in 3.5 wt.% NaCl solution for: (a) B1,(b) B2,and (c) B3.

Fig.12.The coefficients of friction (COF) versus sliding distance during the wear test of the coatings: (a) under 3 and (b) 5 N normal loads.
The unipolar-coated sample has the highest porosity percent (~13%) and Ra(~2.36 μm),which reduce the contact points between SiC ball and coatings [48].As a result,the low COF at the initial stage is due to the low real contact surface and the smoothness of the ball surface.By reciprocal ball movement,the roughness and wave peaks created on the ball surface are easily penetrated the surface pores of PEO coating [49].In this way,a strong mechanical interlocking has happened between the ball and coatings,which increases the friction coefficient until it reaches its maximum value under 3 N normal load [49].For the unipolar-coated sample,COF is raised gradually up to 0.48,and after a drop,it becomes stabilized in the range of 0.15–0.36.The COF change includes several stages,such as plowing wear,abrasive wear,and adhesive wear [50].The first stage is the contact of the counter body with the outer porous layer and the collision with pores and surface roughness.After polishing and removing the outer layer,the ball encounters the inner layer with higher compactness,hardness,and less roughness.Due to the low thickness of the inner layer (2–3 μm) and the formation of wear debris,COF continues to increase and reaches a maximum value.Then,the coating is broken and strongly damaged,where the substrate has completely evident after~30 m distance,then the substrate is worn until 100 m,and the COF of the substrate is recorded.The fluctuation of COF is caused by the uneven distribution of cracks and pores on the surface of the coatings,especially for the coatings produced using unipolar waveform [49].However,the specimens coated using bipolar and soft sparking waveforms are slightly worn under 3 normal load.
With increasing the normal load to 5 N,B1 and B3 coatings are slightly damaged and broken at some points,leading to increase COF.However,the COF of B2 coating has remained stable during the whole sliding distance,showing relatively higher wear resistance than other coatings[51].Fig.13 show the surface appearance of the wear tracks using FESEM under 3 and 5 N normal loads.The wear tracks are examined using a profilometer,and the important parameters such as depth,width,and worn volume of each scar are calculated and depicted in Table 5.The sample coated using the unipolar waveform shows the highest wear rate under 3 N.As seen in Fig.13a,it shows the highest volume loss,track width,and depth (~23.0 μm) even higher than the coating thickness (~20 μm),where many grooves,and parallel scratches are visible.This indicates that the wear process completely removes the coating.Hereafter,the substrate is worn,and the adhesive wear mechanism is prevailed,confirmed by increasing the fluctuation range of the friction coefficient [52].In this condition,near wear track borders,the coating is broken and deformed by subjecting to shear stress.

Table 5 Wear tracks specifications obtained by analysis of line profiles.
The hardness of the coating might affect the wear resistance,which is controlled by phase composition and porosity levels [19].Fig.14 displays the micro-hardness and the wear rate of the coated specimens under 3 and 5 N normal loads.Although the highest micro-hardness is obtained for the U sample,the higher Raand porosity percent of this coating result in higher wear debris during wear testing.This debris is trapped in wear tracks and causes the three-body wear phenomenon leading to fast removal of the coating [53].It is reported that the three-body abrasive wear and brittle fracture are the main wear mechanisms in PEO coatings [50].As a result,the Raand porosity percent are more effective than hardness on wear resistance.The damage is not severe for other coatings,and only the outer layer has been slightly worn (Fig.13a’,a",and a"’).The coatings produced using bipolar and soft sparking modes are denser and less rough,showing a higher wear resistance than that produced using the unipolar regime.

Fig.13.Surface morphology of the wear tracks after dry-sliding tests under 3 N normal load: (a) U,(a’) B1,(a") B2,(a"’) B3,and under 5 N normal load:(b) B1,(b’) B2,(b") B3.
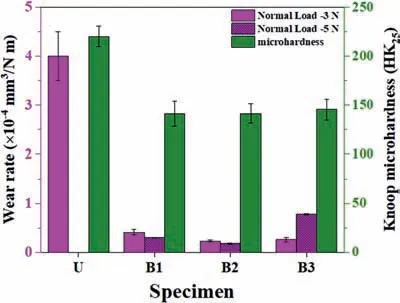
Fig.14.Knoop micro-hardness (HK25) and wear rate of the coated specimens under 3 and 5 N normal loads.
At the normal load to 5 N,B1 and B3 samples are damaged,especially B3.The low depth of track (8 and 10 μm for B1 and B3,respectively) indicates that a considerable part of the coatings has remained undamaged.However,B2 coating is a little damaged,and its outer layer is worn slightly (Fig.13b’),confirmed by its low track depth (5 μm).As seen,increasing the cathodic width from 10 to 20% has an advantage in improving the wear resistance,while further increasing the cathodic width (B3 sample) decreases the wear resistance,more likely due to the detrimental effect of the highest cathodic current density created (Fig.1).The very high cathodic pulse width has a negative effect on improving the coating properties,as also reported for the PEO coatings grown on Ti-6Al-4V alloy [34] and Al [54].Also,the positive effect of TiO2incorporation on improving the tri-biological properties of 7075 Al alloy is reported by ref.[38],while K2TiO(C2O4)2salt was used.
4.Conclusions
Plasma electrolytic oxidation of AZ31 Mg alloy was carried out using bipolar (B1),and soft sparking (B2 and B3)waveforms with different cathodic duty cycles of 10,20,and 30% in an alkaline silicate-based solution containing K2TiF6.The following results were obtained:
1-The surface morphology of all coatings was net-like and/or scaffold containing irregular micro-pores,micro-cracks,fused oxide particles,and a sintered structure.The micropores have three types,including the open mouth,semisealed,and fully sealed due to the incorporation of TiO2colloidal particles and repairing of defects by cathodic pulses.It was noted that the micro-pores were mostly sealed.The average thickness of the coatings was increased by increasing the cathodic width.
2-After 1 day of immersion in 3.5 wt.% NaCl solution,EIS results revealed two humps in Bode-phase plots demonstrating complete barrier protection of the substrate.After 4 days,the humps were merged.With increasing the immersion time to 7 days,the B1 specimen displayed an inductive loop,indicating that the aggressive solution directly contacts the substrate in some local areas and the coating has dismissed its barrier performance.After 14 days,each specimen showed one hump as the response of the coating inner layer and inductive loop denoting the local corrosion attack of Mg alloy substrate.
3-The Rinvalue could be determined as the resistance of the coatings in long-term immersion due to its higher magnitude than Rout.For B2 coating,the Rinhas remained the highest from 7 to 14 days of immersion;thus,it has the highest corrosion performance.The size of the holes created on the coating surface after long-term corrosion was decreased in the coatings produced by soft sparking waveforms,especially for the B2 specimen.
4-By comparing the long-term immersion results,it was found that the coatings produced in the K2TiF6-containing solution showed higher Rinvalues than those coatings correspondingly grown in the additive-free solution.Moreover,the outer layers of these coatings were improved efficiently by the incorporation of TiO2particles,resulting in higher Routvalues.
5-The coating produced using the unipolar waveform has the highest porosity percent (~13%),Ra(~2.36 μm),and micro-hardness(220 HK25),which established a strong mechanical interlocking between ball and coating and increased the friction coefficient.Then,the coating was broken and strongly damaged,where the substrate has completely evident after~30 m distance under 3 N normal load.However,B2 coating revealed stable COF during sliding under 3 and 5 N,showing relatively the highest wear resistance.It was found that the Raand porosity percent are more effective than hardness on wear resistance of the PEO coatings.
Acknowledgement
Technical supports from Plasma Oxide Pars Co.are gratefully acknowledged.
杂志排行
Journal of Magnesium and Alloys的其它文章
- Novel Mg-Bi-Mn wrought alloys: The effects of extrusion temperature and Mn addition on their microstructures and mechanical properties
- Passivation of corrosion product layer on AM50 Mg by corrosion inhibitor
- A crystal plasticity based approach to establish role of grain size and crystallographic texture in the Tension–Compression yield asymmetry andstrain hardening behavior of a Magnesium–Silver–Rare Earth alloy
- Developing polydopamine modified molybdenum disulfide/epoxy resin powder coatings with enhanced anticorrosion performance and wear resistance on magnesium lithium alloys
- Novel extended C-m models of flow stress for accurate mechanical and metallurgical calculations and comparison with traditional flow models
- Unexpected high-temperature brittleness of a Mg-Gd-Y-Ag alloy
