Effects of bump parameters on hypersonic inlet starting performance
2022-10-24ShangchengXUYiWANGZhenguoWANGXiaoqiangFANBingXIONG
Shang-cheng XU, Yi WANG, Zhen-guo WANG, Xiao-qiang FAN, Bing XIONG
Research Article
Effects of bump parameters on hypersonic inlet starting performance
Shang-cheng XU, Yi WANG, Zhen-guo WANG, Xiao-qiang FAN, Bing XIONG
College of Aerospace Science and Engineering, National University of Defense Technology, Changsha 410073, China
Unstart is an unwanted flow phenomenon in a hypersonic inlet. When an unstart occurs, the captured airflow flowing through the engine significantly decreases with strong unsteady characteristics, which may lead to thrust loss or even combustor flameout. In this study, various bump configurations were designed to be integrated with a hypersonic inlet to improve its starting ability. A bump was defined as an integrated 3D compression surface installed upstream of the inlet entrance. The starting processes of these bump inlets were numerically simulated to investigate the effect laws and flow mechanisms of the bump parameters. Tests on bump height revealed that the starting performance could be significantly improved by increasing bump height, with the starting Mach number decreasing by 0.55 for the inlet with the highest bump. The high bump facilitates the side movement of the subsonic flow in the separation zone, which leads to a small separation bubble, thus accelerating the starting process. Further, the starting ability can be improved by designing a relatively wide bump, which results in a decline in the starting Mach number by 0.44. When the bump has the same or greater width compared with the airflow capture range, a growing spillage along the transverse direction can be formed so that the airflow in the separation bubble can be easily excluded, improving the starting ability.
Hypersonic inlet; Bump; Boundary layer flow; Starting performance; Large-scale separation bubble
1 Introduction
Starting performance is one of the most important parameters for determining the operating range of a hypersonic aircraft powered by a scramjet (Curran, 2001; Sziroczak and Smith, 2016; Devara et al., 2020). In case of an unstart, the captured airflow significantly decreases, which may lead to thrust loss or even combustor flameout (Im et al., 2016; Su et al., 2018). From published studies, several flight tests have been unsuccessful owing to the occurrence of unstart (Voland et al., 1999; Rodriguez, 2003; Walker et al., 2005, 2008; Chang et al., 2017). Therefore, the unstart phenomenon, as an important issue in the field of hypersonic propulsion, has received increasing attention. Over the past several decades, designers have performed many studies related to inlet unstart. Kantrowitz and Donaldson (1945) investigated the starting ability of a 1D isentropic-compression inlet and reported a theoretical model (known as the Kantrowitz limit), in which the starting performance was co-determined by the incoming Mach number and the internal contraction ratio by assuming that a normal shock stood at the inlet entrance. Mahoney (1990) further developed this theory by assuming that the Mach number at the throat was half that of the inflow. In addition, Molder et al. (2004) studied the starting characteristics of a high compression inlet with mass spillage by further developing the Kantrowitz theory. Wang et al. (2009) experimentally studied the unstarted flow of a 3D sidewall compression inlet. Liu et al. (2019) investigated a special unstarting phenomenon (called local unstart) as the inlet operated at an over-rated mode.
Currently, variable geometry and boundary layer bleed schemes are widely used to enhance starting performance. The configurations of variable geometry inlets can be adjusted via a complex movable mechanical device driven by an electrical one. Variable geometry methods, including moving/rotating cowls, sidewalls, and compression walls, have been proposed and investigated in previous studies (Liu et al., 2017; Reardon et al., 2021). Teng and Yuan (2015) proposed a variable geometry hypersonic inlet by introducing a variable geometry cowl sidewall, demonstrating that the starting ability could be improved by increasing the cowl sidewall sweepback. In addition, bleeding has been widely adopted in hypersonic inlets (Yuan et al., 2021). The bleed holes and plenum are usually arranged in the inlet entrance to remove the near-wall airflow of the large-scale separation bubble, thereby accelerating the starting process (Zhang et al., 2020).
The bump inlet was proposed by the Lockheed Martin Corporation to divert the boundary layer flow (Hamstra and Sylvester, 1998). Xu et al. (2019) showed that the starting ability of a hypersonic inlet could be improved by designing a bump surface on the compression wall. This provides a potential method to improve the starting ability without requiring additional devices, and is worth an in-depth analysis. The bump has been proposed and adopted in supersonic inlets to divert boundary layer airflow since the last century (Simon et al., 1957; Svensson, 2008; Colliss et al., 2014). The results reported by Yu et al. (2020) indicated that the boundary layer flow can be effectively excluded by a 3D bump, thereby improving the quality of the captured airflow. Xu et al. (2017) found that the diversion ability of a bump can be improved by increasing its height. Numerous studies have proved that the transverse pressure gradient (TPG) over the bump plays an important role in boundary layer diversion (Kim, 2009; Tillotson et al., 2009; Yu et al., 2018). Herein, TPG represents the wall pressure gradient distribution along the direction from the symmetry plane to both sides. In previous studies, research on bump inlets has mainly focused on boundary layer diversion, but very few studies have investigated the starting performance (Kim and Song, 2007; Svensson, 2008; Xie and Guo, 2008). Because it has recently been shown that a bump can improve the inlet starting ability, a study of the effect laws of bump parameters on the inlet starting performance is important to provide guidance for bump design. In addition, the underlying flow mechanism while using bumps should be further evaluated.
In this study, the effect laws of bump parameters on the starting performance of a hypersonic inlet were investigated. First, various bump configurations with different heights and widths were designed and integrated with a hypersonic inlet. Second, the flow fields under the design point and during the starting process were numerically calculated. The boundary layer diversion ability was studied to understand the operating characteristics of the bump. Lastly, the effects of the height and width of the bump on the starting ability were evaluated, and the flow structures were analyzed to understand the difference in the starting ability of inlets with various bump configurations.
2 Inlet design integrated with various bump configurations
In this study, various bump surfaces were designed and integrated into a hypersonic chin inlet. This chin inlet is shown in Fig. 1, whereis the streamwise coordinate,is the radial coordinate, anddenotes the angle between the plane of symmetry and the corresponding osculating plane. The axisymmetric body can be divided into a shock-dependent region and a compression region according to the flow structure. An axisymmetric cowl was installed on the chin of the body. The two sweep-forward sidewalls were located in the osculating planes=-45° and 45°. This implies that the inlet can capture the airflow in the range of -45°≤≤45°. The total and internal contraction ratios of the inlet are 6.0 and 1.9, respectively. In addition, the inlet was designed to operate at a flight height of 26 km and a flight Mach number of=6. The shock-on-lip condition was achieved at the design point.

Fig. 1 Hypersonic chin inlet: side view (left) and front view (right)
Various bump inlets were designed by employing the bump/inlet integration design method proposed in a previous study, where the compression region in every osculating plane can be controlled according to a given TPG, thereby generating a 3D bump surface (Xu et al., 2022). Different bump configurations can be obtained by adjusting the TPG distribution. The TPG curve is controlled by a group of parameters—1,2,, andr. Parameters1and2denote the start and end locations of the TPG curve, respectively, which co-determine the bump width;is a scaling factor of the TPG curve, which is related to the bump height;ris a pressure factor that can be varied to acquire different internal contraction ratios at the bump inlet. This approach provided an effective method for controlling the pressure gradient distribution over a bump surface. In addition, because the modified compression wall acted as a bump surface, the designed bump was completely integrated with the inlet.
2.1 Design of inlets with different bump heights
Four inlets, namely H1, H2, H3, and H4, with different bump heights were designed. For the detailed design process, please refer to Xu et al. (2022). The primary parameters of the inlets are listed in Table 1. The higher the value of, the larger the transverse pressure drop (denoted as Δ). By increasing the value of, Δin the plane=1200 mm of H1–H4 increases from∞to 4∞, where∞represents the static pressure of the incoming flow. Correspondingly, the height of the bump increases from 4.17 mm in H1 to 21.35 mm in H4. To maintain consistency, the bump of the four inlets had the same width with1=0° and2=60°. Under the current parameter settings, the total contraction ratios (CRt) of these bump inlets were 6.0. To obtain a constant internal contraction ratio (CRin) of 1.9 in every inlet,r/∞is adjusted. In addition, the original hypersonic inlet is named H0, and its parameters are listed in Table 1 for comparison.
Fig. 2 presents a comparison of the geometric profiles behind the plane=1200 mm for the five inlets. The profile curve of H0 is axisymmetric, with a bump height of 0. The walls of all the bump inlets were higher than that of H0 near the symmetry plane, but lower on both sides. This implies that the compression surfaces of the four inlets were modified, and large bump surfaces were formed on the entire compression wall. The bumps grew in height as the transverse pressure difference increased. Specifically, the bump of H4 was the highest, followed by H3 and H2, and only a slight bump was formed in H1.
2.2 Design of inlets with different bump widths
The value of2was changed to generate inlets with different bump widths (Table 2). Parameter2of W1 was set at 15° to place the bump configuration in the range of -15°≤≤15°, whereas2in W2 to W4 increases linearly from 30° to 60° with increases in the bump width. Then, the value ofof each inlet was changed to obtain the same transverse pressure drop on the bump (3∞). In addition, the value ofr/∞was adjusted to maintain a constant internal contraction ratio (1.9).
Fig. 3 shows the geometrical configurations of the four bump inlets, with the bump surfaces highlighted in yellow. A slim bump surface was formed in the central region of the compression wall of W1. The bump of W2 is slightly wider than that of W1. Because the center angle of the inlet was 90°, the bumps of W1 and W2 were both located within the airflow capture range. In contrast, the bump of W3 was located over the entire airflow capture region and had the same width as the inlet entrance. A wider bump was formed in W4.
3 Numerical method and code validation
3.1 Numerical method
Three-dimensional Reynolds-averaged Navier–Stokes (RANS) equations were adopted to numerically calculate the aerodynamic performances and starting processes of the hypersonic bump inlets. Considering the separated flows in the calculated flow fields, the shear stress transfer (SST)-turbulent model was adopted (Li et al., 2018; Erdem and Kontis, 2010).

Table 1 Main parameters of the inlets with different bump heights
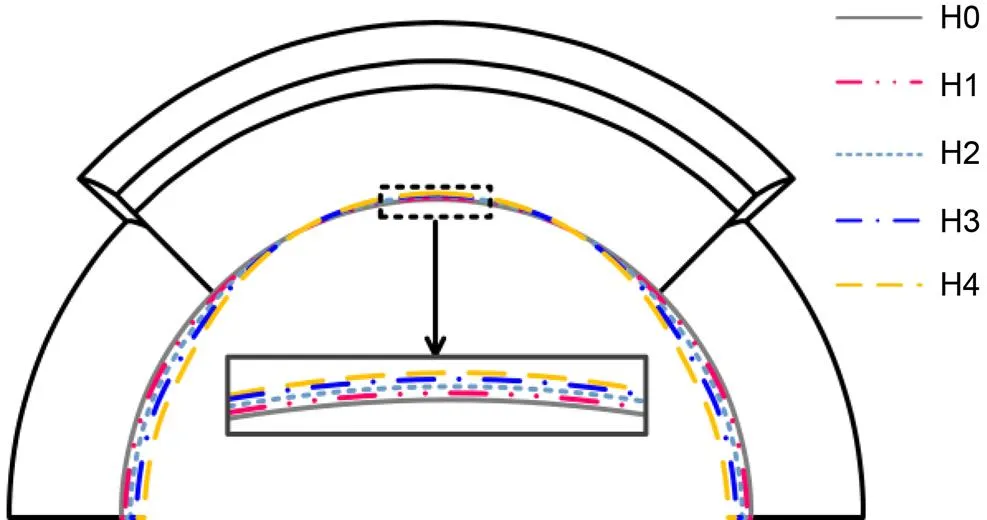
Fig. 2 Geometric profiles behind the plane x=1200 mm of the inlets with different bump heights
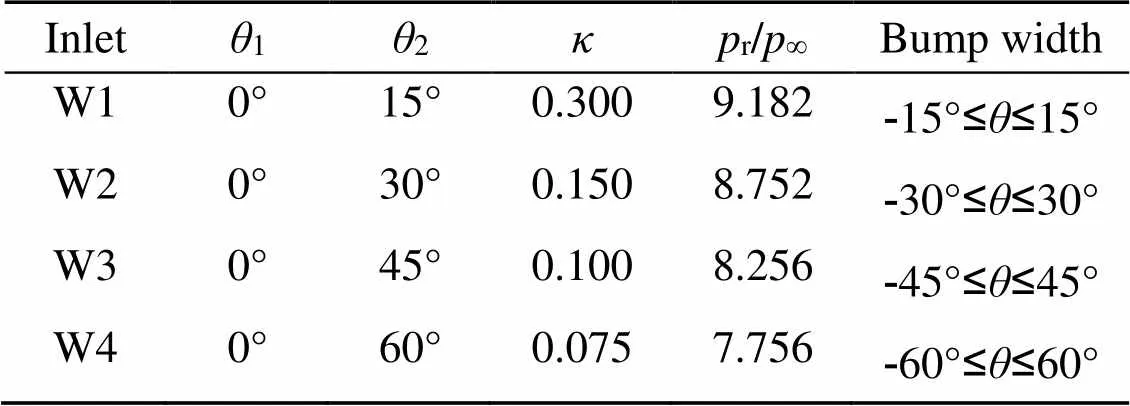
Table 2 Main parameters of the inlets with different bump widths

Fig. 3 Geometrical configurations of the inlets with different bump widths. References to color refer to the online version of this figure
The density-based implicit solver was employed. Roe averaged flux difference splitting (Roe-FDS) was adopted for the convective term. In addition, the second-order upwind schemes were utilized to discretize the flow term, turbulent kinetic energy, and specific dissipation rate (Brito Lopes et al., 2020; Brito Lopes, 2021). To ensure convergence, the residuals and the mass flow ratio at the throat were monitored. The solution could be seen as converged when all the residual values dropped more than two orders of magni tude and the mass flow ratio was basically unchanged.
Structured grids were adopted in the computational domain. For clarity, the grid in the symmetry plane is shown in Fig. 4a. The grid points near the wall and in the duct were clustered to calculate the near-wall flow and complex flow phenomena in the flow fields. To ensure the accuracy of the near-wall flow, a value ofplus (+) below 1 was realized in the main portion of the wall flow region. A grid independence study was carried out in the authors' previous work, and a grid setting with a grid number of 54000 was employed in every osculating plane (Xu et al., 2022). Considering the symmetry of the inlet, only half of the model was used as the computational domain. Finally, the total grid number of the 3D computational domain was 3240000. The computational domain and grid distribution are shown in Fig. 4b.
The boundary condition of the pressure far field was enforced in the inflow, which was operated at a static pressure of 2511.18 Pa, static temperature of 221.65 K, and a specified incoming Mach number. The pressure outlet was adopted in the outflow with a back-pressure value of 0. In addition, the no-slip adiabatic wall condition was applied to the wall and cowl.
3.2 Code validation
The flow fields acquired by the experimental test and the current numerical method have been compared in a previous study, and good agreement was exhibited in both flow structures and wall static pressures (Xu et al., 2022). In the present study, an experiment was undertaken in the blow-down-indraft wind tunnel LF-220 of the National University of Defense Technology, China to validate the accuracy of the numerical methods for calculating the starting process. Fig. 5 shows the test model installed at the wind tunnel. As shown in the figure, a scaled inlet was used as the experimental model. The geometrical configuration and flow structure of the test model were similar to those of the studied chin inlets. The model was installed on a supporting mechanism with five degrees of freedom that could change the angle of attack (AOA) of the inlet during the test process. The outlet diameter of the nozzle was 220 mm with an inflow Mach number of 5 and a unit Reynolds number of approximately 1.78×10⁷m-1. The static pressures on the inlet surface were recorded using pressure sensors during the test process.

Fig. 4 Diagram of grid and boundary conditions adopted in the computational domain: (a) grid in the symmetry plane; (b) grid of the 3D computational domain
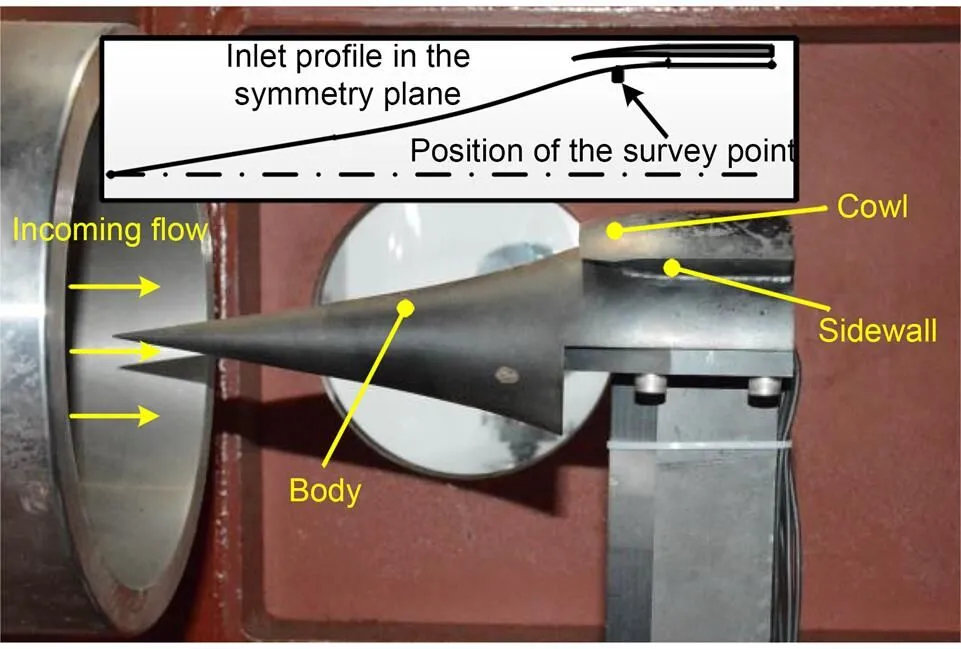
Fig. 5 Photograph of the test model installed at the wind tunnel
The model was installed at a large positive AOA of 8° to build the initial unstarted flow. Subsequently, the AOA was intermittently decreased to a negative AOA according to a given time sequence to restart the inlet. The current numerical approach was emplo yed to simulate the test process. Fig. 6 shows the time-averaged pressures of a typical measurement point (located in the internal contraction region, as shown in Fig. 5) obtained by the experiment and numerical method. The experimental data were recorded using a pressure transducer with a range of 0–100 kPa and an accuracy of 0.3% across the full range. The pressure signal obtained by the experiment maintained a high level with strong fluctuation at an AOA of 8°, which indicates that the wind tunnel was unstarted owing to the oversized blockage ratio. Therefore, the experimental pressure values at an AOA of 8° are not given in Fig. 6. When the AOA decreased to 4°, the wind tunnel started, and the wall pressure was almost equal to the numerical value. Then, slight drops can be seen in both the experimental and numerical data with further decreases in the AOA. When the AOA decreased from -1.2° to -1.3°, the pressure measured by the experiment dropped sharply owing to the emergence of the start. A similar sudden drop can be observed in the numerical results at an AOA of -2.7°. The experimental and numerical pressures agreed with each other both in the unstarted and started modes. In addition, the difference in the starting AOA prediction between the two results was only 1.4°. The slight error might be caused by differences between the boundary layer flows acquired by the wind tunnel test and by the numerical method. Additionally, the machining precisions of the supporting mechanism and the inlet model (especially the surface roughness) may cause a slight error.
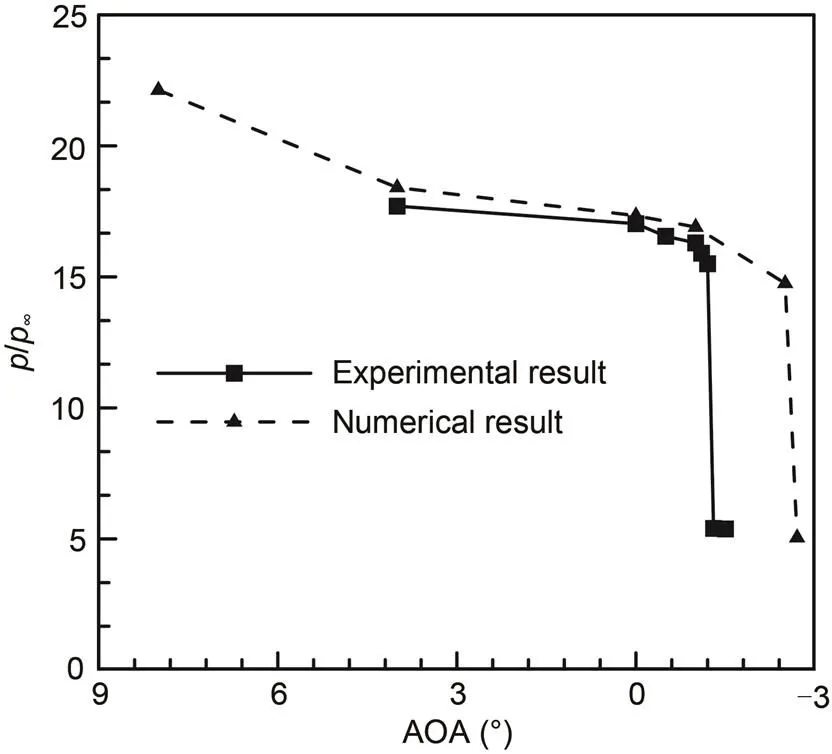
Fig. 6 Wall static pressure distributions acquired by the experimental and numerical methods with decreasing attack angle
4 Results and discussion
4.1 Effect of bump height on inlet performances
4.1.1Boundary layer diversion performance
To understand the working process of the bump, it is necessary to first analyze its boundary layer diversion. The boundary layer is defined as the near-wall low-energy airflow with a total pressure recovery coefficient (denoted as PR) below 0.3 (Xu et al., 2022). The boundary layer thickness is denoted by. Fig. 7 displays the boundary layer thickness distributions in the plane=1400 mm (immediately upstream of the inlet entrance), where the dashed line marks the sidewall location. H0 has an approximately equal boundary layer thickness along the transverse direction. After placing the bump surface, the boundary layer thickness in the airflow capture region obviously decreased but significantly increased outside the sidewall. This was because the boundary layer flow on the bump was excluded and finally accumulated at the bump lateral border. Furthermore, it was found that the higher the bump surface, the better the diversion effect. For example, the average thickness of the boundary layer flow within the capture range of H0 was 6.038 mm, whereas those of H2 and H4 were 5.921 mm and 5.765 mm, exhibiting decreases of 1.94% and 4.52%, respectively.

Fig. 7 Boundary layer thickness distributions (in the plane x=1400 mm)
The primary performance parameters of the inlets are shown in Fig. 8. The mass flow ratio () of H0 reached 0.9960, which is the highest among all the inlets. The mass flow ratios of all bump inlets slightly dropped owing to the boundary layer diversion. In addition, the captured airflow gradually declined as the bump increased in height. This demonstrates that the boundary layer diverting ability can be improved by increasing the bump height. Owing to the low-energy airflow diversion, the total pressure recovery ability of the bump inlets improved. Furthermore, a growing trend can be seen in PR from H1 to H3, but that of H4 slightly decreases compared with H3. The analysis reveals that although the boundary layer flow in H4 is excluded, the total pressure recovery decreases because of the additional total pressure loss caused by the high-bump configuration. This indicates that there is an optimal height in the bump design that effectively excludes the boundary layer flow without unwanted total pressure loss.
4.1.2Starting performance
The self-starting processes were simulated using the current numerical method. Figs. 9a and 9b show the changes in the performance parameters during the starting process, and Fig. 9c displays the PR contours in the symmetry plane of H4. All the inlets were unstarted, and both parameters were relatively low at an incoming Mach number of=3.00. As can be seen in Fig. 9c, a large-scale separation bubble was formed and a separation shock was induced (=3.00) at the entrance of H4, which resulted in the decline of the mass flow ratio and total pressure recovery. When the Mach number increased from 3.79 to 3.80, both parameters of H4 increased considerably. In addition, the separation bubble vanished completely and a supersonic flow was formed in the duct as the Mach number increased to 3.80. Evidently, the inlet entered the starting mode. The Mach number at which the inlet transforms from unstart to start is called the starting Mach number (denoted ass). With a further increase in the inflow Mach number, the other bump inlets entered the starting state in turn (H3 ats=3.95, H2 ats=4.08, and H1 ats=4.20). H0 did not start until the Mach number reached 4.35, thus exhibiting the worst starting performance. This indicates that the addition of a bump can improve the starting ability, thereby broadening the inlet operating range. Furthermore, increasing the bump height can accelerate the inlet start. The bump in H4 leads to a decline of 0.55 in the starting Mach number compared with the original inlet H0.
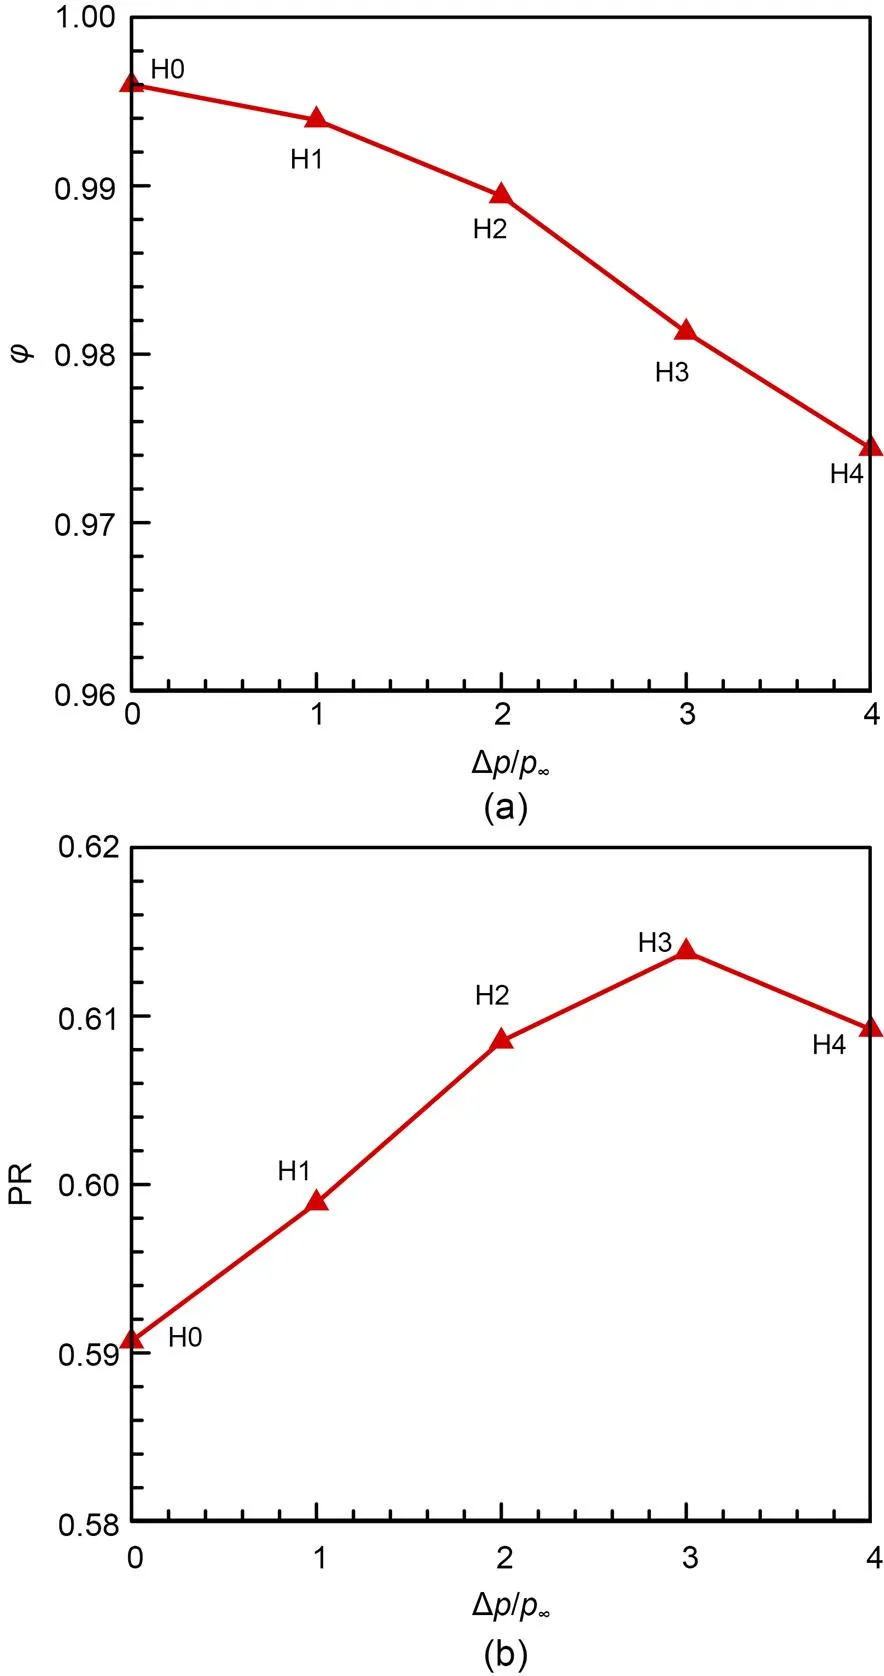
Fig. 8 Aerodynamic performances of the inlets with different bump heights under the design point: (a) mass flow ratio; (b) total pressure recovery coefficient

Fig. 9 Changes in the inlet performance parameters and PR contour during the starting processes: (a) mass flow ratio; (b) total pressure recovery coefficient; (c) PR contour of H4
The unstarted flows of the five inlets were analyzed to determine the reason for the improvements in starting performance of the bump inlets. Fig. 10a shows the near-wall streamline distributions of these inlets in the unstarted mode. There were large-scale separation zones and transverse spillages in each unstarted flow. The separation line of H0 is mostly in the central region, but moved downstream along the transverse direction, showing an arch-shaped curve. However, the separation line of H1 moved downstream near the symmetry plane but travelled upstream on both sides. In addition, this trend became more pronounced as the bump height increased. The separation line of H4 was significantly concave in the central region but exhibited two peaks on both sides, forming a double-humped curve. Moreover, the reattachment line of H0 remained unchanged. As the bump height increased, the reattachment line moved forward near the symmetry plane and backward near the sidewalls. Evidently, the bump has a restructuring effect on the large-scale separation zone. To evaluate the separation scale under different bump heights, the shapes of the separation and reattachment lines were extracted and are shown in Fig. 10b, where the dark area (-45°≤≤45°) represents the airflow capture range. The separation bubble scale in the capture range gradually decreased with increasing bump height. This indicates that increasing the bump height can effectively reduce the scale of the separation zone.
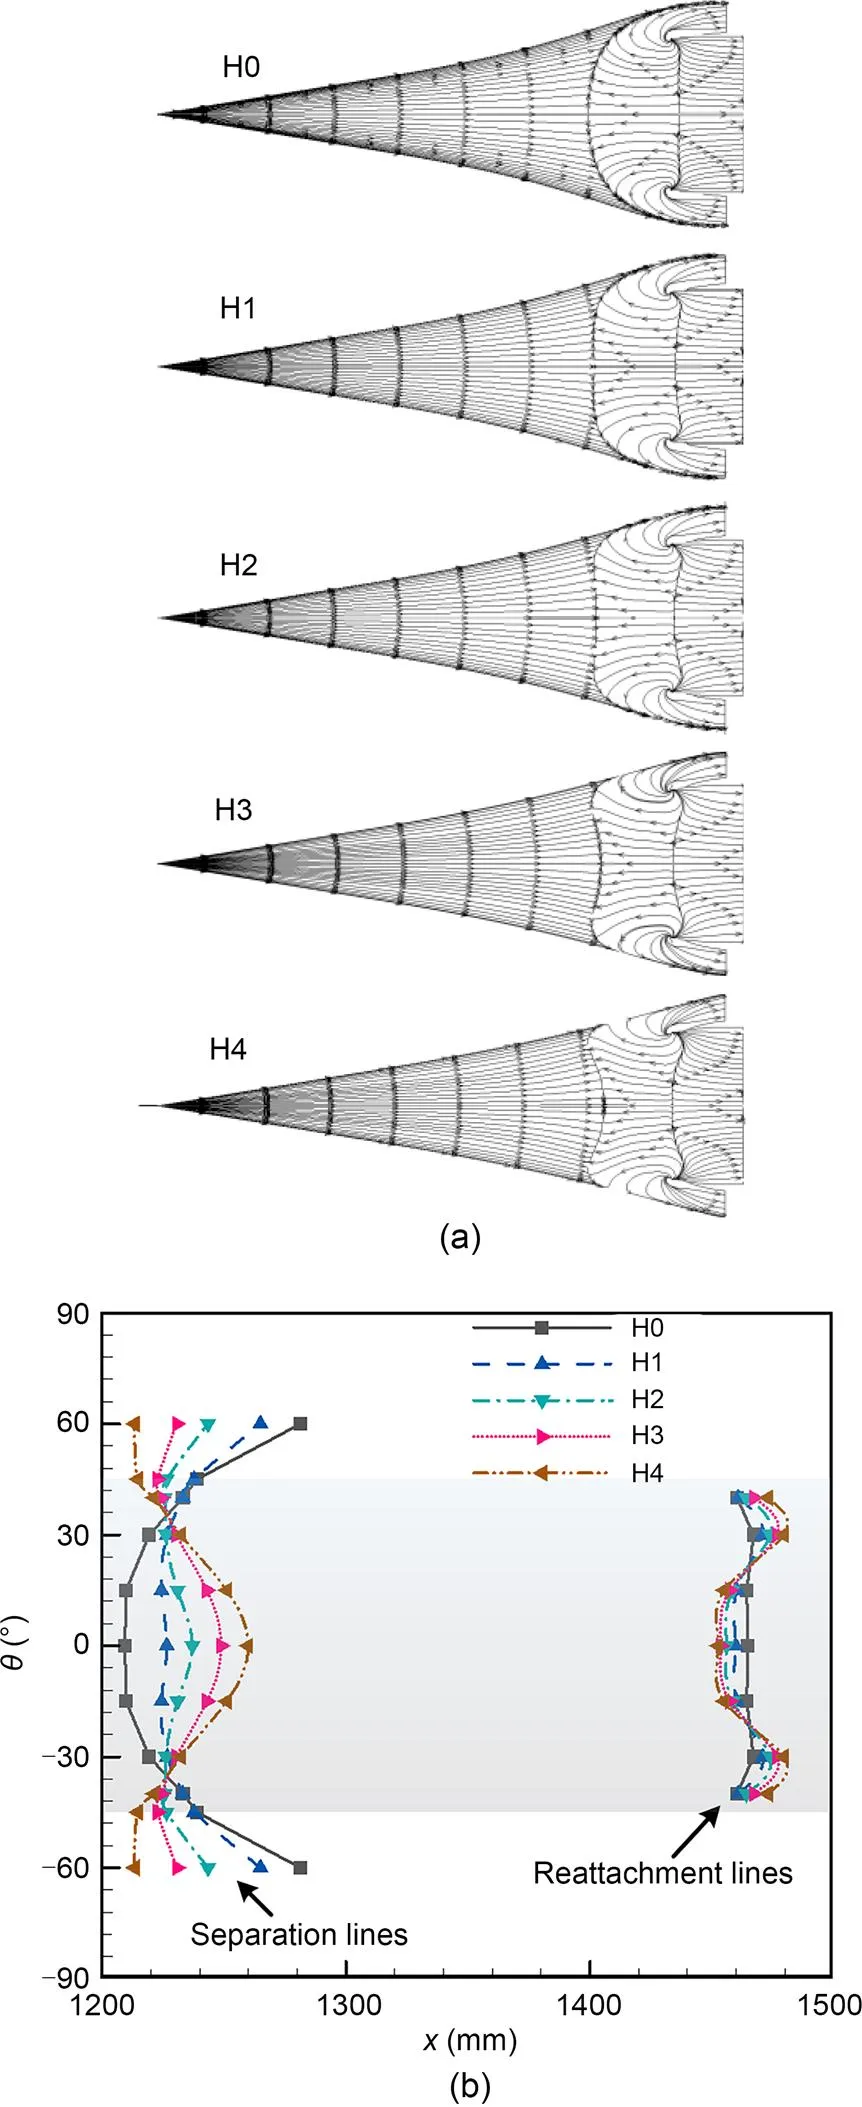
Fig. 10 Near-wall flow structures of the inlets with different bump heights at M=3.5: (a) near-wall streamline distributions; (b) separation and reattachment lines
The TPGs were extracted from the unstarted flow fields to study the influence of bump height on the separation zone. Fig. 11 displays the TPG curves in the separation zone. The TPG of the bump inlet mainly consists of two aspects: the TPG generated by the bump surface and that caused by the large-scale separation bubble. For H0, the TPG is formed only due to the latter. Therefore, the TPG of H0 was high outside the sidewall but low within the captured range. Due to the increasing TPG generated by the bump, the TPGs of H1–H4 increased successively. The pressure drop of H0 is approximately 1.02∞in the range from the symmetry plane to the sidewall, but those of the bump inlets grow steadily (1.17∞at H1, 1.40∞at H2, 1.67∞at H3, and 1.80∞at H4). The large TPG in the bump inlet makes the transverse spillage in the separation zone much easier, which results in a small separation bubble.
Fig. 12 shows the transverse velocity (t) distributions at=3.5. As can be seen, the area and speed of transverse spillages in H0–H4 progressively increased. For example, the maximum transverse speed of H0 was approximately 300 m/s, while that of H4 reached 400 m/s. This proves that increasing bump height was beneficial to the transverse spillage, thereby accelerating the starting process. Thus, the inlet with a higher bump showed a better starting performance.
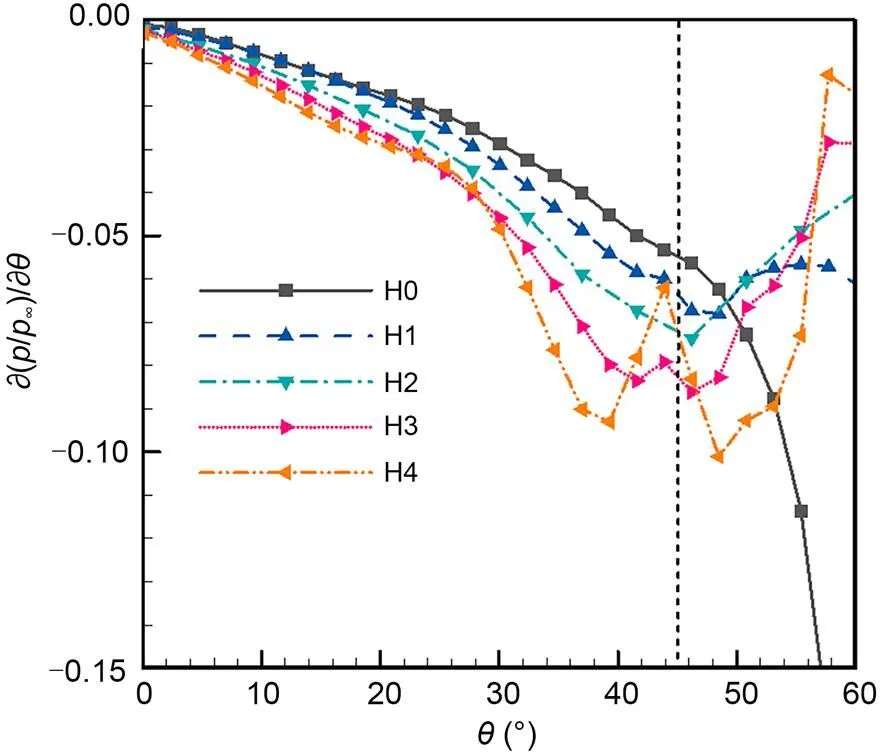
Fig. 11 TPG distributions of the unstarted inlets at M=3.5 (in the plane x=1350 mm)
4.2 Effect of bump width on inlet performances
4.2.1Boundary layer diversion performance
The performance parameters of inlets with different bump widths at the design point are shown in Fig. 13. As the bump surface widened, the mass flow ratio gradually decreased, but the total pressure recovery coefficient significantly improved. Fig. 14 depicts the boundary layer distributions to reveal the differences in performance parameters. Overall, the boundary layer thickness was lower on the bump surface but higher at the lateral border. For example, the boundary layer of W1 is only 5.7 mm in height near the symmetry plane but reaches 7.0 mm at the osculating plane of=15°. Similarly, the boundary layer of W2 was displaced and then accumulated in the bump lateral border at approximately=30°. Because the inlet captured the airflow in the range of -45°≤≤45°, the boundary layers that accumulated in the bump lateral borders of W1 and W2 were not excluded from the inlet. This is why W1 and W2 show high mass flow ratios but poor total pressure recovery ability. The bump width of W3 was the same as the inlet capture range. Therefore, the boundary layer outside the sidewall was excluded, but that inside the sidewall was still swallowed by the inlet. Because the bump of H4 was wider than the capture range, the diverted boundary layer could be excluded from the inlet, thereby improving the quality of the captured airflow. Therefore, the mass flow ratio of W4 was the lowest, but its total pressure recovery performance was the best among all the inlets. This implies that the location of the sidewall should be considered in bump-width design. A good displacement effect can be achieved when the bump surface is designed to be wider than the capture range.

Fig. 12 Transverse velocity contours of the unstarted inlets at M=3.5 (in the plane x=1350 mm)
4.2.2Boundary layer diversion performance
The starting processes of inlets with different bump widths were numerically simulated, and the starting Mach numbers were obtained. W3 started at=3.91, exhibiting the best starting performance. Subsequently, the start emerged in W4 as the incoming Mach number increased to 3.95. Subsequently, W2 and W1 entered the starting state at Mach numbers of 3.99 and 4.10, respectively. The results indicate that the starting performance can be improved by designing a relatively wide-bump configuration. In addition, the optimal bump width (bump in W3) leads to a decline in the starting Mach number of 0.44 compared with the original inlet.
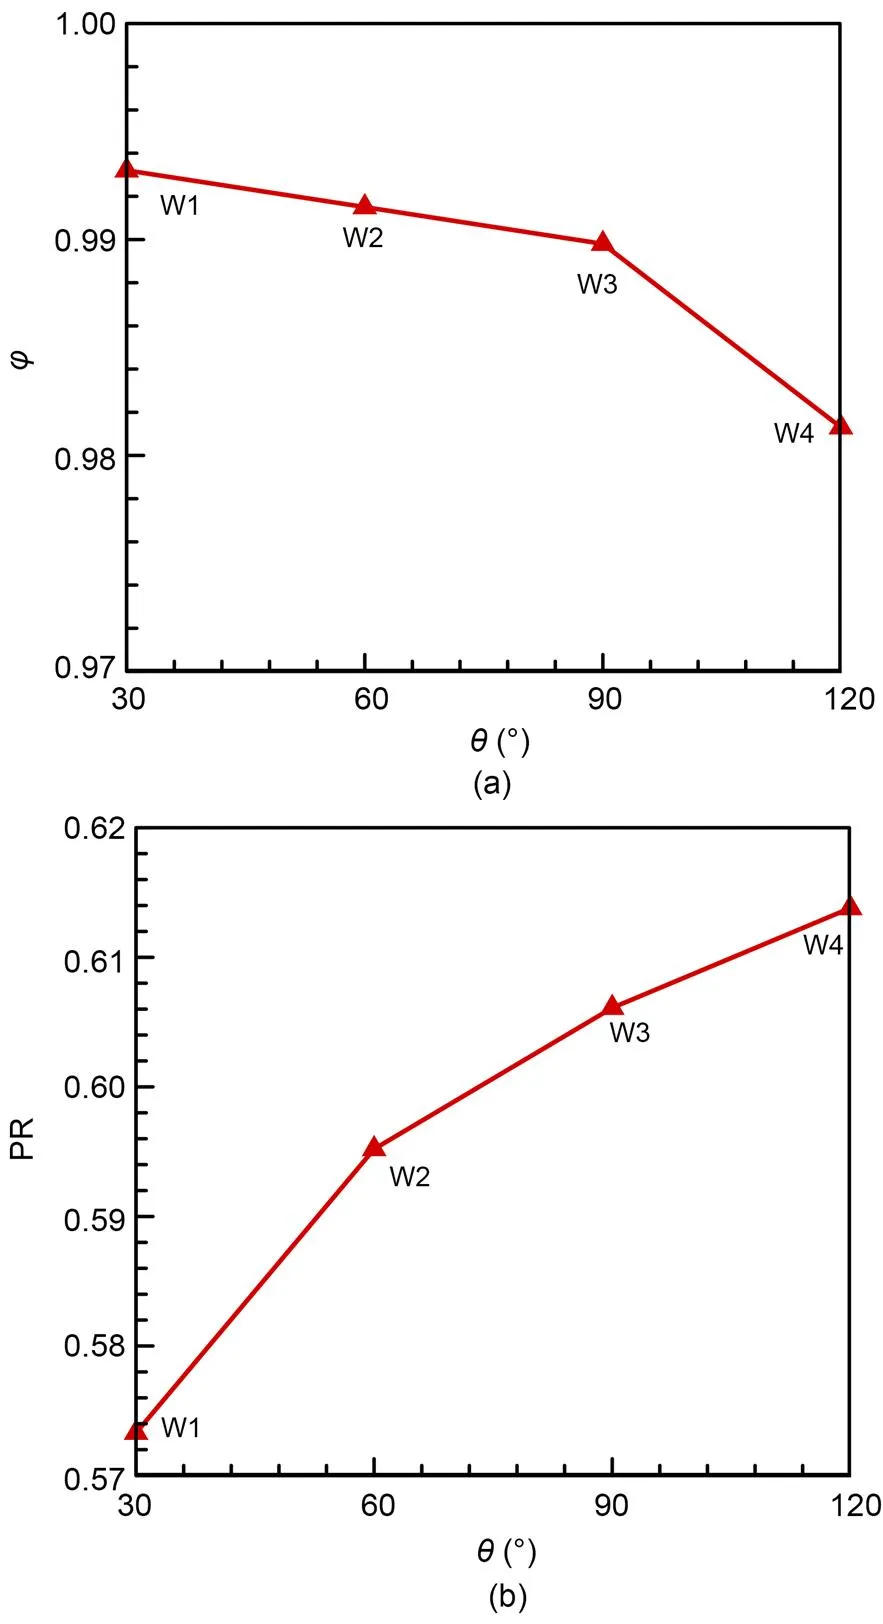
Fig. 13 Aerodynamic performances of the inlets with different bump widths under the design point: (a) mass flow ratio; (b) total pressure recovery coefficient
The flow structures of the unstarted inlets were investigated to reveal the underlying flow mechanism. Fig. 15 displays typical Mach number contours and the streamlines in the flow fields. Fig. 16 displays the TPG curves in the plane1350 mm. The separation zones of W1 and W2 were relatively small in the central region; as a result, the separation shock waves in the symmetry planes were weak, and the cowl-lip spillages were small. However, the cowl-lip spillages grew significantly along the transverse direction owing to the increasing separation bubble scale. As can be seen in the flow fields of W1 and W2, spiral streamlines were formed near the symmetry plane under the combined effects of separated flow and transverse spillage. However, streamlines become chaotic along the transverse direction, forming complex large-scale vortex structures. Subsequently, the separation bubble flow was formed by the strong transverse spillage at the side. A negative TPG can provide a driving force for transverse spillage. As shown in Fig. 16, the TPGs of W1 and W2 were negative immediately next to the symmetry planes, and a side-moving flow was established under the effect of the TPG. However, the two curves gradually increased and became positive along the transverse direction, where the value of W1 reached 0.068 at=11.7°. Because the positive TPG obstructed the transverse spillage, the spiral flow was broken, and the flow gradually became chaotic. Subsequently, the TPGs returned to negative at approximately=20°; as a result, the airflows were mostly dominated by the transverse spillage. Compared with the TPGs of W1 and W2, those of W3 and W4 were always negative, and their absolute values monotonically increased, providing continuous driving forces for the transverse spillage. The transverse flow velocities of W3 and W4 gradually increased along the transverse direction, forming unblocked spillage channels.
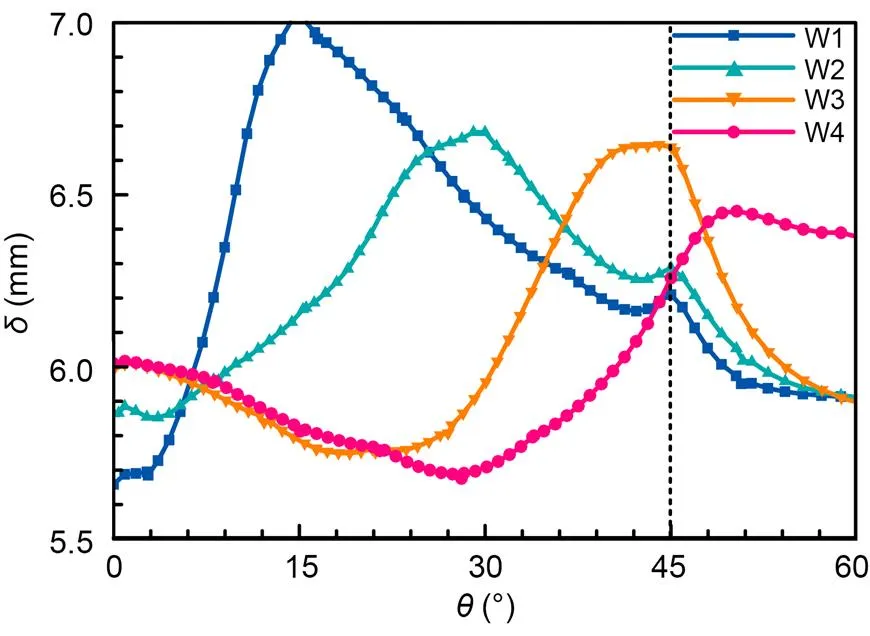
Fig. 14 Boundary layer thickness distributions (in the plane x=1400 mm)

Fig. 15 Mach number contours and streamlines of the unstarted inlets at M=3.5
The above comparison shows that when the bump configuration of an inlet is narrower than the capture region, the separation zone on the bump can be effectively reduced, but its scale in the area between the bump lateral border and sidewall significantly increases. In addition, the flow in the separation zone was dominated by transverse spillage only near the sidewalls. In contrast, when the bump is designed to have the same or larger width compared with the capture range, a growing transverse spillage along the transverse direction can be formed so that the airflow in the separation bubble can be easily excluded.
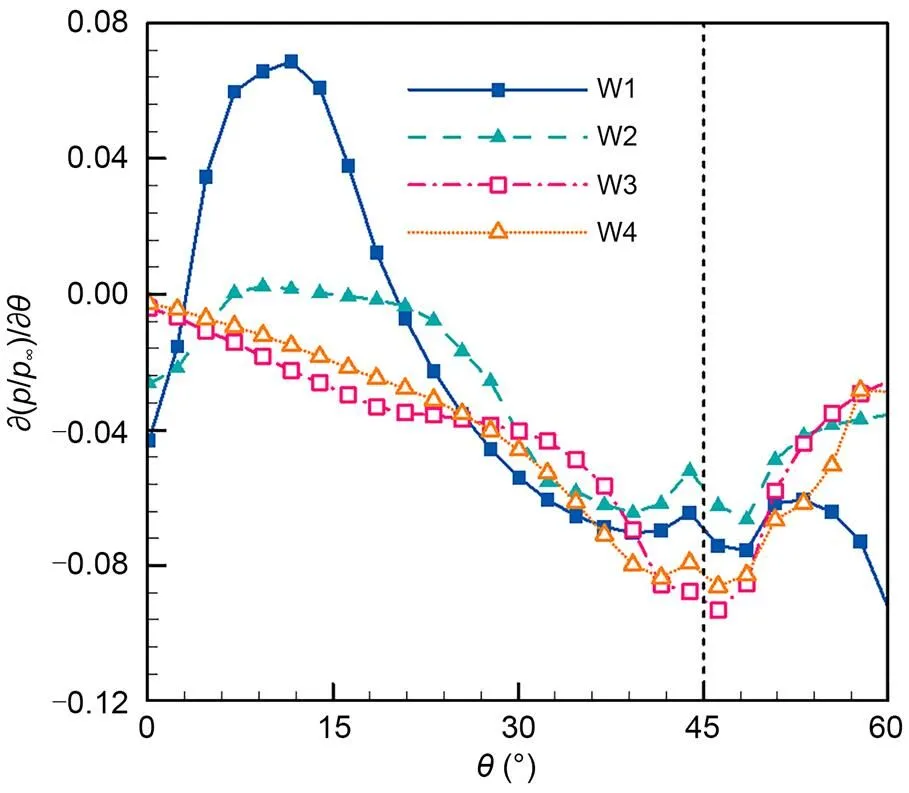
Fig. 16 TPG distributions of the unstarted inlets at M=3.5 (in the plane x=1350 mm)
Fig. 17 displays the transverse velocity contours in the separation bubble. The velocities and ranges of the transverse flows in the separation zones of W1 and W2 were smaller than those of W3 and W4. It also demonstrates that the type of separation bubble in W3 and W4 had a larger transverse spillage compared to that of other inlets. Moreover, it was found that there were reverse transverse flows immediately next to the symmetry planes of W1 and W2. This is explained by analyzing the flow structures. The separation zone was small, and the induced separation shock wave was weak near the symmetry plane; therefore, the static pressure behind the shock wave was relatively low. However, the pressure downstream of the shock significantly rose along the transverse direction because of the increasing separation shock intensity. Therefore, a transverse pressure difference was established. Affected by the pressure difference, the airflow behind the separation shock flowed to the middle, forming the reverse transverse flow.
A large-scale separation zone is the key to inlet starting performance. The starting process is that the self-sustaining separation zone is broken, and the separation bubble is swallowed under the increasing inflow dynamic pressure. Here, the self-sustaining abilities of separation bubbles are discussed based on unstarted flow fields. In the separation bubbles in W1 and W2, the flow separation was the least and the separation shock was the weakest near the symmetry plane. Under increasing incoming dynamic pressure, the separation bubble near the symmetry plane should be broken first; that is, the region near the symmetry plane should be the position of the weakest self-sustaining ability. However, that was not the case, and the barrel effect was not suitable for analyzing the self-sustaining ability. This was because the pressure behind the separation shock increased near the symmetry plane when the airflows converged to the middle, so that the separation zones at this position could still be self-sustained. This reveals that the separation bubble has a self-adaptive ability and can reinforce its weak position by self-adjustment. This also implies that the separation bubble should be considered as a whole when analyzing its self-sustaining ability.

Fig. 17 Transverse velocity contours of the unstarted inlets at M=3.5 for W1‒W4 (in the plane x=1350 mm)
5 Conclusions
To reveal the effect of a bump on inlet performances, especially the starting performance, hypersonic inlets with various bump configurations were designed. Then, the aerodynamic performances and starting processes of these inlets were evaluated and analyzed using numerical methods. The main conclusions are as follows:
(1) The boundary layer airflow was excluded by the bump surface, causing a slight decline in the captured airflow but a remarkable increase in the total pressure recovery ability. Furthermore, the performance of the boundary layer diversion could be improved by increasing the bump height, which resulted in a slight decline in the mass flow ratio but a significant improvement in total pressure recovery. Moreover, when the bump surface was designed to be wider than the inlet capture range, a good displacement effect could be achieved.
(2) The bump inlet starting performance could be improved by increasing the bump height, and the starting Mach number decreased by 0.55 for the inlet with the highest bump. The analysis revealed that the large-scale separation bubble was restructured by a bump. A higher bump facilitated the side movement of the flow in the separation zone by a large TPG, thereby accelerating the starting process.
(3) The starting performance could be improved by designing a relatively wide-bump configuration, which resulted in a decline in the starting Mach number of 0.44 compared with the original inlet. The results showed that when the bump is designed to be the same width with or wider than the capture range, a growing transverse spillage along the transverse direction can be formed such that the subsonic airflow in the separation bubble can be easily excluded.
This study can provide insight into the effect of bumps on inlet starting performance and has potential applications in hypersonic inlets to broaden their operating range. In addition, a wind tunnel test will be carried out in the future to further investigate the effects of bumps on inlet starting ability.
This work is supported by the National Natural Science Foundation of China (No. 12102470) and the Hunan Provincial Innovation Foundation for Postgraduate (No. CX20200082), China.
Shang-cheng XU, Yi WANG, and Zhen-guo WANG designed the research. Shang-cheng XU and Bing XIONG processed the corresponding data. Shang-cheng XU wrote the first draft of the manuscript. Xiao-qiang FAN and Bing XIONG helped to organize the manuscript. Yi WANG revised and edited the final version.
Shang-cheng XU, Yi WANG, Zhen-guo WANG, Xiao-qiang FAN, and Bing XIONG declare that they have no conflict of interest.
Brito Lopes AV, 2021. Advanced Modelling of Turbulent Spray Flames in Aero Gas-Turbines with Liquid Bio-Fuels. PhD Thesis, Coventry University, Coventry, UK.
Brito Lopes AV, Emekwuru N, Bonello B, et al., 2020. On the highly swirling flow through a confined bluff-body., 32(5):055105. https://doi.org/10.1063/1.5141531
Chang JT, Li N, Xu KJ, et al., 2017. Recent research progress on unstart mechanism, detection and control of hypersonic inlet., 89:1-22. https://doi.org/10.1016/j.paerosci.2016.12.001
Colliss SP, Babinsky H, Nübler K, et al., 2014. Joint experimental and numerical approach to three-dimensional shock control bump research., 52(2):436-446. https://doi.org/10.2514/1.J052582
Curran ET, 2001. Scramjet engines: the first forty years., 17(6):1138-1148. https://doi.org/10.2514/2.5875
Devara MKK, Jutur P, Rao SMV, et al., 2020. Experimental investigation of unstart dynamics driven by subsonic spillage in a hypersonic scramjet intake at Mach 6., 32(2):026103. https://doi.org/10.1063/1.5135096
Erdem E, Kontis K, 2010. Numerical and experimental investigation of transverse injection flows., 20(2):103-118. https://doi.org/10.1007/s00193-010-0247-1
Hamstra JW, Sylvester TG, 1998. System and Method for Diverting Boundary Layer Air. US Patent 5779189.
Im S, Baccarella D, McGann B, et al., 2016. Unstart phenomena induced by mass addition and heat release in a model scramjet., 797:604-629. https://doi.org/10.1017/jfm.2016.282
Kantrowitz A, Donaldson CD, 1945. Preliminary Investigation of Supersonic Diffusers. NACA Wartime Report No. L5D20, National Advisory Committee for Aeronautics, Washington, USA.
Kim SD, 2009. Aerodynamic design of a supersonic inlet with a parametric bump., 46(1):198-202. https://doi.org/10.2514/1.37416
Kim SD, Song DJ, 2007. A numerical analysis on three-dimensional flow field in a supersonic bump-type inlet., 21(2):327-335. https://doi.org/10.1007/BF02916293
Li LQ, Huang W, Yan L, et al., 2018. Mixing improvement induced by the combination of a micro-ramp with an air porthole in the transverse gaseous injection flow field., 124:109-123. https://doi.org/10.1016/j.ijheatmasstransfer.2018.03.061
Liu J, Yuan HC, Wang YF, et al., 2017. Unsteady supercritical/critical dual flowpath inlet flow and its control methods., 30(6):1877-1884. https://doi.org/10.1016/j.cja.2017.10.007
Liu JB, Fan XQ, Tao Y, et al., 2019. Experimental and numerical study on the local unstart mechanism of hypersonic inlet., 160:216-221. https://doi.org/10.1016/j.actaastro.2019.04.041
Mahoney JJ, 1990. Inlets for Supersonic Missiles. American Institute of Aeronautics and Astronautics, Washington, USA.
Molder S, Timofeev EV, Tahir RB, 2004. Flow starting in high compression hypersonic air inlets by mass spillage. Proceedings of the 40th AIAA/ASME/SAE/ASEE Joint Propulsion Conference and Exhibit. https://doi.org/10.2514/6.2004-4130
Reardon JP, Schetz JA, Lowe KT, 2021. Computational analysis of unstart in variable-geometry inlet., 37(4):564-576. https://doi.org/10.2514/1.B38214
Rodriguez CG, 2003. Computational fluid dynamics analysis of the central institute of aviation motors/NASA scramjet., 19(4):547-555. https://doi.org/10.2514/2.6165
Simon PC, Brown DW, Huff RG, 1957. Performance of External-Compression Bump Inlet at Mach Number of 1.5 to 2.0. NACA RM E56L19, National Advisory Committee for Aeronautics, Washington, USA.
Su WY, Chen Y, Zhang FR, et al., 2018. Control of pseudo-shock oscillation in scramjet inlet-isolator using periodical excitation., 143:147-154. https://doi.org/10.1016/j.actaastro.2017.10.040
Svensson M, 2008. A CFD Investigation of a Generic Bump and Its Application to a Diverterless Supersonic Inlet. MS Thesis, Swedish Defense Research Agency, Stockholm, Sweden.
Sziroczak D, Smith H, 2016. A review of design issues specific to hypersonic flight vehicles., 84:1-28. https://doi.org/10.1016/j.paerosci.2016.04.001
Teng J, Yuan HC, 2015. Variable geometry cowl sidewall for improving rectangular hypersonic inlet performance., 42:128-135. https://doi.org/10.1016/j.ast.2015.01.011
Tillotson BJ, Loth E, Dutton JC, et al., 2009. Experimental study of a Mach 3 bump-compression flowfield., 25(3):545-554. https://doi.org/10.2514/1.35306
Voland RT, Auslender AH, Smart MK, et al., 1999. CIAM/NASA Mach 6.5 scramjet flight and ground test. Proceedings of the 9th International Space Planes and Hypersonic Systems and Technologies Conference. https://doi.org/10.2514/6.1999-4848
Walker S, Rodgers F, Esposita A, 2005. The hypersonic collaborative Australia/United States experiment (HyCAUSE). Proceedings of the AIAA/CIRA 13th International Space Planes and Hypersonics Systems and Technologies Conference. https://doi.org/10.2514/6.2005-3254
Walker S, Rodgers F, Paull A, et al., 2008. HyCAUSE flight test program. Proceedings of the 15th AIAA International Space Planes and Hypersonic Systems and Technologies Conference. https://doi.org/10.2514/6.2008-2580
Wang Y, Liang JH, Fan XQ, et al., 2009. Investigation on the unstarted flowfield of a three-dimensional sidewall compression hypersonic inlet. Proceedings of the 16th AIAA/DLR/DGLR International Space Planes and Hypersonic Systems and Technologies Conference. https://doi.org/10.2514/6.2009-7404
Xie WZ, Guo RW, 2008. A ventral diverterless high offset S-shaped inlet at transonic speeds., 21(3):207-214. https://doi.org/10.1016/S1000-9361(08)60027-8
Xu SC, Wang Y, Wang ZG, et al., 2017. The design and analysis of bump in high speed supersonic flow. Proceedings of the 21st AIAA International Space Planes and Hypersonics Technologies Conference. https://doi.org/10.2514/6.2017-2269
Xu SC, Wang Y, Wang ZG, et al., 2019. Design and analysis of a hypersonic inlet with an integrated bump/forebody., 32(10):2267-2274. https://doi.org/10.1016/j.cja.2019.04.010
Xu SC, Wang Y, Wang ZG, et al., 2022. Design method for hypersonic bump inlet based on transverse pressure gradient., 23(6):479-494. https://doi.org/10.1631/jzus.A2100532
Yu ZH, Huang GP, Xia C, 2018. Inverse design and Mach 6 experimental investigation of a pressure controllable bump., 81:204-212. https://doi.org/10.1016/j.ast.2018.08.006
Yu ZH, Huang GP, Xia C, 2020. 3D inverse method of characteristics for hypersonic bump-inlet integration., 166:11-22. https://doi.org/10.1016/j.actaastro.2019.09.015
Yuan YC, Liu FZ, Wang X, et al., 2021. Design and analysis of a supersonic axisymmetric inlet based on controllable bleed slots., 118:107008. https://doi.org/10.1016/j.ast.2021.107008
Zhang BH, Zhao XY, Liu J, 2020. Effects of bleed hole size on supersonic boundary layer bleed mass flow rate., 21(8):652-662. https://doi.org/10.1631/jzus.A1900507
Yi WANG, https://orcid.org/0000-0002-3657-9769
Mar. 23, 2022;
Revision accepted Aug. 1, 2022;
Crosschecked Sept. 9, 2022
© Zhejiang University Press 2022
杂志排行
Journal of Zhejiang University-Science A(Applied Physics & Engineering)的其它文章
- Regimes of near-stoichiometric hydrogen/air combustion under reciprocating engine conditions
- Effect of droplet superficial velocity on mixing efficiency in a microchannel
- Modeling the optimal compensation capacitance of a giant magnetostrictive ultrasonic transducer with a loosely-coupled contactless power transfer system
- Three-dimensional flow field mathematical model inside the pilot stage of the deflector jet servo valve
- Hydrodynamics of high-speed robots driven by the combustion-enabled transient driving method
- Complex integrity constraint discovery:measuring trust in modern intelligent railroad systems
