LDNet: structure-focused lane detection based on line deformation①
2022-10-22ZHANGJunWANGXingbinGUOBinglei
ZHANG Jun (张 军), WANG Xingbin, GUO Binglei
(*School of Computer Engineering, Hubei University of Arts and Science, Xiangyang 411053, P.R.China)
(**Institute of Information Engineering, Chinese Academy of Science, Beijing 100093, P.R.China)
Abstract Lane detection is a fundamental necessary task for autonomous driving. The conventional methods mainly treat lane detection as a pixel-wise segmentation problem, which suffers from the challenge of uncontrollable driving road environments and needs post-processing to abstract the lane parameters. In this work,a series of lines are used to represent traffic lanes and a novel line deformation network (LDNet) is proposed to directly predict the coordinates of lane line points. Inspired by the dynamic behavior of classic snake algorithms, LDNet uses a neural network to iteratively deform an initial lane line to match the lane markings. To capture the long and discontinuous structures of lane lines, 1D convolution in LDNet is used for structured feature learning along the lane lines.Based on LDNet, a two-stage pipeline is developed for lane marking detection: (1) initial lane line proposal to predict a list of lane line candidates, and (2) lane line deformation to obtain the coordinates of lane line points. Experiments show that the proposed approach achieves competitive performances on the TuSimple dataset while being efficient for real-time applications on a GTX 1650 GPU. In particular, the accuracy of LDNet with the annotated starting and ending points is up to 99.45%, which indicates the improved initial lane line proposal method can further enhance the performance of LDNet.
Key words: autonomous driving, convolutional neural networks (CNNs), lane detection, line deformation
0 Introduction
With the rapid development of high-precision optics and electronic sensors, and computing capability,autonomous driving has received much attention in both academy and industry. In these systems, camera-based lane detection plays a critical role in the semantic understanding of the world around a vehicle[1-2]. It is challenging to perform accurate lane detection for the following reasons. First, lanes are usually thin and long curves travelling through the entire scenario, and have diverse patterns, such as solid, broken, splitting and merging. Furthermore, the driving road scenarios are complex, highly variable, and uncontrollable due to lighting/weather conditions.
Traditional methods on lane detection adopt the hand-crafted features to identify lane markings. Features like color, intensity, gradient, edge, geometric shapes, and texture are widely used to describe the segments of lane markings. As these hand-crafted features are usually based on strong assumptions (e. g.,flat ground-planes) and lack high-level semantic information, these traditional methods have difficulty in detecting the lanes in complex situations. Thanks to the strong high-level semantic representation learning ability, recent convolutional neural networks (CNNs) have pushed lane detection to a new level. Most of these methods treat lane detection as a two-stage semantic segmentation task. In the first stage, a network is designed to classify each pixel in an image if it belongs to one of lanes or not. Post-processing in the second stage usually uses some curve-fitting strategy to filter the noise points or cluster the intermittent lane segments.Although the state-of-the-art methods already achieve great progress in lane detection, there are still some important and challenging problems to be addressed.Firstly, the segmentation-based methods with square shape kernels are hard to capture the thin and long curve property of lanes[3-5]. Due to ignoring the highlevel global semantic features (or contextual information), these methods often suffer from discontinuous and noisy detection results. Secondly, the desired output for autonomous driving is control-related parameters, i. e., vehicle lateral offset, turning angle and curvature. However, the outputs of most CNN-based lane detection methods are pixel-level lane instance masks in the image view. To fill this gap, some postprocessing procedures are required, e.g., inverse perspective mapping (IPM), and lane model fitting[6].
In this paper, a structure-focused lane marking detection network, named line deformation network(LDNet), is proposed to address the problems. LDNet can better capture the long and discontinuous structures of lane lines and predict the coordinates of lane line points in an end-to-end manner. Inspired by the dynamic behavior of previous snake methods[7-10], LDNet takes initial lane lines as input and deforms them by regressing vertex-wise offsets. PickNp= 64 points along each line as the features of the line and apply the standard 1D convolutions on the point features. The 1D convolution kernel not only captures the features of each point but also the relationship from neighboring points. This enhances feature representation and focuses on learning of the long and discontinuous structures of lane markings. Based on LDNet, a pipeline is developed for lane detection. Given a set of initial lane lines,LDNet iteratively deforms them to match the lane markings and obtain the coordinates of lane line points.In this paper, the straight line between the starting point and ending point of each lane is used as its initial lane line. Define the starting point of one lane as the lane point closest to the bottom boundary of the image.As the starting points of different lanes in an image are usually far apart from each other according to the traffic rules, the heat map based keypoint estimation method is used for starting points detection. Different from the starting points, the ending points are converged together around the farthest point of the visible lane. Inspired by VPGNet[6]and CHEVP[8], which use vanishing point as a global geometric context to infer the location of lanes, a vanishing point prediction task is designed to estimate the locations of the ending points.
In summary, this work has the following contributions.
(1) A novel LDNet is proposed,which focuses on the long and discontinuous structure learning of lane markings and directly predicts the coordinates of lane line points.
(2) Based on LDNet, the lane detection method is implemented by proposing the initial lane with two branches, in which heat map and probability map are used to predict lane lines’ starting point and ending points, respectively.
(3) The proposed method achieves comparable performance with state-of-the-art methods in terms of both accuracy and speed on the TuSimple dataset. In particular, the accuracy of LDNet with ideal starting and ending points is up to 99.45%, which indicates improved initial lane line proposal method can further enhance the performance of the method.
1 Related work
1.1 Deep learning based lane detection
Due to the strong representation learning ability,CNN based approaches have been used for lane marking detection. VPGNet[6]proposed a multi-task network guided by vanishing points for lane and road marking detection. LaneNet[11]used a lane edge proposal network for pixel-wise lane edge classification,and used a lane line localization network in stage two for lane line localization prediction. Neven et al.[12]regarded lane detection as an instance segmentation problem, in which a embedding branch disentangled the segmented lane pixels into different lane instances.Zhang et al.[13]established a framework that accomplished lane boundary segmentation and road area segmentation simultaneously. Ko et al.[14]first obtained the exact lane points by a confidence branch and an offset branch, then clustered the generated points by the point cloud instance segmentation method. To get rid of the perspective effect in the image, the inverse perspective mapping (IPM) was used by several methods[11,15-18]. Although these methods already achieved great progress in lane detection, there are still some important and challenging problems to be addressed.These methods often suffer discontinuous and noisy detection results due to the thinness of traffic lanes[19-22].Furthermore, post-processing is needed to filter the noise points and get the lane line information from pixel-level segmentation results[6,12,14,18].
To deal with the first problem, several schemes have been proposed to capture richer scene features (or contextual information). Zhang et al.[23]added one convolutional gated recurrent unit (ConveGRU) in the encoder phase to learn more accurate low-level features. Hou et al.[24]adopted a self-attention distillation(SAD) approach to allow the network to exploit attention maps within the network itself during the training stage. Zou et al.[25]combined CNN and recurrent neural network (RNN) to infer lanes from multiple frames of a continuous driving scene. SALMNet[4]used a semantic-guided channel attention module to enhance features representation to the structures of lane markings and suppresses noisy features from the background, and a pyramid deformable convolution module to capture the structures of long and discontinuous lane markings. Message passing between pixels can help capture spatial structures of objects having long structure region and could be occluded. SCNN[3]and RESA[20]utilized slice-by-slice convolutions to enable message passing between pixels across rows and columns in the feature map. Though message passing improves the performance of segmentation results, the dense pixel-wise communication-based message passing required more computational cost. To collect more information concerning a whole lane boundary, Spin-Net[26]designed a novel convolution layer to allow the convolutions to be applied in multiple directions. Line-CNN[27]utilized a line proposal unit (LPU) to proposal potential lanes, which forced the system to learn the global feature representation of the entire traffic lanes.
To avoid post-processing and predict the coordinates of lane line points directly, Chougule et al.[19]treated the lane detection and classification problems as CNN regression task, which relaxed per-pixel classification requirement to a few points along lane boundary. Qin et al.[5]and Yoo et al.[28]translated the lane detection problem into a row-wise classification task using global features. PRNet[22]and PolyLaneNet[21]are proposed to use polynomial curves to represent traffic lanes and then use a polynomial regression network to predict the polynomial coefficients of lanes. Gansbeke et al.[29]proposed a deep neural network that predicted a weights map like a segmentation output for each lane marking and used a differentiable leastsquares fitting module to directly regress the lane parameters. Instead of representing traffic lanes by curves, PointLaneNet[30]considered lane line as a series of points, and proposed the ConvLaneNet network to predict the lane line offset, start point and confidence. RONELD[31]first extracted lane points from the probability map outputs, followed by detecting curved and straight lanes before using weighted least squares linear regression on straight lanes to fix broken lane edges resulting from fragmentation of edge maps in real images.
1.2 Snake algorithms
The proposed method is inspired by the dynamic behavior of classic snake algorithms[7], which have been used for contour-based instance segmentation.Snake algorithms treat the coordinates of the vertices as a set of variables. By applying proper forces at the contour coordinates, the algorithms could push the contour to the object boundary. The implementation of these algorithms contains two stages. Firstly, the contour vertices for image representation are initialized. Then, the contour is deformed to the object boundary by learningbased methods. Recently, Ling et al.[9]followed the pipeline of traditional snake algorithms and used a graph convolutional neural network to predict vertexwise offsets for contour deformation. Instead of treating the contour as a general graph, deep snake[10]leveraged the cycle graph topology and introduced the circular convolution for efficient feature learning on a contour.Wang et al.[8]proposed a B-snake based lane model to describe a wider range of lane structure. In this work,a learning-based snake algorithm LDNet is implemented to deform the initial lane line to match the lane markings. As LDNet utilizes the features along the lane line to directly predict the coordinates of lane line points, it can solve the two problems mentioned above.
2 Methodology
In this paper, a novel lane detection is performed by deforming the initial lane lines to match lane markings in an image. Specifically, LDNet takes initial lane lines as input and predicts per-vertex offsets pointing to the lane boundary. The vertex offsets are predicted based on the features of lane line points extracted from the input image with a CNN backbone.
2.1 Lane representation
In general, lanes are drawn on roads with a shape of line or curve. It is improper to represent a lane with circular contour, which is used to represent compact object[9-10]. A line or curve can be accurately represented by a series of points, which can be obtained by using spline interpolation between points. A lane line can be determined by the following elements: starting point, ending point, and lane line center points. To facilitate the operation of LDNet, the number of lane points are kept fixed. As a result, the lane lines in an image are transformed into a learnable structured representation, as illustrated in Eq.(1).

whereNis the number of points for each lane line,Lis the number of lanes in an image, and(x,y) is the coordinate of a lane point.

Fig.1 An overview of the network architecture
Fig.1 illustrates the overall network architecture of the work. It contains three modules: (1) a feature extraction backbone (subsection 2.2) that takes a single image as input and provides shared intermediate feature maps for the successive modules; (2) an initial lane proposal module (subsection 2. 3) which outputs the candidate initial lane lines; (3) the learning-based snake algorithm module LDNet (subsection 2.4) which predicts vertex-wise offsets between initial lane line points and their target points. The output of the network are the coordinates of lane line points. The system is fully end-to-end trainable with stochastic gradient descent.
2.2 Backbone
The function of the backbone network is to extract semantically meaningful features for the successive modules. Choose stacked hourglass network as the backbone for its efficiency and effectiveness. The input images with size 512 ×256 RGB are resized to a smaller size (e.g.,64 ×32) by the resizing layer, which contains a sequence of convolution layers. The resized image is fed to multiple hourglass modules, each including one encoder, one decoder, and two output branches. The intermediate predictions and features output from the previous hourglass stage are integrated together to implement intermediate supervision. The total loss of the network is the sum of the loss on those hourglass modules.
2.3 Initial lane proposal module
Evidently,lane lines start from the boundary (bottom or left or right) of an image and converge together due to the perspective effect. Although lane line is not always straight, the straight line between its starting point and ending point could be used to represent its direction and range. Here the straight line between the starting point and ending point of each lane is used as its initial position. The lane line initialization task is transformed into starting points and ending points detection problems. As the starting points of different lane lines in an image are usually far apart from each other, the heatmap based keypoint estimation method can be used to predict them.
The ending points of traffic lanes in an image are often close to each other due to perspective projection,it is difficult to accurately localize them by the same method of starting point detection. Inspired by VPGNet[6]and CHEVP[8], which use vanishing point as a global geometric context to infer the location of lanes,a vanishing point prediction task is designed to estimate the locations of the ending points. As shown in Fig.1,these two subtasks are implemented by two branches which share the input features. The pseudocode of the initial lane line proposal module is given in Algorithm 1.

?
To predict starting points, a network head that consists of two 1 ×1 convolution layers is designed to transfer the feature maps into 1 channel heatmap.Peaks in this heatmap correspond to lane starting points. Training the starting point prediction branch follows Law and Den[32]. For each ground truth starting pointp, a low-resolution equivalent^p=pS」 is computed, whereSis the output stride. Then all ground truth starting points are splatted onto a heatmap by using a Gaussian kernelYxy,which is defined in Eq.(2).


For ending point location prediction, a network head is designed that consists of two 1 ×1 convolution layers to transfer the feature maps into 1 channel probability map and estimate the location and width of vanishing point in the input image. Firstly, the lane point map is extracted by picking points more than an adaptive confidence thresholdT. This confidence threshold is selected based on the confidence point in the probability map outputs. Then,the lane point map is scanned from the first row. Here the width between the first and the last lane line points is defined as the rangeRiof the lane points in rowi. After the first row with lane points is found, assume that this row is the vanishing row
where lanes disappear. For robustness and to exclude low-confidence noise, its rangeRvis compared with the rang of its subsequent rowRs. IfRv <Rs/2,the subsequent row is set as the vanishing row, and its range is compared with its subsequent row. This process is repeated untilRv≥Rs/2 and the estimated ending points are generated, as defined in Eq.(3).

2.4 Learning-based snake algorithm module
The snake algorithm module takes a list of candidate lane lines along with the feature maps of the image from the backbone network as the input and predicts the per-point offsets pointing to the lane boundary. For each candidate lane line, the feature vector for each lane line point(x,y)l,nis first constructed. The input featurefl,nfor a point (x,y)l,nis the concatenation of learning-based features and the point coordinate:[F((x,y)l,n); (x,y)l,n] whereFdenotes the feature maps. The feature mapsFare obtained by applying a CNN backbone on the input image as shown in Fig.1. The feature for one point is computed using the bilinear interpolation at the vertex coordinate(x,y)l,n.The appended point coordinate is used to encode the spatial relationship among lane points.
The concatenated feature vectors are passed into LDNet, which implements the learning-based snake algorithm. LDNet first predicts offsets based on the initial lane line points and then deforms the initial lane lines by point-wise adding the offsets to their point coordinates. The deformed lane lines can be used for the next iteration. The impact of inference iterations will be studied in subsection 3.2.
Following the idea from deepsnake[10], the LDNet consists three parts: a feature learning block, a fusion block, and a prediction head, as shown in Fig.2. To adapt to the long and discontinuous structure of lane lines, the circular convolution of deep snake is replaced by a 1D convolution. The feature learning block is composed of 8 ‘Conv1d-Bn-ReLU’ layers and uses residual skip connections for all layers. In all experiments, the kernel size of 1D convolution is fixed to be nine. The fusion block aims to fuse the information across all lane points at multiple scales. It concatenates features from all layers in the feature learning block and forwards them through a 1 ×1 convolution layers followed by max pooling. The fused feature is then concatenated with the feature of each point. The prediction head applies three 1 ×1 convolution layers to the point features and outputs point-wise offsets between initial lane points and the target points, which are used to deform the initial lane.

Fig.2 Architecture of LDNet
3 Experiments
In this section, the accuracy and efficiency of the method are demonstrated with extensive experiments.The following sections mainly focus on three aspects:experimental settings, ablations studies of the method,and results on TuSimple dataset.
3.1 Implementation setup
In the experiments, the input images are resized to 512 × 256 during the data augmentation process.Then the resized image is compressed into smaller size data by a resizing layer, which contains a sequence of convolution layers and max pooling layers. The out channel of the resizing layer is 128.
Training strategy. For starting points detection,the training objective is a penalty-reduced pixel-wise logistic regression with focal loss[32]:

For the interactive lane deformation, the loss function is defined in Eq.(6).

whereλk,λpandλiterare loss coefficients. Setλk=0.5,λp= 1,andλiter= 10 in the experiments. Adam with weight decay 1e-5 is used as the optimizer to train the model and the learning rate is set to be 1e-3[35].The total number of training epochs is 500 for TuSimple dataset. All models are trained with PyTorch[36].
Dataset. To evaluate proposed approach, TuSimple lane dataset[38]is used to conduct the experiment.Tusimple dataset is collected with good and medium weather conditions in highways. It consists of 3626 training and 2782 testing images. They are recorded on 2-lane/3-lane/4-lane or more highway roads, at different daytime. For training, randomly apply simple data augmentation methods like flip, translation, and adding shadow, which contribute to a more comprehensive dataset.
Evaluation metrics. The main evaluation metric of TuSimple is accuracy, which is calculated as the average correct number of points per image. The accuracy is defined as the average correct number of points per image.

where,Fpredis the number of wrongly predicted lanes;Npredis the number of predicted lanes;Mpredis the number of missed ground-truth lanes andNgtis the number of all ground-truth lanes.
3.2 Ablation study
Effectiveness of LDNet. To prove the effectiveness of LDNet, the annotated starting points and ending points extracted from the annotation of TuSimple dataset are used to avoid the influence of staring points and ending points prediction.
The results of LDNet model with annotated starting points and ending points are shown in Table 1. The accuracy of the proposed method is above 99.2% across all inference iterations. Fig.3 illustrates qualitative results of LDNet with two iterations on TuSimple dataset.From Fig.3, it can be seen that LDNet with annotated starting points and ending points performs well for occluded lanes (a-d), curve lanes (e-h) and lanes in non-flat plane (i-l). Both the quantitative and qualitative results indicate that LDNet has a strong ability to deform proper initial lane line to match the lane markings. Therefore, LDNet can be applied in both online and offline scenarios, such as accurate lane detection,fast interactive lane annotation,and HD map modeling.
In LDNet, the iteration number is an important hyper-parameter, which influences the model size and speed. Table 1 also shows the evaluation results of LDNet models with various iterations. The accuracy is up to 99.45% when LDNet has two iterations. However,adding more iterations does not further improve the performance, which shows that it might be harder to train the network with more iterations. In the following experiments, the iterations of LDNet are fixed to two.
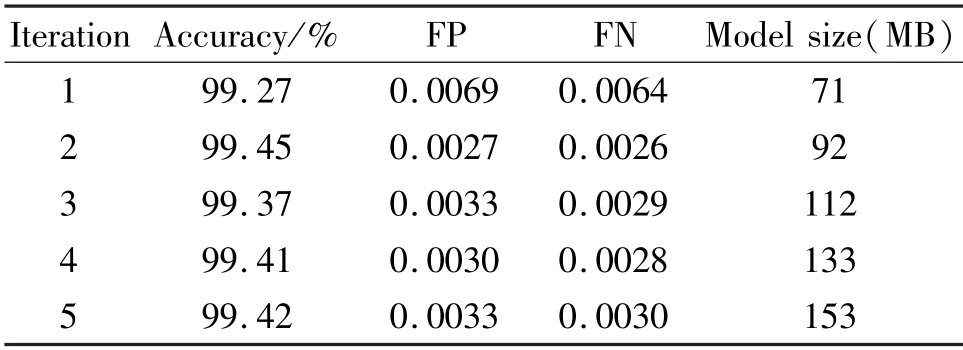
Table 1 Results of LDNet with different iterations. Here the initial lane lines are generated with the annotated starting points and ending points directly
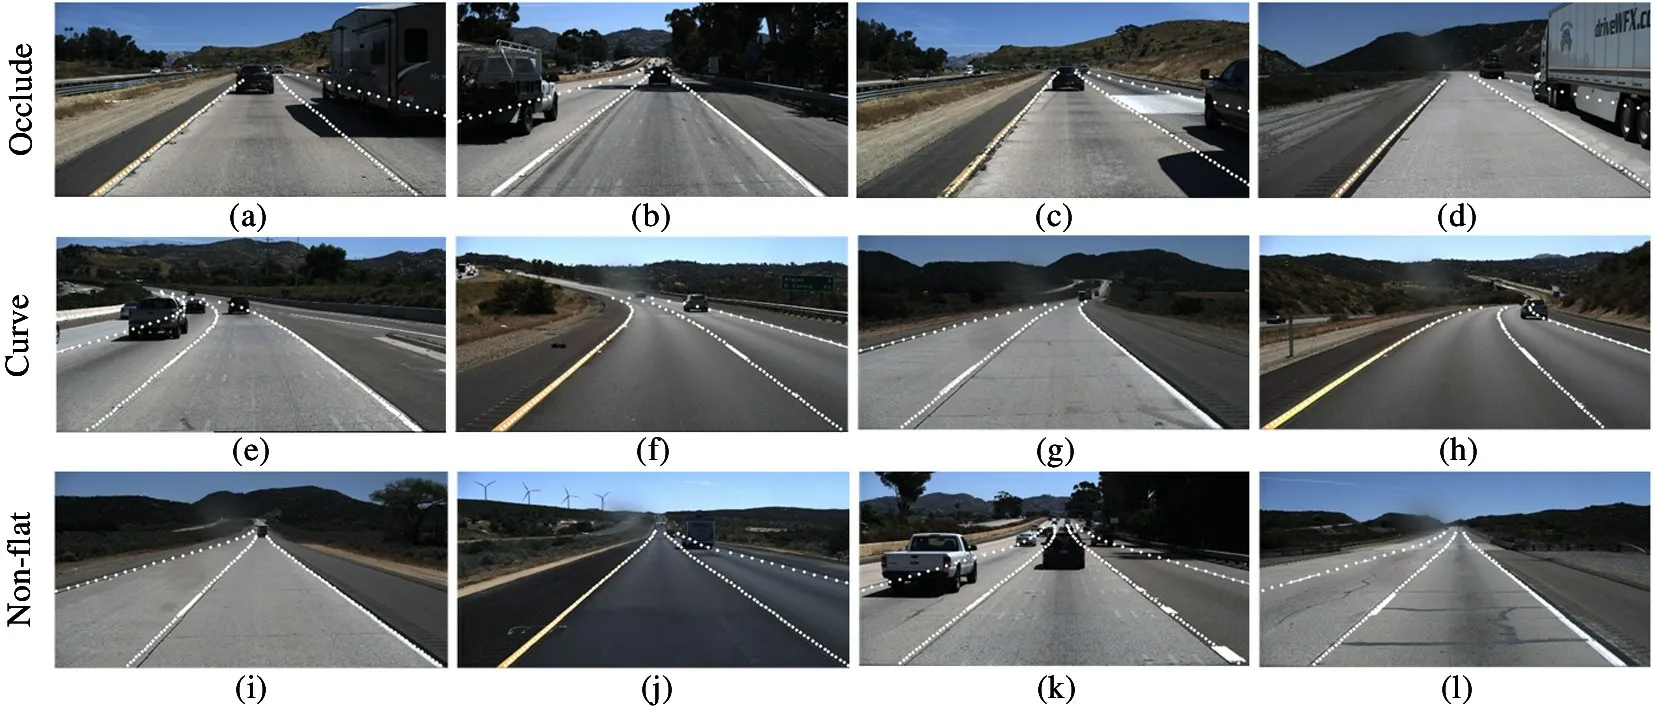
Fig.3 Examples of results from the TuSimple lane detection benchmark (the initial lane lines are generated with the annotated starting points and ending points, the first row shows cases lane markings are occluded by vehicles, the second row shows curve lanes,and the third row shows lanes in non-flat ground plane)
Effects of output strideS. Output strideSis another main hyper-parameter for LDNet, which denotes how much the feature maps are scaled down relative to the input image size. In principle, bigger output stride represents more/higher semantic but spatially coarser.
Table 2 shows the results of LDNet with different output strideS, and the following observations. First,with the increase of output stride, the accuracy drops from 96.87% to 95.87%. Second, for a large output stride (e. g., 8), the accuracy of LDNet with initial lane generated by the annotated starting points and ending points is less than 99%. For smaller output stride(e.g.,2 and 4), the accuracy is above 99.4%. This indicates that the spatial information is much more important than the semantics information for LDNet.Third, the accuracy of LDNet with initial lane generated bySP~andEP^is much higher than initial lane generated bySP^andEP~ across all output strides. Thus,ending point location prediction is the bottleneck of implementation. More accurate ending point estimation can further improve the accuracy of the LDNet model.

Table 2 Ablation study of output stride
3.3 Results
The initial lane lines generated from detected starting points(SP~) and ending points(EP~) are illustrated in Fig.4. The results indicate that the straight line between starting point and ending point can represent the direction and range of lane, especially when the lane lines are straight (Fig.4(a-d)). This figure also indicates that the heatmap based keypoint estimation method could effectively detect the starting points,even when the starting points are occluded by vehicles.Though the vanishing point-based method could provide proper ending points in most cases, it cannot deal with the situation where the ending points are not converged together as shown in Fig.4(k).

Fig.4 Initial lane lines generated from the predicted starting points and ending points
Table 3 reports the performance comparison of the LDNet model against the previous representative method. To show the generalization of LDNet, models with Hourglass, ResNet and DLA are used as the backbone. For a fair comparison, their lane marking detection results reported in their paper or website are used directly. The proposed models are represented as “LDNet-S-B”, where S is the output stride and B denotes the used backbone. It can be seen that the proposed models with various backbones achieve comparable performance with state-of-the-art methods.
The final detected lane lines corresponding to the initial lane lines proposed in Fig.4 are illustrated in Fig.5. As the initial lane lines nearly match the straight lane lines (Fig.4(a -d)), the proposed method can detect straight lane lines precisely,even when the lanes are occluded by vehicles (Fig.5(a-d)). Although the initial lane lines do not match the target lane lines well(Fig.4(e -l)), our LDNet model still accurately predicts the offset between the initial lane line points andthe target boundary points for curve lanes(Fig.5(e-h))and lanes in non-flat ground plane (Fig.5(i-l)). Most notably,the proposed model precisely predicts the curves when they are occluded by vehicles (Fig.5(e,h)).Comparing with Fig.3(g), the predicted lane lines in Fig.5(g) are longer than the predicted lane lines in Fig.3(g) whose initial lane lines are generated from the annotated starting points and ending points. These results indicate that LDNet model has a strong ability in capturing the structures of lane markings.

Table 3 Performance of different methods on TuSimple

Fig.5 Results of LDNet with two hourglass modules and S=4
Table 4 compares proposed approach with other methods in terms of running time. The running time of proposed method is recorded with the average time for 100 runs. For 256 ×512 input images, proposed method runs at 32 FPS on a laptop with an Intel i7 2.60 GHz and GTX 1650 GPU. The performance of GTX 1080-Ti is 2. 7 times higher than that of GTX 1650[38]. The performance of Titan X is 0.81 times higher than that of GTX 1650[39].

Table 4 Run-time performance of different methods
Though the proposed model achieves comparable performance with state-of-the-art methods, it cannot predict the lane lines well in complex driving road scenarios shown in Fig.6. In these situations, the lanes are not converged together, thus the vanishing point based ending point prediction method cannot propose proper ending points and initial lane lines. How to improve the ending point prediction method and the initial lane line proposal method will be the future work.
4 Conclusion
This paper proposes to use a series of lines to represent traffic lane and proposes a novel Line Deformation Network (LDNet) to iteratively deform an initial lane line to match the lane boundary. Heatmap based keypoint estimation method and vanishing point prediction task are used to propose the initial lane lines.

Fig.6 Results of LDNet for lanes not converged together. The left figures show the ground truth and the right figures show the detected lanes.
The experimental results on TuSimple lane dataset show that the proposed method achieves comparable performance with state-of-the-art methods. The accuracy of LDNet with ideal starting points and ending points is up to 99. 4%. Although the proposed initial lane lines do not match the target lane lines well,the LDNet model still accurately predicts the offset between the initial lane line points and the target boundary points.This shows that the LDNet has a strong ability in capturing the structures of lane markings.
杂志排行

High Technology Letters的其它文章
- Multi-layer dynamic and asymmetric convolutions①
- Feature mapping space and sample determination for person re-identification①
- Completed attention convolutional neural network for MRI image segmentation①
- Energy efficiency optimization of relay-assisted D2D two-way communications with SWIPT①
- Efficient and fair coin mixing for Bitcoin①
- Deep learning based curb detection with Lidar①