Feature mapping space and sample determination for person re-identification①
2022-10-22HOUWeiHUZhentaoLIUXianxingSHIChangsen
HOU Wei(侯 巍), HU Zhentao, LIU Xianxing, SHI Changsen
(School of Artificial Intelligence, Henan University, Zhengzhou 450046, P.R.China)
Abstract Person re-identification (Re-ID) is integral to intelligent monitoring systems. However, due to the variability in viewing angles and illumination, it is easy to cause visual ambiguities, affecting the accuracy of person re-identification. An approach for person re-identification based on feature mapping space and sample determination is proposed. At first, a weight fusion model, including mean and maximum value of the horizontal occurrence in local features, is introduced into the mapping space to optimize local features. Then, the Gaussian distribution model with hierarchical mean and covariance of pixel features is introduced to enhance feature expression. Finally, considering the influence of the size of samples on metric learning performance, the appropriate metric learning is selected by sample determination method to further improve the performance of person re-identification. Experimental results on the VIPeR,PRID450S and CUHK01 datasets demonstrate that the proposed method is better than the traditional methods.
Key words: person re-identification (Re-ID),mapping space,feature optimization,sample determination
0 Introduction
The purpose of person re-identification (Re-ID)is to match the same person from different camera views[1]. Person Re-ID is a key component of video surveillance, which is of great significance in security monitoring, person search and criminal investigation.Although great progress has been made in person Re-ID, there are still many problems to be solved due to the existence of visual ambiguities.
The visual ambiguities brought by changes in viewpoint and illumination are manifested in the person images like large changes in scale and background of the same person, which can significantly degrade the performance of the person Re-ID system. To overcome this limitation, there have been studies that try to use local information and information discrimination[2-3]. Properly utilizing the information in person images and better discriminating them can effectively improve the performance of person Re-ID. The related studies that have emerged in person Re-ID can be generally classified into two types: feature extraction and metric learning.
Some researchers construct features of person images based on color, texture and other appearance attributes[4-5]. The basic idea is that the person image is divided into multiple overlapping or non-overlapping local image blocks, and then color or texture features are extracted from them separately, thus adding spatial region information into person image features. When calculating the similarity of two person images, the features within the corresponding image blocks will be compared separately, and then the comparison results of each image block will be fused as the final recognition result. Nevertheless, the features constructed by the above method are weak and the feature representation for person Re-ID is abated.
On the other hand, there are many work that use a given set of training samples to obtain a metric matrix that effectively reflects the similarity between data samples, increasing the distance between non-similar samples while reducing the distance between similar samples[6]. However, these methods do not consider the effect of sample size on the metric learning performance, making the person Re-ID results less reliable.
Color features are robust to pose and viewpoint changes, but are susceptible to illumination and obstructions. It is difficult to effectively distinguish largescale person images using only color features due to the similarity of dressing problem. The clothing often contains texture information, and texture features involve comparison of neighboring pixels and are robust to illumination, so making full use of color and texture features is very effective for person Re-ID. However, traditional methods apply single color and texture features to the person Re-ID task, and they are insufficient to handle the differences between different person images.In addition, the completeness and richness of feature representations also affect the results of similarity metrics, and traditional methods do not fully utilize the richness of samples when dealing with such metrics,resulting in lower overall performance of the methods.
To address the above problems, this paper proposes a person Re-ID method based on feature mapping space and sample determination metric learning. The method combines an improved weighted local maximal occurrence (wLOMO) feature that modifies the original LOMO[7]feature with the Gaussian of Gaussian(GOG)[8]feature, and uses a sample determination method to select a suitable metric learning method to rank the similarity of person images. The method in this paper performs simulation experiments on each of the three typical datasets and is compared with other methods. The main contributions are summarized as follows.
(1) A fused feature mapping space is proposed to enhance the person images features. The mean information of the horizontal direction of person image is introduced into LOMO feature, and the weighted mean and max are fused to obtain the proposed wLOMO feature. To enhance the feature expression of each person image, wLOMO feature is combined with GOG feature.On this basis, in order to simplify the complexity of feature extraction model, the feature transformation processes of wLOMO and GOG are integrated into one feature mapping space.
(2) A sample determination method is proposed to accommodate different sample sizes. In the dataset,the sample determination method selects the appropriate metric learning to accomplish the similarity ranking of person images according to the demand of different sample sizes. In addition, the selected sample size is dynamically tuned according to the matching rate of different metric learning outputs.
(3) Extended experiments on three publicly available datasets are designed to evaluate the performance of the proposed method and the comparison method, and to demonstrate the effectiveness and applicability of the proposed method in person Re-ID.
1 Related work
The research on person Re-ID can be divided into two groups: feature extraction and metric learning.Person Re-ID based on feature extraction is usually constructed by basic color, texture and other appearance attributes. Ref.[2] proposed the symmetry driven accumulation of local feature (SDALF) based on the symmetrical and asymmetric characteristics of person body structure, which fused three kinds of color feature in person image to complete the discrimination of person image. Ref.[4] proposed an ensemble of localized features (ELF) method. The method adopted AdaBoost algorithm to select the appropriate feature combination from a group of color and texture features,which improved the experimental accuracy. Refs[5,9,10]introduced biologically inspired features (BIF) in person images. By calculating the characteristics of BIF on adjacent scales, a feature called Bicov was proposed. On this basis, Gabor filter and covariance feature were introduced to deal with the problems caused by illumination change and background transformation in person images. Ref.[11] proposed a feature transformation method based on Zero-Padding Augmentation, which could align the features distributed across the disjoint person images to improve the performance of the matching model. Ref.[12] constructed the feature fusion network (FNN) by combining the manually extracted features and deep learning features, and realized the fusion of deep learning features and artificial features by constantly adjusting the parameters of the deep neural network. Ref.[13] proposed a deep convolution model, which highlights the discriminative part by giving the features in each part of the person a different weight to realize the person Re-ID task. The person Re-ID method based on deep learning needs to consider using a large number of labeled samples to train a complex model, and the training process is very time-consuming.
Person Re-ID methods based on metric learning minimizes the distance between similar person by learning appropriate similarity. Ref.[3] introduced the concept of large margin in Mahalanobis distance and proposed a metric learning method called large margin nearest neighbor (LMNN). LMNN assumed that the sample features of the same class were adjacent, so there was a big gap between the feature samples of different classes. Thus, when calculating the distance,the features of the same kind of samples were gathered,and the different types of samples were pushed. Ref.[6]proposed a local fisher discriminative analysis (LFDA)method, which introduced a matrix based on subspace learning, allocated different scale factors for the same classes and different classes, and used the local invariance principle to calculate the distance. Ref.[14]proposed a Mahalanobis distance metric called keep it simple and straightforward metric (KISSME) by calculating the difference between the intra class and inter class covariance matrices of sample features. The method did not need to calculate the metric matrix through complex iterative algorithm, so it was more efficient. Ref.[15] used a new multi-scale metric learning method based on strip descriptors for person Re-ID. According to this method, the internal structure of different person images can be effectively extracted,improving the recognition rate. However, due to the non-linearity of the person image in the cross field of view, the linear transformation generated by the general metric learning method effects commonly general.Therefore, the kernel correlation based metric learning method was introduced to solve the nonlinear problem in person Re-ID[16-17]. However, the above-mentioned methods adopt a single strategy to deal with the change of sample size, without considering the accuracy impact of the method itself.
2 Problem description
It considers that the general process of person rerecognition is to extract features first and then rank them by metric learning. The performance of the method depends strongly on the expression ability of features and metric learning, and the existence of visual ambiguities will inevitably affect the ability. To solve this problem, a new method is proposed to improve the matching rate of person re-recognition.
The framework of the proposed method is divided into three parts in Fig.1. The first part is the extraction of basic color, texture and spatial features, the second part is the mapping process of basic features, and the third part is the metric learning method based on sample determination.
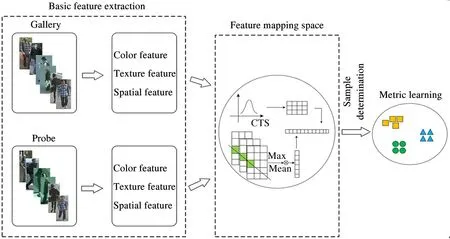
Fig.1 The person re-identification framework
3 Methodology
Based on the wLOMO in subsection 3.1 and the proposed sample determination in subsection 3.2, the proposed method flowchart is shown in Fig.2.
3.1 Feature mapping space
When designing the feature mapping space, two state-of-the-art feature transformation processes are merged into one feature mapping space by cascading,which simplifies the feature extraction.
3.1.1 LOMO
When extracting LOMO features, a 10 ×10 sliding subwindow is used to represent the local area of a person image,and an 8 ×8 ×8 bin combined color histogram of the hue, saturati, value (HSV) and two scale the scale invariant local ternary pattern (SILTP)texture histogramFSILTPare extracted from each subwindow. Then the maximum value of pixel features occurrence of all subwindows at the same horizontal position is calculated as

whereρ(•)is the pixel feature occurrence in all subwindows.
3.1.2 The proposed wLOMO
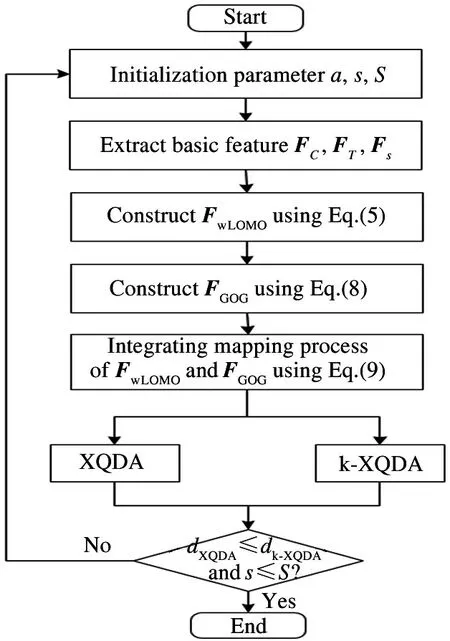
Fig.2 Flowchart of the proposed method
Considering that the maximization of pixel features leads to the loss of some person features,and the clothes worn by person are often composed of a small number of colors in each part, the mean information can enhance the feature expression of person images when the person background changes little. Therefore, the mean information of pixel feature distribution is introduced into the feature expression, expressed as
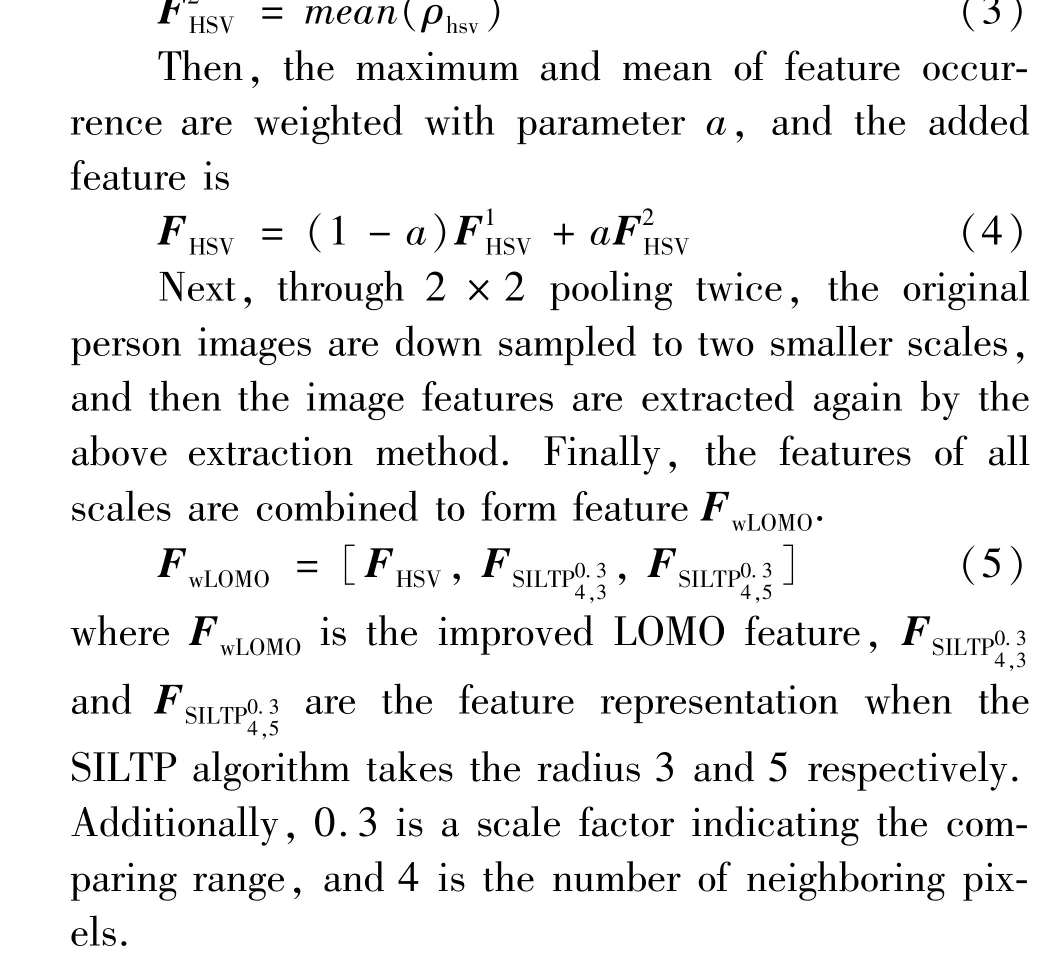
3.1.3 GOG
Considering that color features are more sensitive to illumination changes in cross view person images,and the impact of spatial information loss on person Re-ID, this paper further extracts GOG features from the same person image to enhance the feature expression.Firstly, the pixel level featurefis extracted as
f= [y,FMθ,FRGB,FHSV,FLAB,FRG]T(6)
whereFRGB,FHSV,FLAB,FRGare the color features,FMθis the texture feature,yis the space feature. The color features are channel values of person image,Mθconsists of the values of pixel intensity gradients in the four standard directions of the two-dimensional coordinate system.yis the position of the pixel in the vertical direction of image. After that, block level features are extracted. Each person image is divided intoGpartially overlapped horizontal regions, and each region is divided intok×klocal blocks. The pixel features in each local blocksare represented by Gaussian distribution to form a Gaussian blockzi
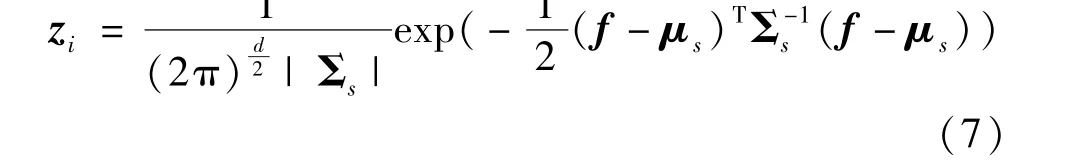
whereμsis the mean vector,Σsis the covariance matrix of blocks.
Then, the Gauss blockziis mapped to symmetric positive definite matrix to complete block level feature extraction. Finally,the region level features are extracted. The Gaussian blocks are modeled as a Gaussian region by Gaussian distribution. Meanwhile, Gaussian region is embedded into symmetric positive definite matrix. These vectors are finally aggregated to form the GOG featureFGOGof a person image.

wherezGis theG-th horizontal region feature of a person image.
3.1.4 Feature mapping space
The proposed wLOMO describes only maximum occurrence and mean occurrence of pixel features, moreover, GOG can provide covariance information.
To comprehensively consider the maximum occurrence, mean occurrence and covariance information of pixel features, Eq.(5) and Eq.(8) are combined. It means that wLOMO feature and GOG feature are aligned according to the person’s identity, and their feature mapping process is simplified to one feature mapping space by cascading.

whereFis the feature of the output of the mapping space.
3.2 Sample determination
Cross-view quadratic discriminant analysis (XQDA)[7]and kernel cross-view quadratic discriminant analysis (k-XQDA)[18]are state-of-the-art methods in depending on feature dimension and samples size respectively. Based on the two methods, a sample determination method is proposed to synthesize the advantages of the two methods.
3.2.1 XQDA
Before summarizing the XQDA method,a brief introduction is given to the distance measurement of person Re-ID. For a datasetX, it containsCclasses personci(1 ≤i≤C) ∈Rn.The classical Mahalanobis distance metric learns the distanced(xi,zj) between personxi= [xi1,xi2,…,xin] in cameraaand personzj=[zj1,zj2,…,zjm] in camerab.
3.2.2 k-XQDA
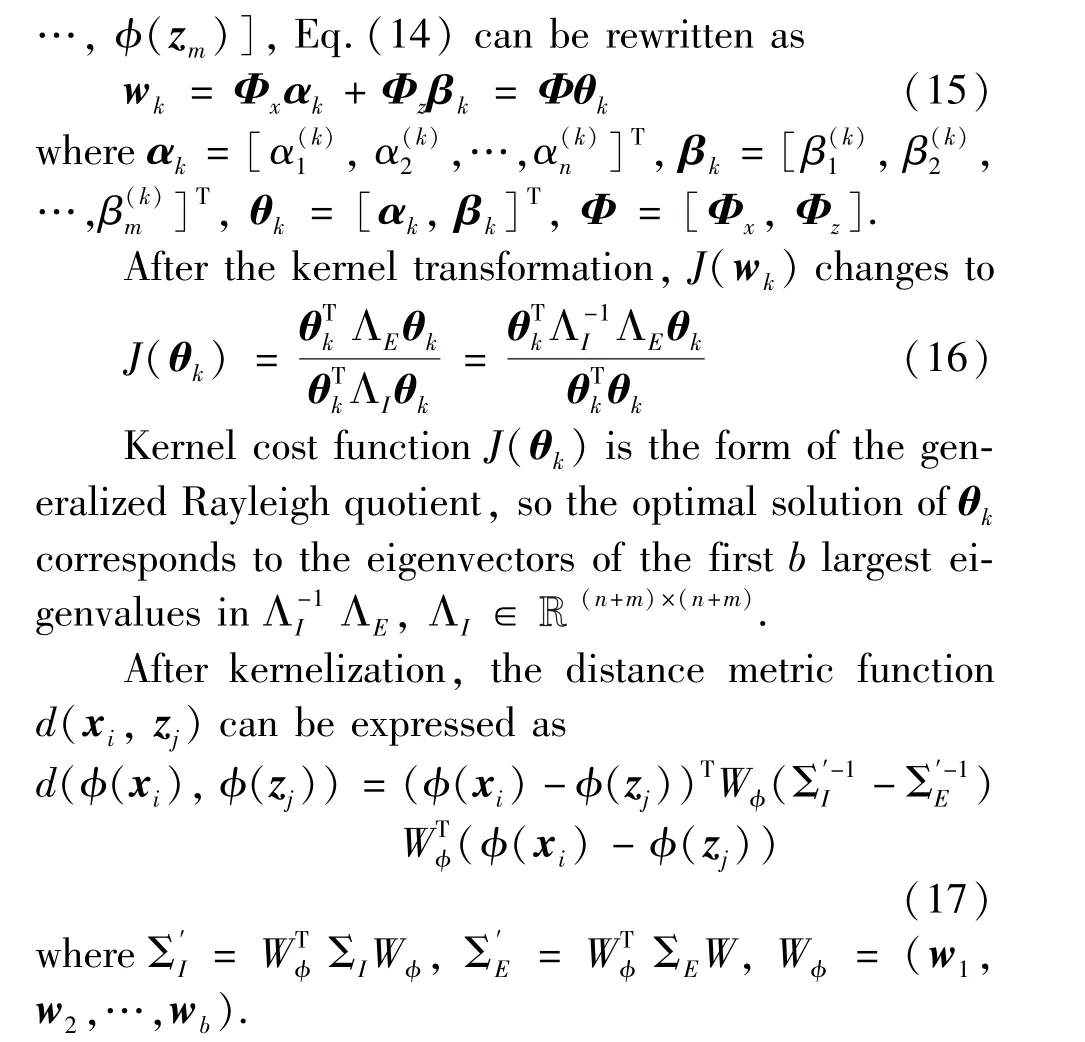
XQDA metric learning method is directly trained in the original linear feature space, and the similarity and difference among samples are not well expressed.k-XQDA uses a kernel function to map the original samples into the easily distinguishable nonlinear space,and then distinguishes the differences of samples in the nonlinear space. The derivation of k-XQDA method involves mainly the distance metric functiond(xi,zj) in XQDA and the kernelization of the cost functionJ(wk).
In the kernel space, two kinds of expansion coefficientsαandβcorresponding to person in cameraaandbare used, respectively. Mapping matrixwkcan be expressed as
3.2.3 Sample determination
All the intrinsic matrix dimensions of k-XQDA method depend on the size of samples, which greatly reduces the amount of calculation compared with the XQDA method depending on the feature dimension.
On the basis of subsection 3.2.1 and subsection
3.2.2, considering the different focus of the two metric learning methods, in order to integrate the advantages of the two and make the actual person re-identification task a better match, this paper proposes a sample determination method, that is, when the size of training setSsatisfies the Eq.(18), using the corresponding metric learning method will make a better effect in the corresponding dataset.
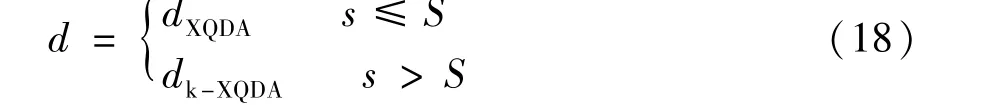
whereSis the sample size to be determined,sis the current sample size.
4 Experiments
To evaluate the performance of the method fairly,all the comparison methods run in the same environment. The hardware environment is Intel Core i7-9700F CPU@3.00 GHz, 8 GB RAM. The operating system is Windows 10 64 bit, and the software environment is Matlab 2019b.
4.1 Datasets and evaluation protocol
The effectiveness of the proposed method is demonstrated by three publicly available datasets, they are VIPeR[19], PRID450S[20]and CUHK01[21]. The VIPeR dataset contains 632 persons with different identities. Each person involves two images captured from two disjoint camera views, including variations in background and illumination. The PRID450S dataset contains 450 persons with different identities. Each person covers two images captured by two non-overlapping cameras with a single background. The CUHK01 dataset consists of 971 persons with a total of 3884 shots captured by two non-overlapping cameras with an average of two images for each person, and the person poses vary greatly.
To evaluate the results of the features in different metric learning,cumulative match characteristics(CMC)curve is used as the evaluation protocol.
4.2 Comparison with state-of-the-art
All images are normalized to the same size of 128×48 pixels. The datasets of VIPeR, PRID450S and CUHK01 are randomly divided into two equal parts,one half for training and the other for testing. The size of images in the training set of the three data sets is 632,450 and 972 respectively. To eliminate the performance difference caused by randomly dividing the training set and the testing set, the process is repeated 10 times, and the average cumulative matching accuracies at rank 1, 5, 10 and 20 are reported over 10 runs. In addition, the corresponding CMC curves are shown.
4.2.1 Evaluation of the mapping space
To analyze the effectiveness of the proposed mapping space, the output features of the mapping space are sent to the XQDA metric learning method to verify the performance of the method. Since the method is iterative, different weights are looped in different datasets to retain the one with the highest performance.Furthermore, showing the Rank-1 values corresponding to various weights may indicate that the weights are not constant and change between datasets. This paper selects three different datasets and compares the results with state-of-the-art approaches.
VIPeR dataset: to analyze the influence of weightaon the performance of the wLOMO, the Rank-1 under different weight on VIPeR dataset are shown in Fig.3. It can be seen the introduction of mean information has a certain impact on the method performance. Whenais in range of 0.1 -0.2, the performance of the method is optimal, and increasingacontinually the performance of the method declines.
The compared methods and their matching rates on VIPeR are shown in Table 1 and Fig.4. The results are reported in Table 1, the Rank-1 of LOMO, LSSCDL, DNS and GOG are better, all exceeding 40%.The proposed approach achieves 50.63% in Rank-1,which is 2.37% better than GOG.
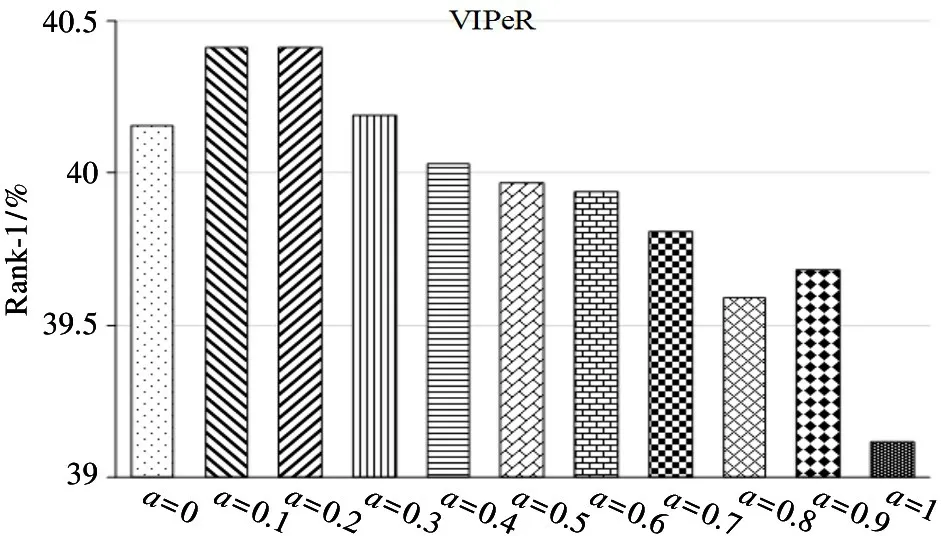
Fig.3 Rank-1 matching rates
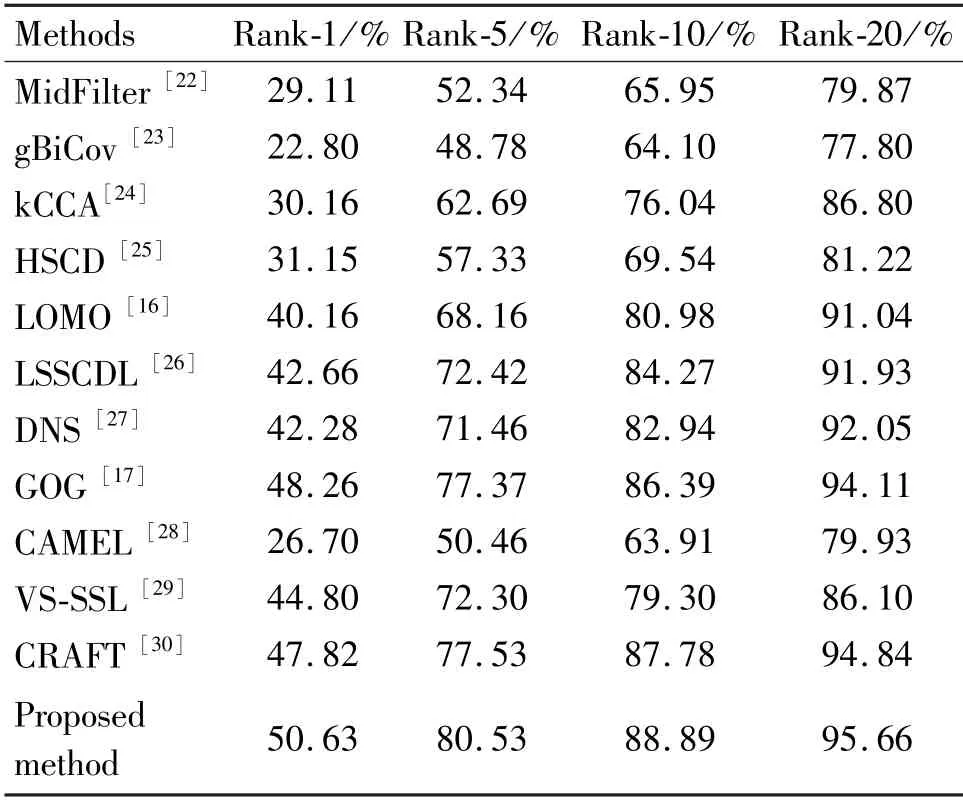
Table 1 Comparison of Rank results with other methods on VIPeR dataset
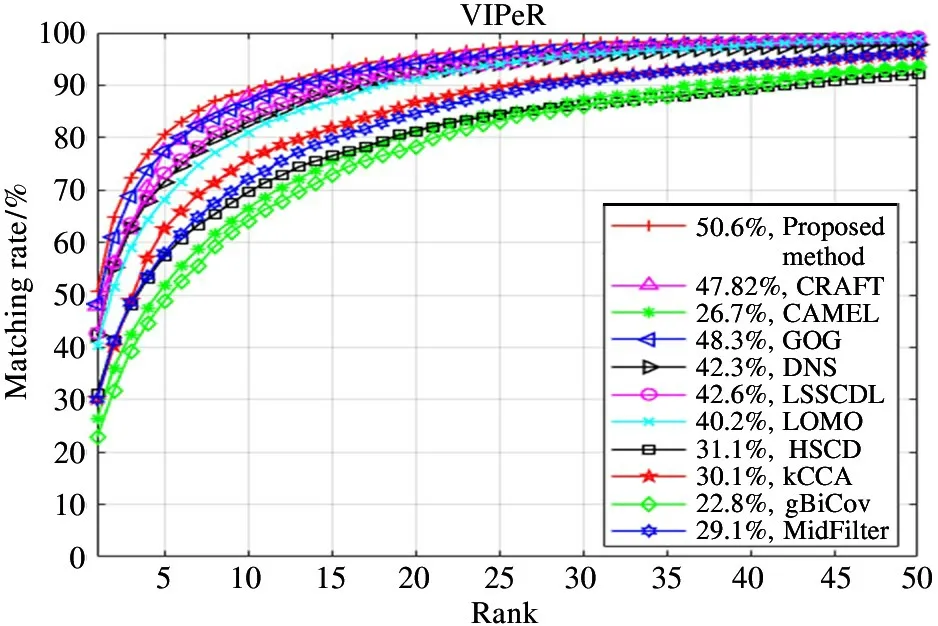
Fig.4 CMC curves
PRID450S dataset: Fig.5 shows the performance comparison of the wLOMO under different weight values. When the weight value is 0.3 -0.4, the method performance is optimal.
The comparison methods and their matching rates results on PRID450S dataset are shown in Table 2 and Fig.6. Different from the person images in VIPeR and CUHK01 datasets, the background of person images in PRID450S dataset is relatively simple, and the background interference to all methods is small, the final matching results are generally better. For the proposed method with mean information, the matching rate of Rank-1 is 71.42%, outperforming the second best one GOG by 3.6%.
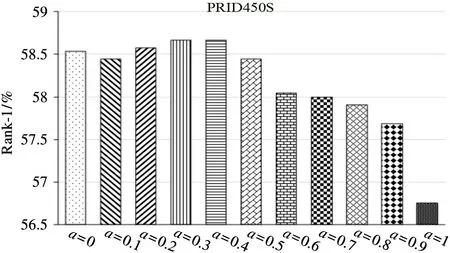
Fig.5 Rank-1 matching rates
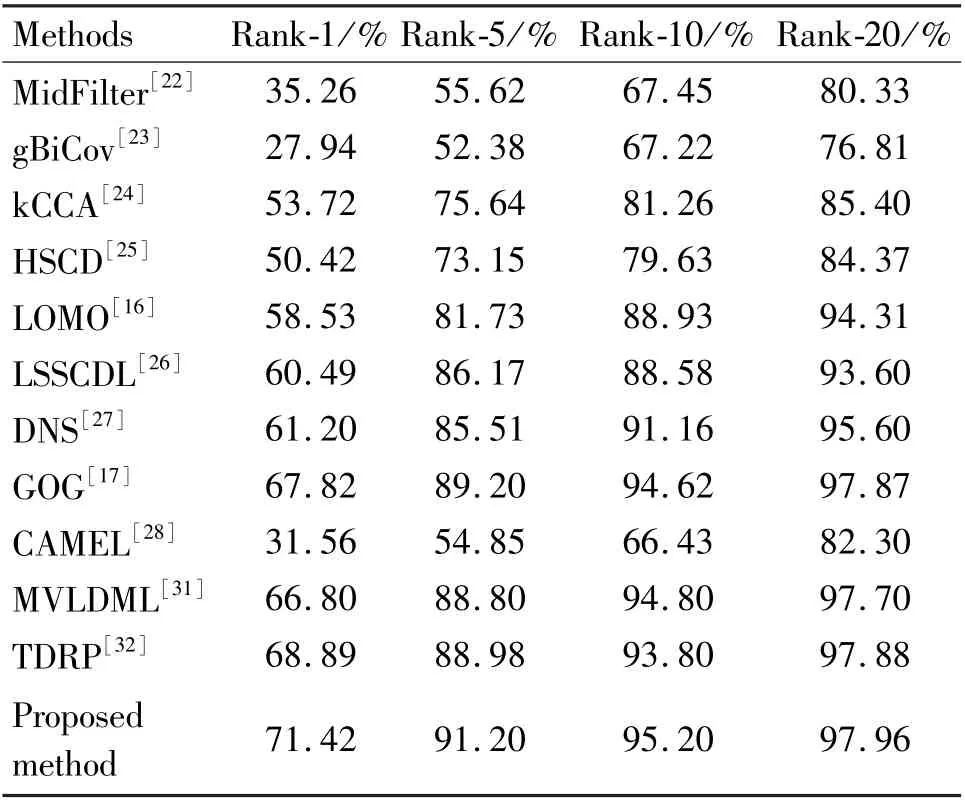
Table 2 Comparison of Rank results with other methods on PRID450S dataset
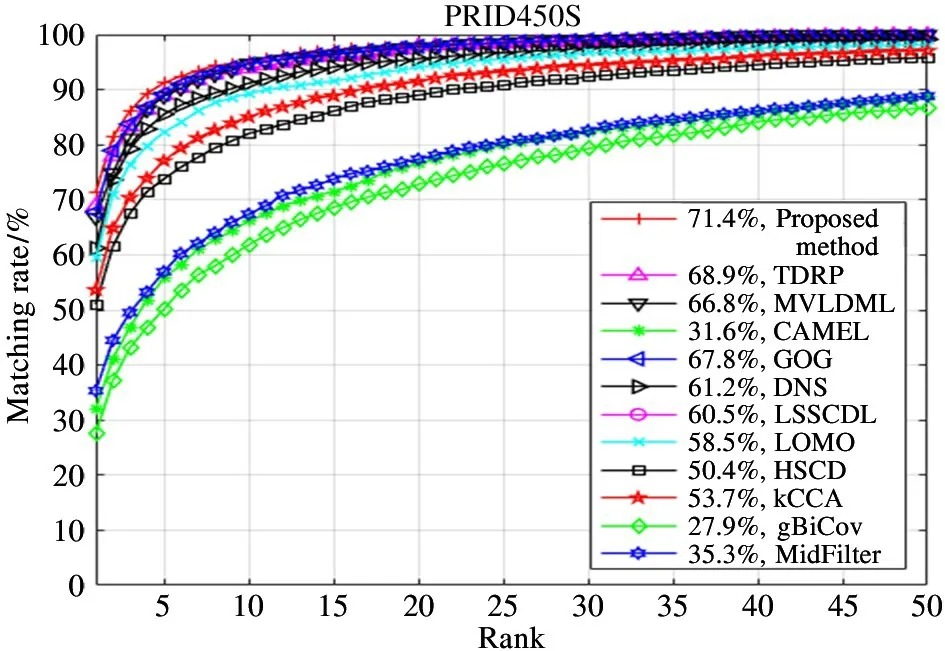
Fig.6 CMC curves
CUHK01 dataset: the performance of the wLOMO has been declining withaincreasing, because the person background information is more complex than the first two datasets in Fig.7, and the introduction of mean information leads to performance degradation.Thus, the combination with GOG can strengthen the feature expression and weaken the error caused by mean information.
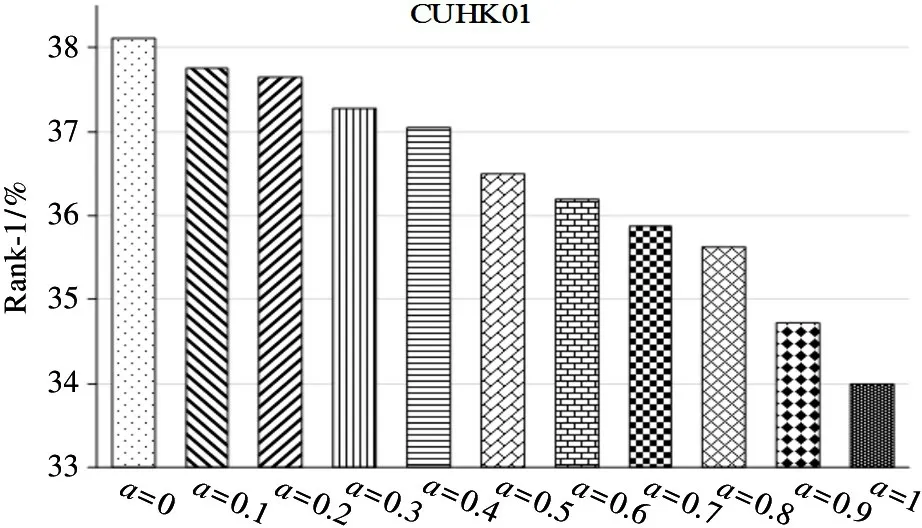
Fig.7 Rank-1 matching rates
The compared methods and their matching rates on CUHK01 dataset are shown in Table 3 and Fig.8.Considering that each person in the CUHK01 dataset contains four images, the first two images contain one front/back view, the last two images contain one side view, and the overall difference between them is little.Therefore, in the experiment, one is randomly selected from the foreground and background images of each person, and one is randomly selected from the side images of each person. The training sets contain 486 pairs of person images, and the test sets contain 485 pairs of person images. As listed in Table 3,the performance of proposed method is better than other methods,outperforming the second-best method with improvements of 5.65%.
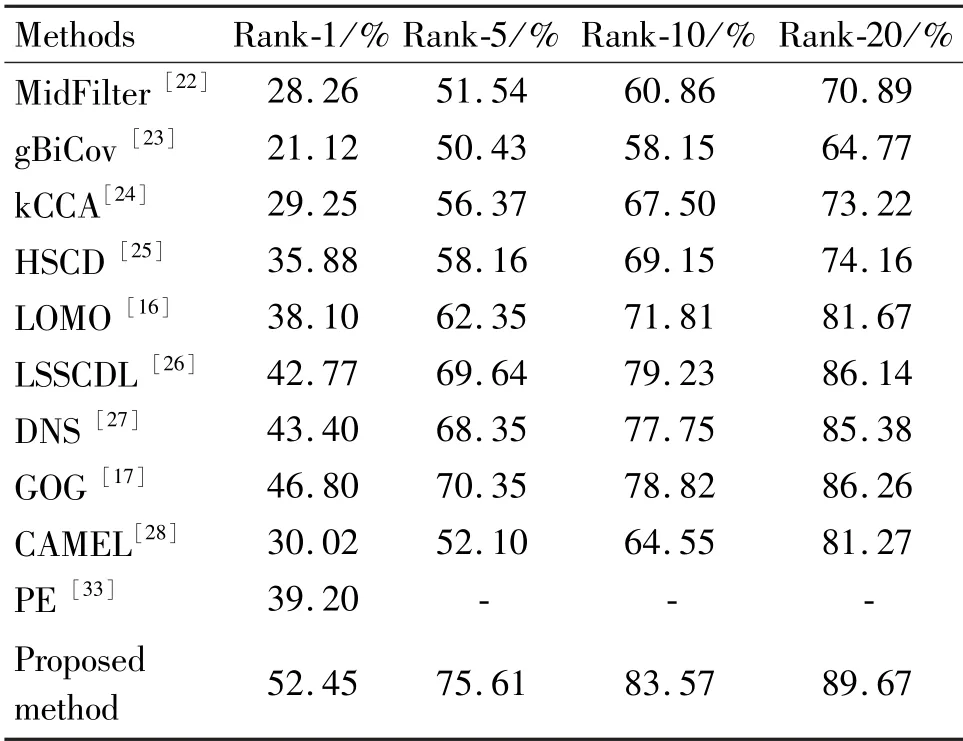
Table 3 Comparison of Rank results with other methods on CUHK01 dataset
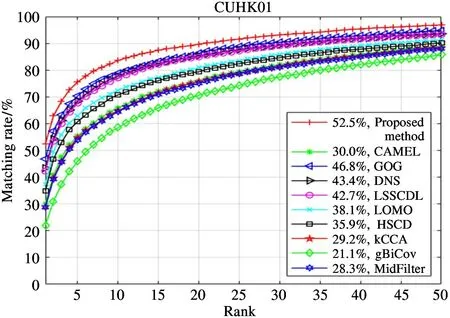
Fig.8 CMC curves
4.2.2 Evaluation of the sample determination
The proposed method has achieved state-of-the-art performance, with inputting the output features of the mapping space into XQDA in the above experiment.Then,in order to verify the effectiveness of the proposed sample determination method, the output features of the mapping space are sent to XQDA and k-XQDA respectively to compare the performance of the methods.The experiment results are shown in Table 4, Table 5 and Table 6, in which the size of samples is the number of sample.
VIPeR dataset:in Table 4,when the size of training set samples is gradually increased, Rank-1 of the two metric learning methods is also increasing during the experiment on the VIPeR dataset. According to the Rank-1, the matching rate of XQDA is greater than that of k-XQDA even with the increase of training set samples. However, the increase of XQDA is 6. 87%and 15.3%, the increase of k-XQDA is 7.97% and 16.93%. The increase extent of k-XQDA is greater than that of XQDA. Thus, when the size of training set samples increases to a certain size, k-XQDA can show better accuracy than XQDA.
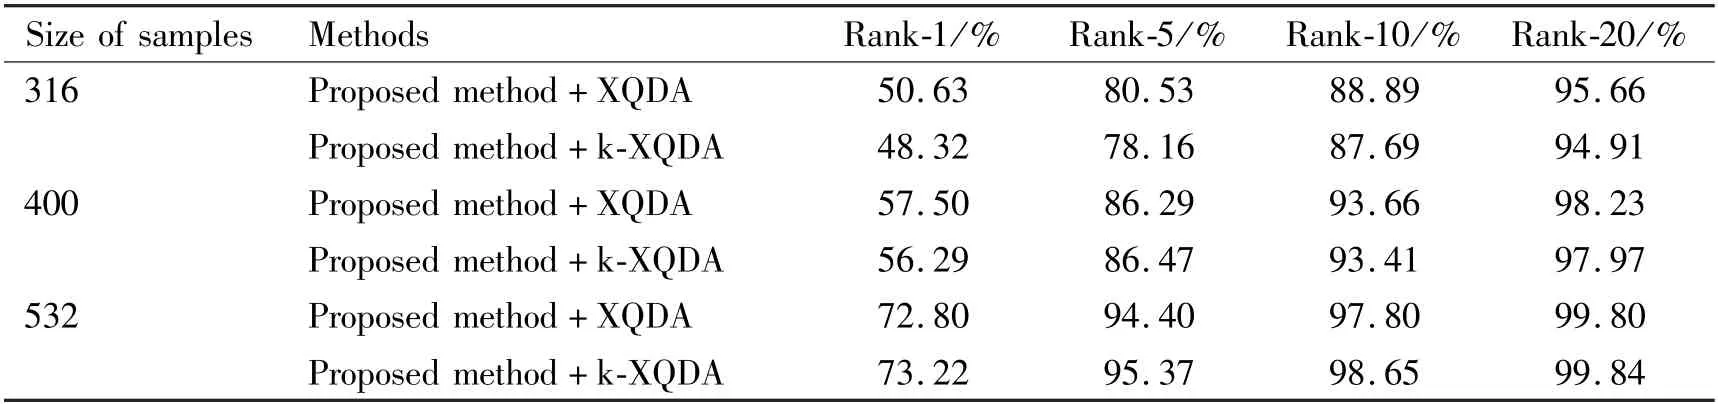
Table 4 Ranks matching rates versus different size of samples on VIPeR dataset
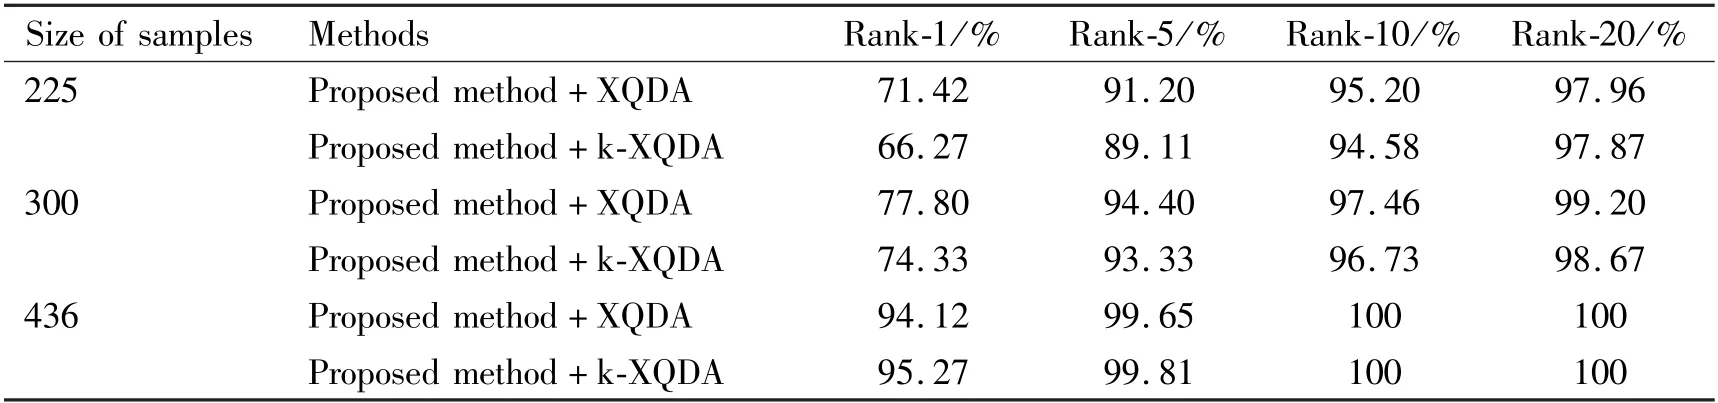
Table 5 Ranks matching rates versus different size of samples on PRID450S dataset
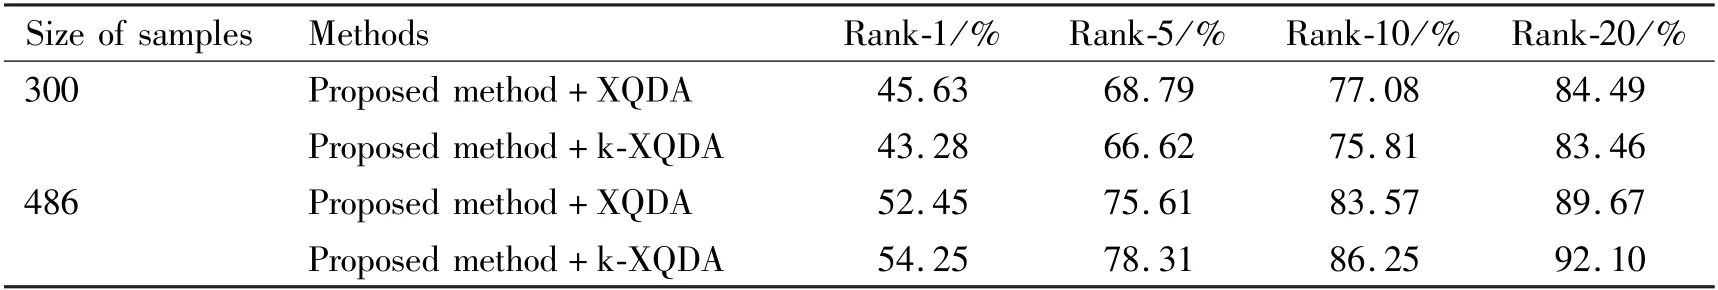
Table 6 Ranks matching rates versus different size of samples on CUHK01 dataset
PRID450S dataset: when the size of samples in the training set increases from 225 to 300 and 436, the Rank-1 of XQDA is better than that of k-XQDA,reported in Table 5. In terms of the extent of Rank-1 increases, XQDA increases by 6.38% and 16.32%, k-XQDA increases by 8.06% and 20.94%. According to the experiment results on PRID450S dataset, when the size of training sets increases to a certain size, the Rank-1 of k-XQDA can exceed that of XQDA.
CUHK01 dataset: the output features of the mapping space are calculated by XQDA and k-XQDA respectively on CUHK01 dataset. When the size of training set samples is 486,the Rank-1 of k-XQDA exceeds that of XQDA by 1.8%, reported in Table 6.
In summary, when the size of training set samples is about 532, the performance of k-XQDA is better than that of XQDA in Table 4. Here, the k-XQDA can obtain better results. When the size of training sets is less than 532, the performance of XQDA is better than that of k-XQDA. On PRID450S dataset, when the size of training set samples is bigger than 436, the performance of k-XQDA method is better than that of XQDA method, and better results can be obtained by using k-XQDA. When the size of training sets is less than 436, the performance of XQDA is better than that of k-XQDA in Table 5. According to the results in Table 6,when person Re-ID is conducted on CUHK01 dataset,the size of training set samples is about 486, k-XQDA can obtain good results.
5 Conclusion
Based on multi-feature extraction,an effective feature mapping space and a sample determination method is proposed to solve the problem of visual ambiguities in person re-identification. The feature mapping space simplifies the process of complex feature extraction,which takes the basic features in person images as input and outputs the mapped features through the feature mapping space. The mapped features are discriminated by the proposed metric learning method to complete the similarity ranking. Compared with the existing correlation methods, the proposed method improves matching rate effectively. In the future, it is proposed to further study the determination method of metric learning and optimize the performance of the algorithm.
杂志排行

High Technology Letters的其它文章
- Analysis of force and leakage in water hydraulic motor’s piston pairs①
- Numerical investigation on damping coefficient of the integral squeeze film damper①
- LDNet: structure-focused lane detection based on line deformation①
- Multi-attention fusion and weighted class representation for few-shot classification①
- Deep learning-based time-varying channel estimation with basis expansion model for MIMO-OFDM system①
- Research on will-dimension SIFT algorithms for multi-attitude face recognition①