Testing of new ionospheric models along the meridian 110° E over the Northern Hemisphere
2022-10-18OlgaMaltsevaArtemKharakhashyanTatyanaNikitenko
Olga Maltseva, Artem Kharakhashyan, Tatyana Nikitenko
Institute for Physics, Southern Federal University, 344090, Russia
Keywords:Ionosphere Modeling Total electron content Critical frequency Meridian 110° E
ABSTRACT Despite the continuous improvement of the widely used empirical model international reference ionosphere (IRI), the recently appeared new models must be tested worldwide. Testing along the meridians has the advantage of dealing with the latitudinal dependent parameters. This paper uses new models of parameters foF2 (critical frequency), TEC (total electron content), and τ (equivalent slab thickness of the ionosphere), which are of great importance for evaluating the effects of space weather.IRI-Plas, NNT2F2, and NTSM models were tested using data from 6 ionosondes located along the meridian 110° E in March 2012.It is shown that the IRI-Plas model provides the closest values to experiment with respect to τ,while the NTSM model provides a rather limited reflection of the latitude dependence.Analyses of foF2(NNT2F2) have shown that, the NNT2F2 model provides good conformity with experimental values in this area, but it is very dependent on the TEC processing method. The latitudinal dependences of foF2 obtained with TEC and polynomial dependence τ(Appr) showed the presence of positive deviations from medians not only during disturbances but also quiet periods, longitudinally at the meridian.
1. Introduction
A brief history of almost a century of ionospheric research is presented in Ref.[1].It is noted that from the very beginning,there was a connection between scientific ionospheric research and applications due to the need for operational capabilities that could monitor and forecast ionospheric conditions. Currently, this connection is made through understanding: (a) the spatial and temporal morphology of the ionosphere and thus how this slows and refracts radio signals as they pass through the ionosphere, (b)the properties, and generation of, ionospheric irregularities that can diffract and scatter radio signals leading to unexpected variations in signal phase and amplitude. It is important and difficult to promote the results of scientific research into applications.This connection primarily applies to ionospheric models and supports their validation under any conditions, in particular, when using missing or poor-quality data. Ionospheric models provide specific application areas such as radio propagation,navigation and telecommunications, direction finding and radio location, remote sensing, etc.
From the shortwave propagation point of view, the most important parameter is the critical frequency of the F2 ionospheric layer,foF2.Global ionosphere maps of total electron content(TEC)have been used to monitor and model the ionosphere for a long time[2].The advantage of using TEC is its high temporal resolution.Another parameter can be considered the shape of the vertical electron density profile, which reflects the complexity of production, loss, and transportation of plasma in the Earth's ionosphere.The equivalent slab thickness τ, defining this shape, is very sensitive to the competition of plasma driving forces such as thermospheric winds and electric fields [3].
The most widely used models for the ionosphere are the IRI and IRI-Plas models.The IRI model is the standard model recommended by both the Committee on Space Research (COSPAR) and the International Union of Radio Science (URSI), and also by the International Telecommunication Union (ITU). The latest version is IRI-2016 [4]. In April 2014, IRI became the official International Standardization Organization (ISO) standard for the ionosphere. IRI represents monthly averages of electron and ion densities and temperatures in the altitude range of 50 km-2000 km. It also provides the vertical total electron content (TEC) from the lower boundary (60-80 km) to a user-specified upper boundary. Good progress has been made in the development of an IRI Real-Time model. Among several options, the authors consider the IRI Real-Time Assimilative Modeling (IRTAM) system developed [5] and based on data assimilation of the GIRO ionosonde network, to be the most successful. The IRI-Plas model is the international Standard Plasmasphere Ionosphere Model (SPIM) in the framework of of the ISO projects, which is based on the IRI and merges the Russian Standard Model of Ionosphere (SMI) up to 20,000 km for altitude at any longitude,geodetic latitude from 80°N to 80°S,for any time of a day,any day of a year,a wide range of the solar activity indices [6]. However, there is some difference between them: the IRI model is the most tested.The IRI-Plas model has not been tested enough.Among the works devoted to testing the IRI-Plas model,it is necessary to indicate the paper[7]in which foF2 was determined using TEC.
The last review of physics-based and empirical models and their use is given [8].The authors also review their papers on modeling the ionospheric parameters NmF2, hmF2, TEC and combine them into the Neustrelitz Electron Density Model (NEDM2020) developed for trans-ionospheric applications.In the given paper,we use the model τ of these authors [9], which includes their Neustrelitz TEC model (NTCM) [10] and Neustrelitz Peak Density Model(NPDM) [11].
The most important task is determining foF2 using TEC (e.g.,[12]). The parameter τ allows for determining the values of foF2 since it is a proportionality factor between TEC and NmF2. An alternative is to use neural networks.This approach is implemented in the paper [13].
This brief overview shows that modeling ionospheric parameters are an important process for both scientific research and practical applications. Traditionally, the most attention has been focused on modeling and testing parameters such as the critical frequency foF2 and the total electron content TEC. More recently,the ionospheric equivalent slab thickness τ has received much attention [9,14-16]. In this paper, these three parameters are considered, all of which have their own values, meanwhile, they also correlate with the possibility of foF2 determination using TEC.Methods for foF2 determination using TEC have been developed very intensively in recent years (e.g., [17-21]). The methods used by τ and neural networks stand out among them.The global models are considered of primary importance. Only two models are proposed to simulate the parameter τ[9,14].There are great prospects for assimilation in the model [22] with the model [14]; however,there is not still a very good conformity between the model and experimental values of τ,as shown in Ref.[23].The NSTM model[9]has a simple algorithm which can be successfully tested with any ionosonde data. The global NNT2F2 model, which uses neural networks and can determine foF2 from TEC data, is proposed[13].To calculate TEC, the Gopi Seemala computer program (https://seemala.blogspot.com) [24] was used [13]. This model is based on data from 52 pairs of ionosonde-GNSS receiver stations from 2000 to 2016. The paper is based on the high correlation between TEC and foF2. The most important result shows that this correlation is weakly dependent on the Dst index [13]. The existing empirical ionospheric models, e.g.,IRI[4], and IRI-Plas[6,25], also allow one to determine foF2, TEC, and τ parameters on a global scale. In the paper [26], experimental median τ(med) was used to study the ionospheric response in the period of March 6-17, 2012 disturbances at 110°E meridian, and values of τ(med) and τ(IRI) were compared.It was shown that the IRI model weakly reflects diurnal variations of τ and does not reflect latitudinal dependence. The model τ(IRI-Plas) and the new model τ(NSTM) are tested in this paper. The study is also made for 110°E meridian to assess the latitudinal dependence of τ, which will allow evaluating not only latitudinal variations of τ, but also foF2 variations obtained using polynomial approximation of τ and TEC at meridian.There are few meridians along where the ionosondes are located. The 110°E meridian is one of them.Additionally,the NNT2F2 model is tested and the foF2 response to the end of March 2012 disturbance is studied.
2. Experimental data and models
In this paper, we used data for 6 main stations [26]; their geographical and geomagnetic coordinates are given in Table 1.
The foF2 data were taken from the IZMIRAN website (https://www.izmiran.ru/ionosphere/weather/foF2). The values of ionospheric maps constructed by Jet Propulsion Laboratory (JPL) and the Center for Orbit Determination in Europe (CODE) were calculated using the IONEX files (ftp://cddis.gsfc.nasa.gov/pub/gps/products/ionex/) in 2-h steps at the 110°meridian in the range of 20°N-62.5°N,covering the latitudes of 6 ionospheric stations,and other specific stations.
The IRI-2016 model parameters were calculated online on the website (https://ccmc.gsfc.nasa.gov/modelweb/models/iri2016_vitmo.php) using default options. The IRI-Plas model parameters were calculated online on the site (http://www.ionolab.org/index.php?language=en). Dst and AE data were selected on the site(http://wdc.kugi.kyoto-u.ac.jp/wdc/Sec3.html). IMF and Np data were selected on the site (http://omniweb.gsfc.nasa.gov/form/dx1.html). For τ(med) and the polynomial approximation τ(Appr), the values obtained in Ref. [26] were used. The observational median τ(med) is used to determine the reconstructed value foF2(rec) = TEC (obs)/τ(med). The values of τ(NSTM) are calculated according to the algorithm [9]. To calculate foF2 according to the NNT2F2 model, the MATLAB file named “NNT2F2.m” was used to determine Y = NNT2F2(X). The columns of X should contain the eight inputs of the neural network in the following order:TEC,LTs,LTc, DOYs, DOYc, SSN, latitude, and longitude, Y = NNT2F2(X),X =TEC,LTs,LTc,DOYs,DOYc,SSN,latitude,and longitude.LTs and LTc are calculated by equations (4a, 4b); DOYs and DOYc by equations (5a, 5b), and cos is used in the equation (5b) [13].
The first comparison results for specific ionosondes using the JPL map overestimated the observational foF2. Some discrepancies can be attributed to the fact that the ionosonde foF2 data were averaged in the method [13] to obtain 1 - hr values. In this work, values for specific hours were used. However, it has been suggested that the difference between the values of the JPL maps and the values calculated by the Seemala program makes somesense. Whereas the values of the different IGS maps have the potential to vary widely(e.g.,[27,28]),they were calculated using the CODE map, whose values are in most cases numerically smaller than the TEC (JPL) map, to test this hypothesis. The Okinawa station is located close to one of the stations on the selected meridian.Fig.1a shows the foF2 calculated using the TEC(JPL)and TEC(CODE) at Okinawa station, for comparison with the foF2 of figure 4 from Ref. [13].
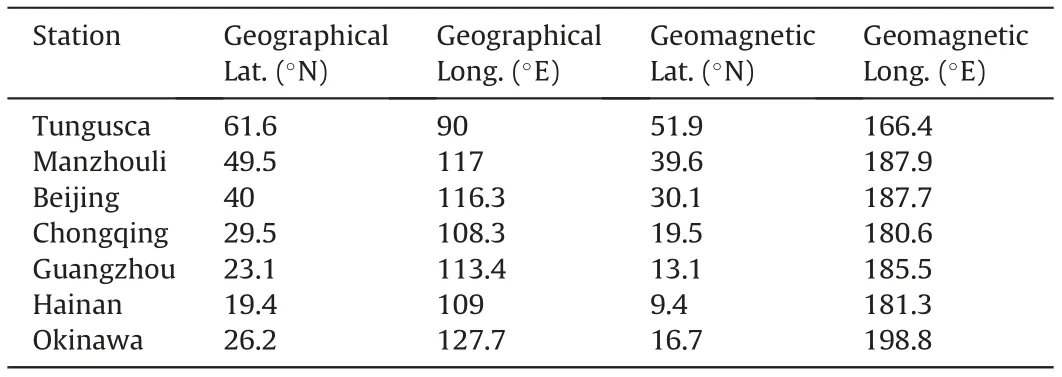
Table 1 Coordinates of 7 stations under consideration.
It is seen that the observational values are constant in the first half of the day,giving large deviations from the model values.This is due to the fact that a magnetic storm with a minimum of Dst=-61 nT occurred on March 1,and its recovery phase took hold on March 5. This is confirmed by Fig. 1b, which shows TEC (obs)along with the median. It is seen that constant TEC values are observed on the morning of March 5,and the program has correctly reflected what appears to be an average situation.For figure 4 from Ref.[13],Table 2 shows the monthly mean statistical characteristics of the fit of observed and model foF2 values calculated for TEC of the two JPL and CODE maps: |Δ| (MHz) - absolute deviation, σ(MHz)-variance,σ(%)-relative deviation.The top line shows the numbers of variables together with the station legends. In Table 2 the variables refer to corresponding ionosondes: (a, OK426 - Okinawa), (b, LM42B - Learmonth), (c, LG178 - Longyearbyen), (d,THJ77 -Thule), (e, HE13N - Hermanus), (f, LV13P - Louisvale). The second line indicates the type of maps.
It is seen that the CODE map has some advantage; however, in some cases (a and f), an approximate equality is observed, and in the case of e, the JPL map has an advantage. As the difference in values of the two maps is not so great,all further calculations were carried out for the two maps.
3. Results of testing models τ
The values of τ(med) for 6 stations at the 110°E meridian and the model τ(IRI) were compared [26], which did not show latitudinal variations inherent in τ(med). This paper additionally compares τ(med),τ(IRI-Plas),and τ(NSTM).The comparison results are given in Fig. 2. All τ values are monthly medians.
It is seen that the results for the IRI-Plas model are closest to the real values.The model τ(NSTM)is closer to reality than τ(IRI).This indicates that in the absence of τ(med)values,the model τ(IRI-Plas)can be used as a global model.
4. Simulation of foF2 using the NNT2F2 model
We illustrate the fit of the NNT2F2 model to the observations at stations at meridian 110°E using the Beijing station as an example;for the other stations, the results are similar, except for the size of the differences.Fig.3a compares the diurnal variations of the model and observed foF2 values for the two maps. The TEC behavior is shown in Fig. 3b.
It is seen that the difference between foF2(med)and TEC(med)for the two maps is insignificant,and negligible after UT14,but the difference between the calculated foF2(med)and the real values is quite large.
The difference depends on the latitude.Fig.4 shows the absolute and relative deviations. The two deviations |ΔfoF2| related to each latitude on the x-axis correspond to the deviation for the median and the instantaneous value of foF2.The instantaneous values were averaged over all hours and days of the month.
Any model's mean deviations for medians and instantaneous values should differ due to day-to-day variations.In this case,they are very similar. This may indicate that the systematic difference may be due not to the behavior of foF2,but the mismatch between TEC(IGS) and TEC(NNT2F2)). We attempt to illustrate this possibility with a disturbance example below. The foF2 response to disturbances on March 7-17, 2012 was investigated [26]. Fig. 5a compares the calculated foF2(NNT2F2) and observed foF2 (obs)values.It is seen that the calculated foF2(NNT2F2)values reflect the nature of the disturbances but differ from foF2(obs)by some value.Having put this size equal to an average absolute deviation and having subtracted it from foF2 (NNT2F2), we have obtained the result shown in the Fig. 5b.

Fig.1. Comparison of observational and model values of parameters, (a) foF2, (b) TEC.

Table 2 Compliance metrics for observed and modeled values of foF2.
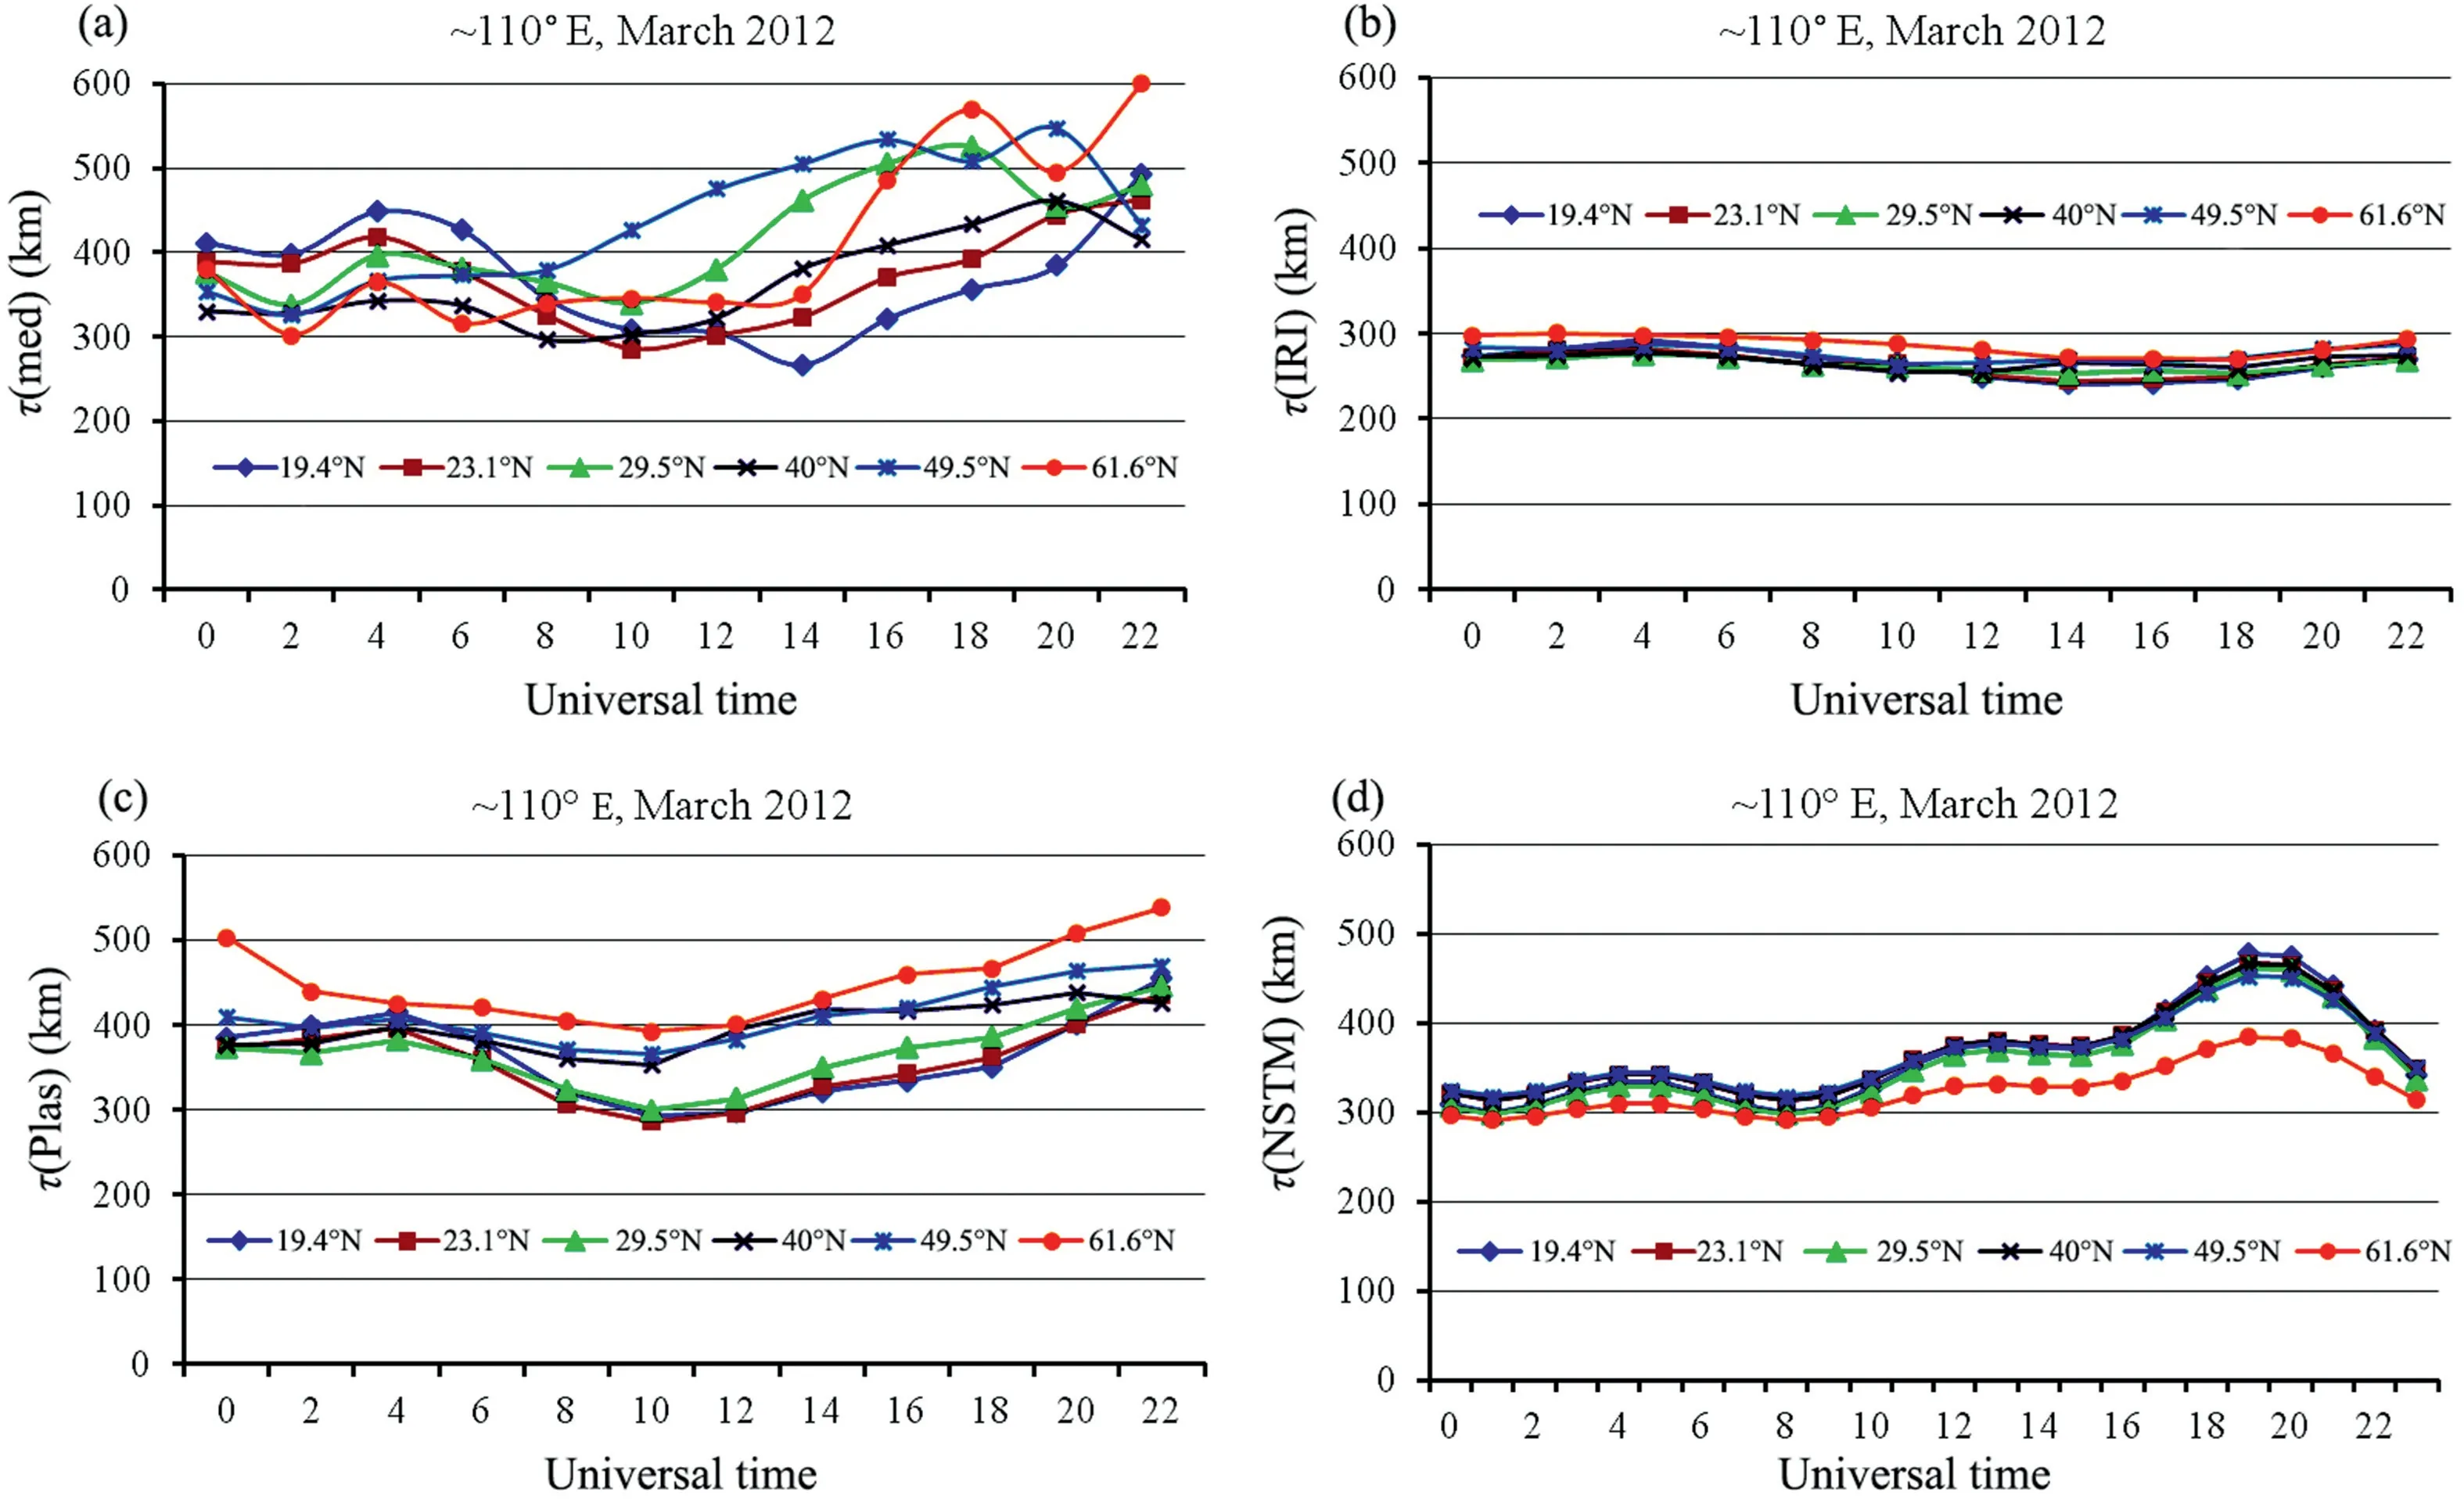
Fig. 2. Comparison of observational and model daily variations of τ for 6 stations along the meridian 110° E in March 2012, (a) τ(med), (b) τ(IRI), (c) τ(IRI-Plas), (d) τ(NSTM).

Fig. 3. Diurnal behavior of ionospheric parameters on the example of Beijing station, (a) foF2 (med), (b) TEC (med).

Fig. 4. Latitude dependence of the deviations of the calculated foF2(NNT2F2) from the observational foF2 (obs), (a) |ΔfoF2|, (b) σ(foF2).

Fig. 5. Illustration of the correction of the model values of foF2(NNT2F2), (a) the initial calculated values, (b) the corrected calculated values.
Consequently, the conclusion that the NNT2F2 model reflects the nature of disturbances is confirmed.
5. The latitudinal dependence of the ionospheric response to disturbances in the period of March 21-31, 2012
In the paper[26],the latitudinal dependence of foF2 at the 110°E meridian was plotted for March 7-17 during several magnetic storms [29]. In this paper, these results are supplemented by calculations for the period March 21-31, in which a magnetic storm also occurred that was not as intense,as illustrated in Fig.6,which shows the behavior of the geomagnetic Dst and AE indices and solar wind indices IMF and Np. The Dst = -54 nT minimum was observed at UT6 on March 28.We can see from figure 3 in Ref.[26]that the first period is characterized by an increased level of solar activity, while in the second period, the F10.7 index is practically constant. In the first period, the IMF was much higher than in the second, but in the second period the proton density Np had a relative maximum on March 28.
It allows the accuracy of the models to be compared over different periods.In this case,it is important for the IRI-Plas model to be used as a global model. The absolute deviations of the foF2 model from the experimental values using τ(IRI-Plas), τ(med),τ(IRI) are shown in Table 3.
This results of this comparison confirms the advantage of the IRI-Plas model over the IRI.
The behavior of TEC and foF2 during March 21-31 for three stations, Tunguska, Beijing, and Hainan is shown in Fig. 7. In contrast to Ref. [26], where the IRI model values for foF2 were shown to be nearly constant and exceeded the median, in this paper, the IRI-Plas model values are presented with the observed values, medians and foF2 (rec) values calculated from τ(med) and TEC (obs) [19].
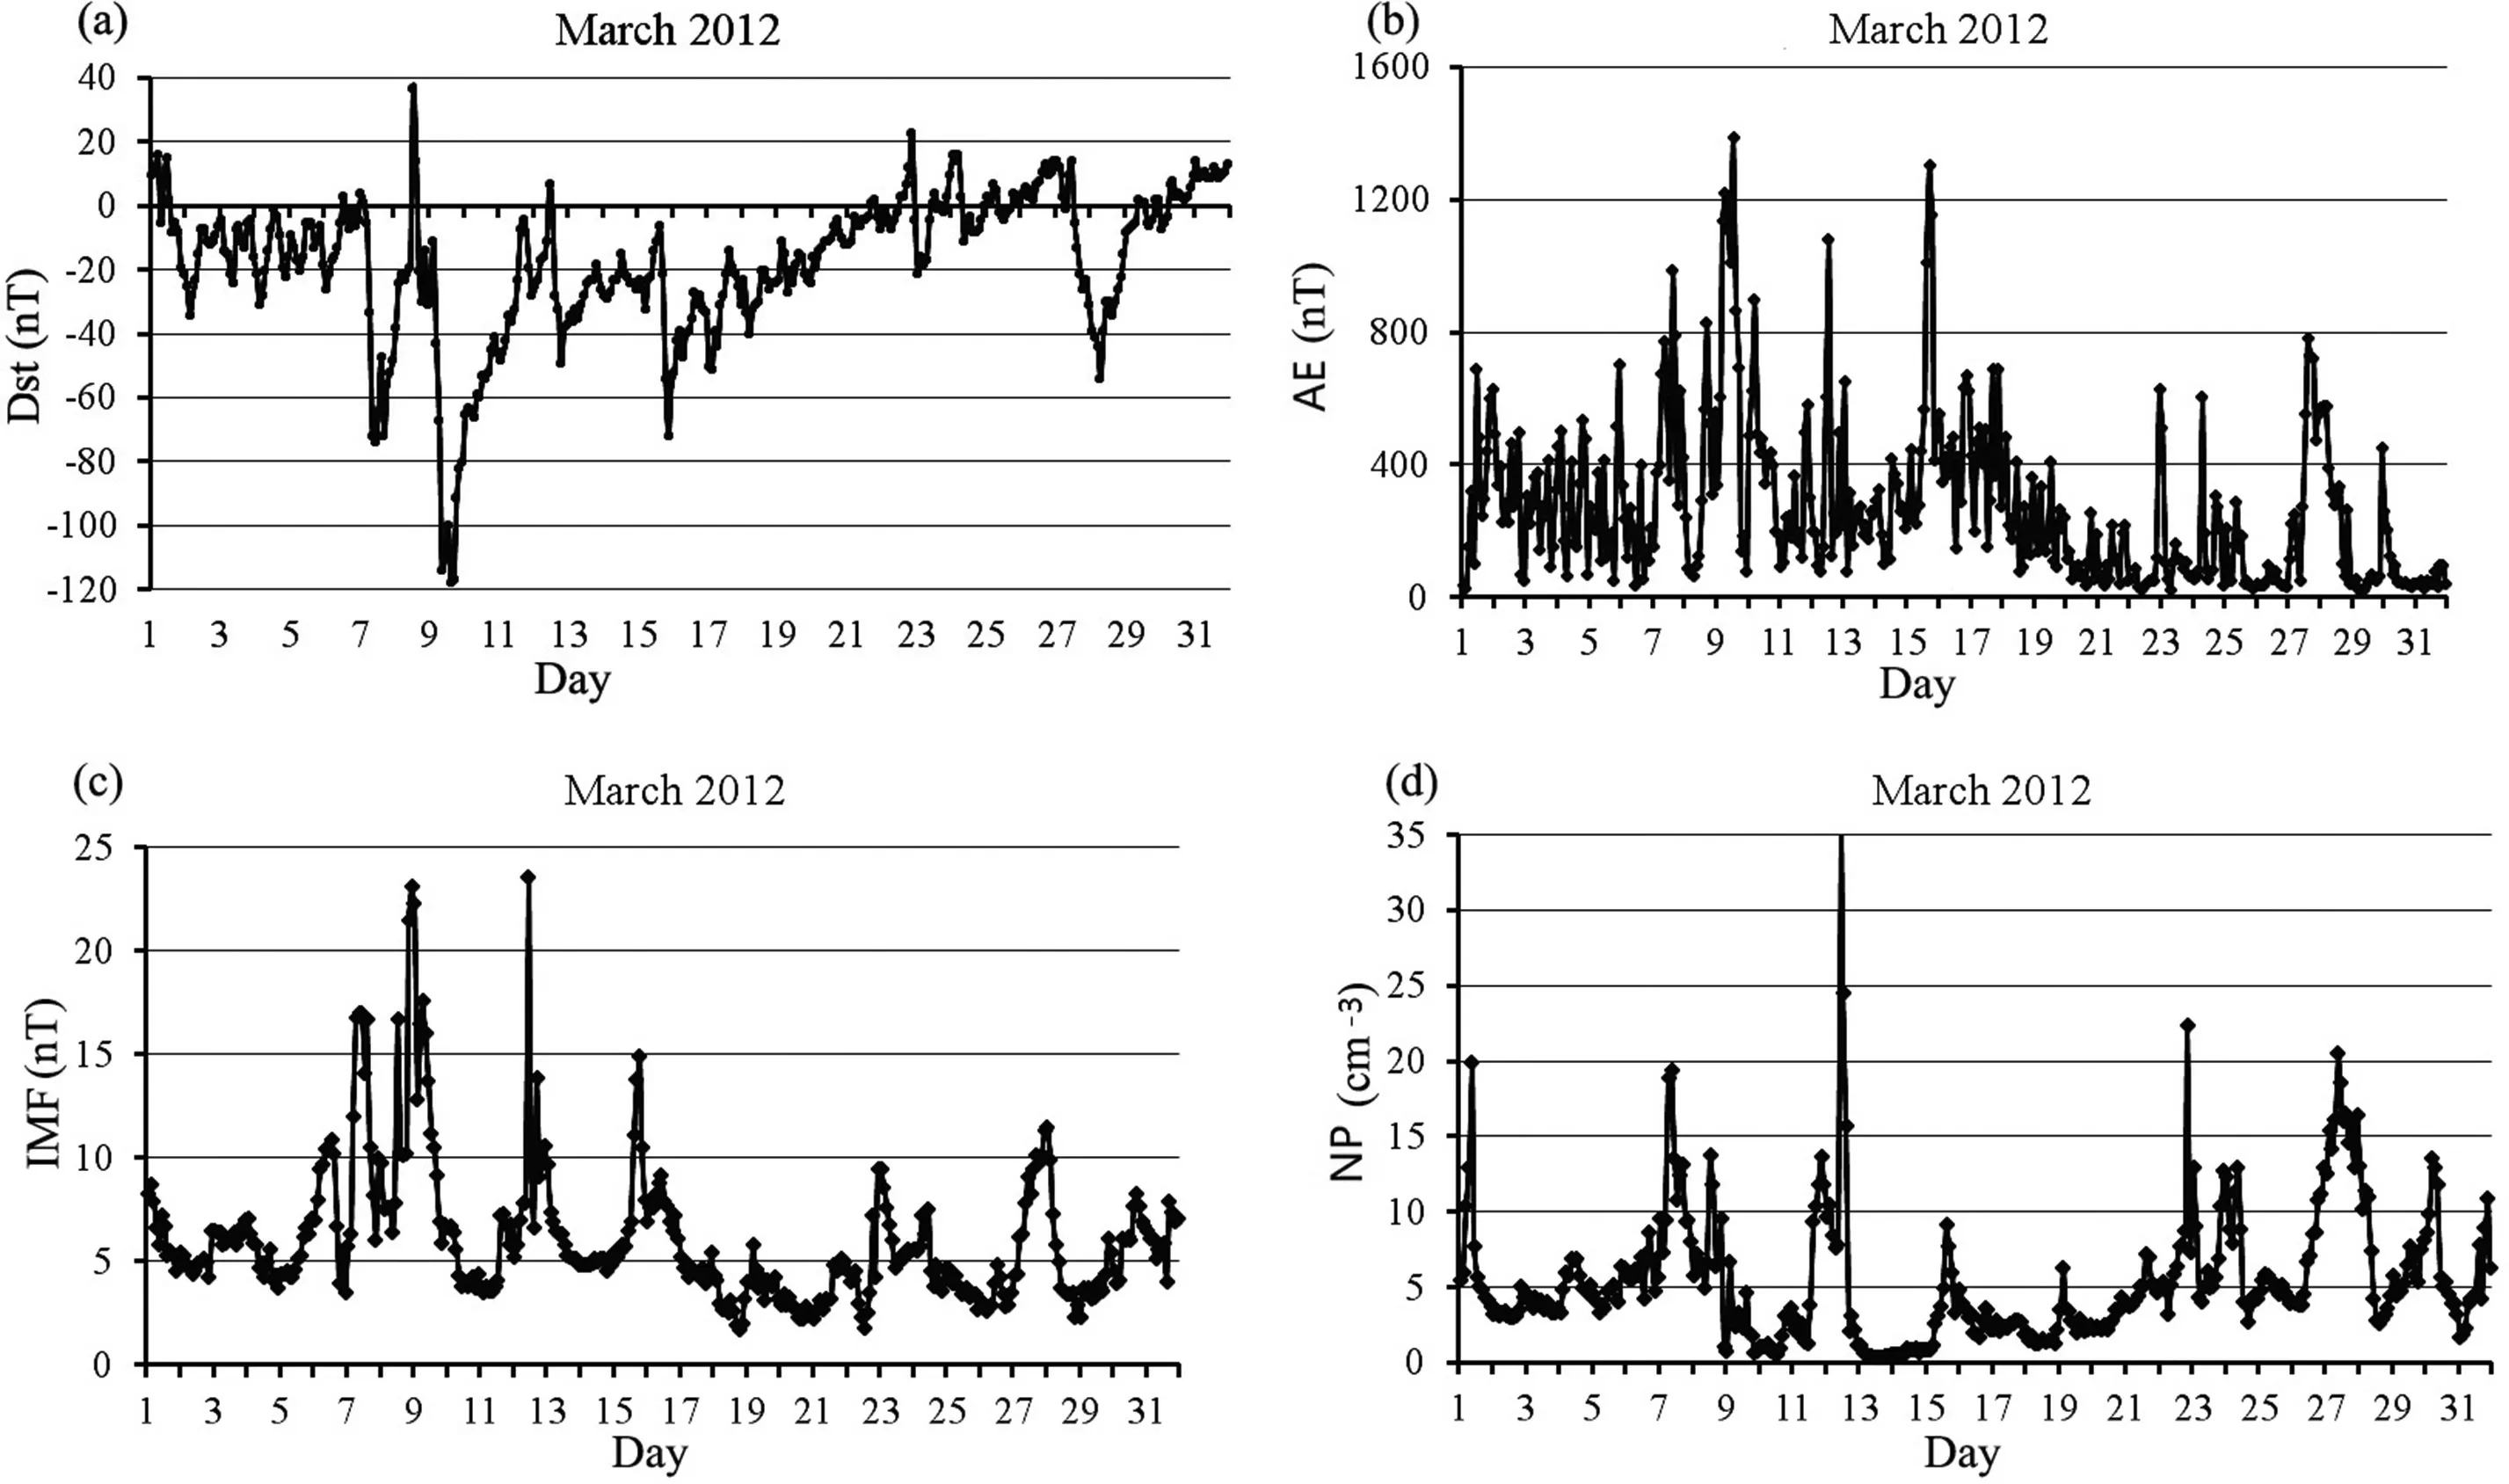
Fig. 6. Geomagnetic situation in March 2012, (a) Dst-index, (b) AE-index, (c) IMF, (d) Np.

Table 3 Comparison of absolute deviations of foF2 for different models (in MHz).

Fig. 7. TEC and foF2 variations are presented for three stations, (a), (d) - Tunguska; (b), (e) - Beijing; (c), (f) - Hainan.
It is seen that foF2(Plas) reflects the character of the disturbances, in contrast to the IRI model. When comparing the behavior of foF2 (obs) and TEC (obs) during the two periods, the daytime positive disturbances were observed on March 7 and 9 and were maximum at the high-latitude Tunguska station; at the low-latitude Hainan station, the positive disturbances were observed during the recovery phase. During the second period,the positive daytime disturbances occurred before the magnetic storm, and at the recovery phase at Tunguska station, at the middle-latitudinal Beijing station, the positive disturbances had a smaller strength, but the nighttime enhancements increased.When comparing the relative deviations δTEC and δfoF2 of the two periods (not shown), they had a larger value in the first period, and for the Hainan station, δfoF2 did not exceed 20%during the entire period, which indicates the absence of response.
This behavior indicates the presence of latitude dependence of the parameters' behavior. The latitude dependence of TEC was calculated using JPL map data in the range 20°N-62.5°N with a step of 2.5°N. The polynomial approximation τ(med) obtained in Ref. [26] was used to construct the latitude dependence of foF2.Examples of the latitudinal dependence of foF2 are shown in Fig.8 for the same time points as in Ref.[26].Each panel a-d contains 11 curves for each day and a fixed time point (UT = 18, 0, 6,12, corresponding to LT = 1, 7, 13, 19). Each curve contains 18 points belonging to the latitude range from 62.5°N to 2.5°N;the first point of each curve shows foF2(rec)for latitude 62.5°N and the last point for latitude 2.5°N.
The magnetic storm of 27-29 was fairly short-lived,as shown in Fig. 6, but positive foF2 deviations from the medians were characteristic of the entire period, not only at low latitudes but also at high latitudes, both night and day.
This indicates the similarity of the physical mechanisms causing these deviations. Similar to the results of Ref. [26], the TEC variations accompanying this foF2 behavior indicate that monitoring of the ionosphere should be carried out continuously,not only during disturbance periods.
6. Results
In this section,the possibility of using IGS maps to calculate foF2 and test its models is discussed, since this possibility has been confirmed again,now by the paper[30].On the one hand,the use of IGS maps has led and continues to lead to important results,including, for example, during strong disturbances [31]. On the other hand,there may be large differences between the TEC values obtained by different methods, and this may strongly affect the results of the NNT2F2 model. Additional information on this issue can be obtained by referring to figure 5 from Ref. [13], in which observed foF2 and TEC values are shown together for four cases for Moscow station: (a) March 20, 2010, DoY = 79, (b) June 21, 2014,DoY = 172, (c) September 23, 2010, DoY = 266 (d) December 21,2015, DoY = 355. The statistical results of the comparison are shown in Table 4. The upper row shows the dates and Figure numbers from Ref.[13].The second line shows the day of the year (DoY) and the year in short form. The third line shows index names F10.7 and Dst, and their values are given in the fourth line.The fifth line shows the map type.Other lines show absolute MAE values (|ΔfoF2|), and relative RMSE values for JPL and CODE maps.The values of the Dst-index show several cases: weakly disturbed(a), (b), period of positive disturbances (c), strong magnetic storm(d).
It is seen that in all cases,the results for the CODE map are better than for the JPL map, and a good agreement with foF2 (obs) is obtained for the CODE map, although for JPL, the agreement is within the stated accuracy of the NNT2F2 model,except for case(b).The behavior of the TEC parameter for the selected cases in Ref.[13]with the median for the CODE map is shown in Fig. 9.

Fig. 8. Response of foF2 to the disturbance at the end of March 2012 for different times of day: (a) UT = 18, (b) UT = 0, (c) UT = 6, (d) UT = 12.

Table 4 Comparison of foF2 (NNT2F2) accuracy for the cases considered in Ref. [13].
The minimum TEC for case (a) is 3 TECU, and the maximum is 14 TECU, i.e., TEC(CODE) gives slightly overestimated values.Comparison with the median indicates a positive disturbance. Case(b) gave the largest divergence between TEC(NNT2F2) and TEC(-CODE).The minimumvalue of TEC(NNT2F2)is approximately 5 TECU,and TEC(CODE) is more than 9 TECU. The maximum value of TEC(NNT2F2)in Ref.[13]is approximately 15 TECU,TEC(CODE)=23 TECU, and comparison with the median shows a negative disturbance.The reason for this divergence is not obvious.Case(c)shows a not very large difference and a positive disturbance phase,for which positive Dst values are responsible. It is important to note that a comparison of the calculated foF2(NNT2F2)values for particular days with the corresponding medians shows the same pattern of disturbances.Case(d)confirms that the model NNT2F2 reflects the nature of the disturbances more convincingly. The behavior of various parameters of the ionosphere,in this case,is illustrated in Fig.10.Fig.10a shows the behavior of the CODE TEC map with the median indicating a positive day and night disturbance during the main phase and the recovery phase, seen well in Fig.10b from the behavior of the Dst index and the relative deviations of TEC(CODE).For clarity,the values of the Dst index are reduced by a factor of 2.In the bottom plots,the variations of the observed foF2 and the calculated foF2(NNT2F2)with their respective medians are shown.
A coincidence of the medians and a positive perturbation character can be seen, although the foF2(NNT2F2) values are slightly overestimated on December 21 (following the TEC).
These results show that the NNT2F2 model is adequate for the observed foF2 values regardless of geomagnetic conditions. Since this model proved to be sensitive to TEC processing methods, it is necessary to use the Seemala software to calculate TEC to obtain the most accurate results.IGS maps can give the same results if they are close to Seemala values, depending on the region.
The authors of Ref. [32] investigate the error characteristics of TEC obtained with GNSS,using their own method described in the paper as an example. Figure 4 of Ref. [32] shows the temporal variations of TEC at the 110°E meridian for different seasons of 2014, averaged over three days each, and for four latitudes (15°N,25°N,35°N,45°N).Similar plots are shown in Fig.11 for the JPL TEC map.
It is seen that the agreement is very good. A comparison of TEC behavior for different maps and latitudes (with the smallest and largest TEC differences) is given in Fig. 12, using September as an example. In other seasons the picture is approximately the same.

Fig. 9. TEC variations for (a) March 2010, (b) June 2014, (c) September 2020, (d) December 2015, along with the median for the CODE map.

Fig.10. Response of the ionosphere to the magnetic storm on December 20-21, 2015: (a) TEC, (b) δTEC, (c) foF2, (d) foF2(NNT2F2).
7. Discussion and conclusion
The introduction noted the role of ionospheric models in providing scientific and technological needs on a global scale.However, global models may not always satisfy regional users.For the southeastern region, this is confirmed by the publication of two papers by the same authors devoted to developing a regional foF2 model [33,34]. They justify the importance of creating regional models in which data gaps of foF2 can be filled using TEC. In this work, we tested two approaches for determining foF2 using TEC at 110°E meridian:the use of τ and neural networks. It can be seen that both approaches can compete with the regional model. The details of the obtained results are as follows.
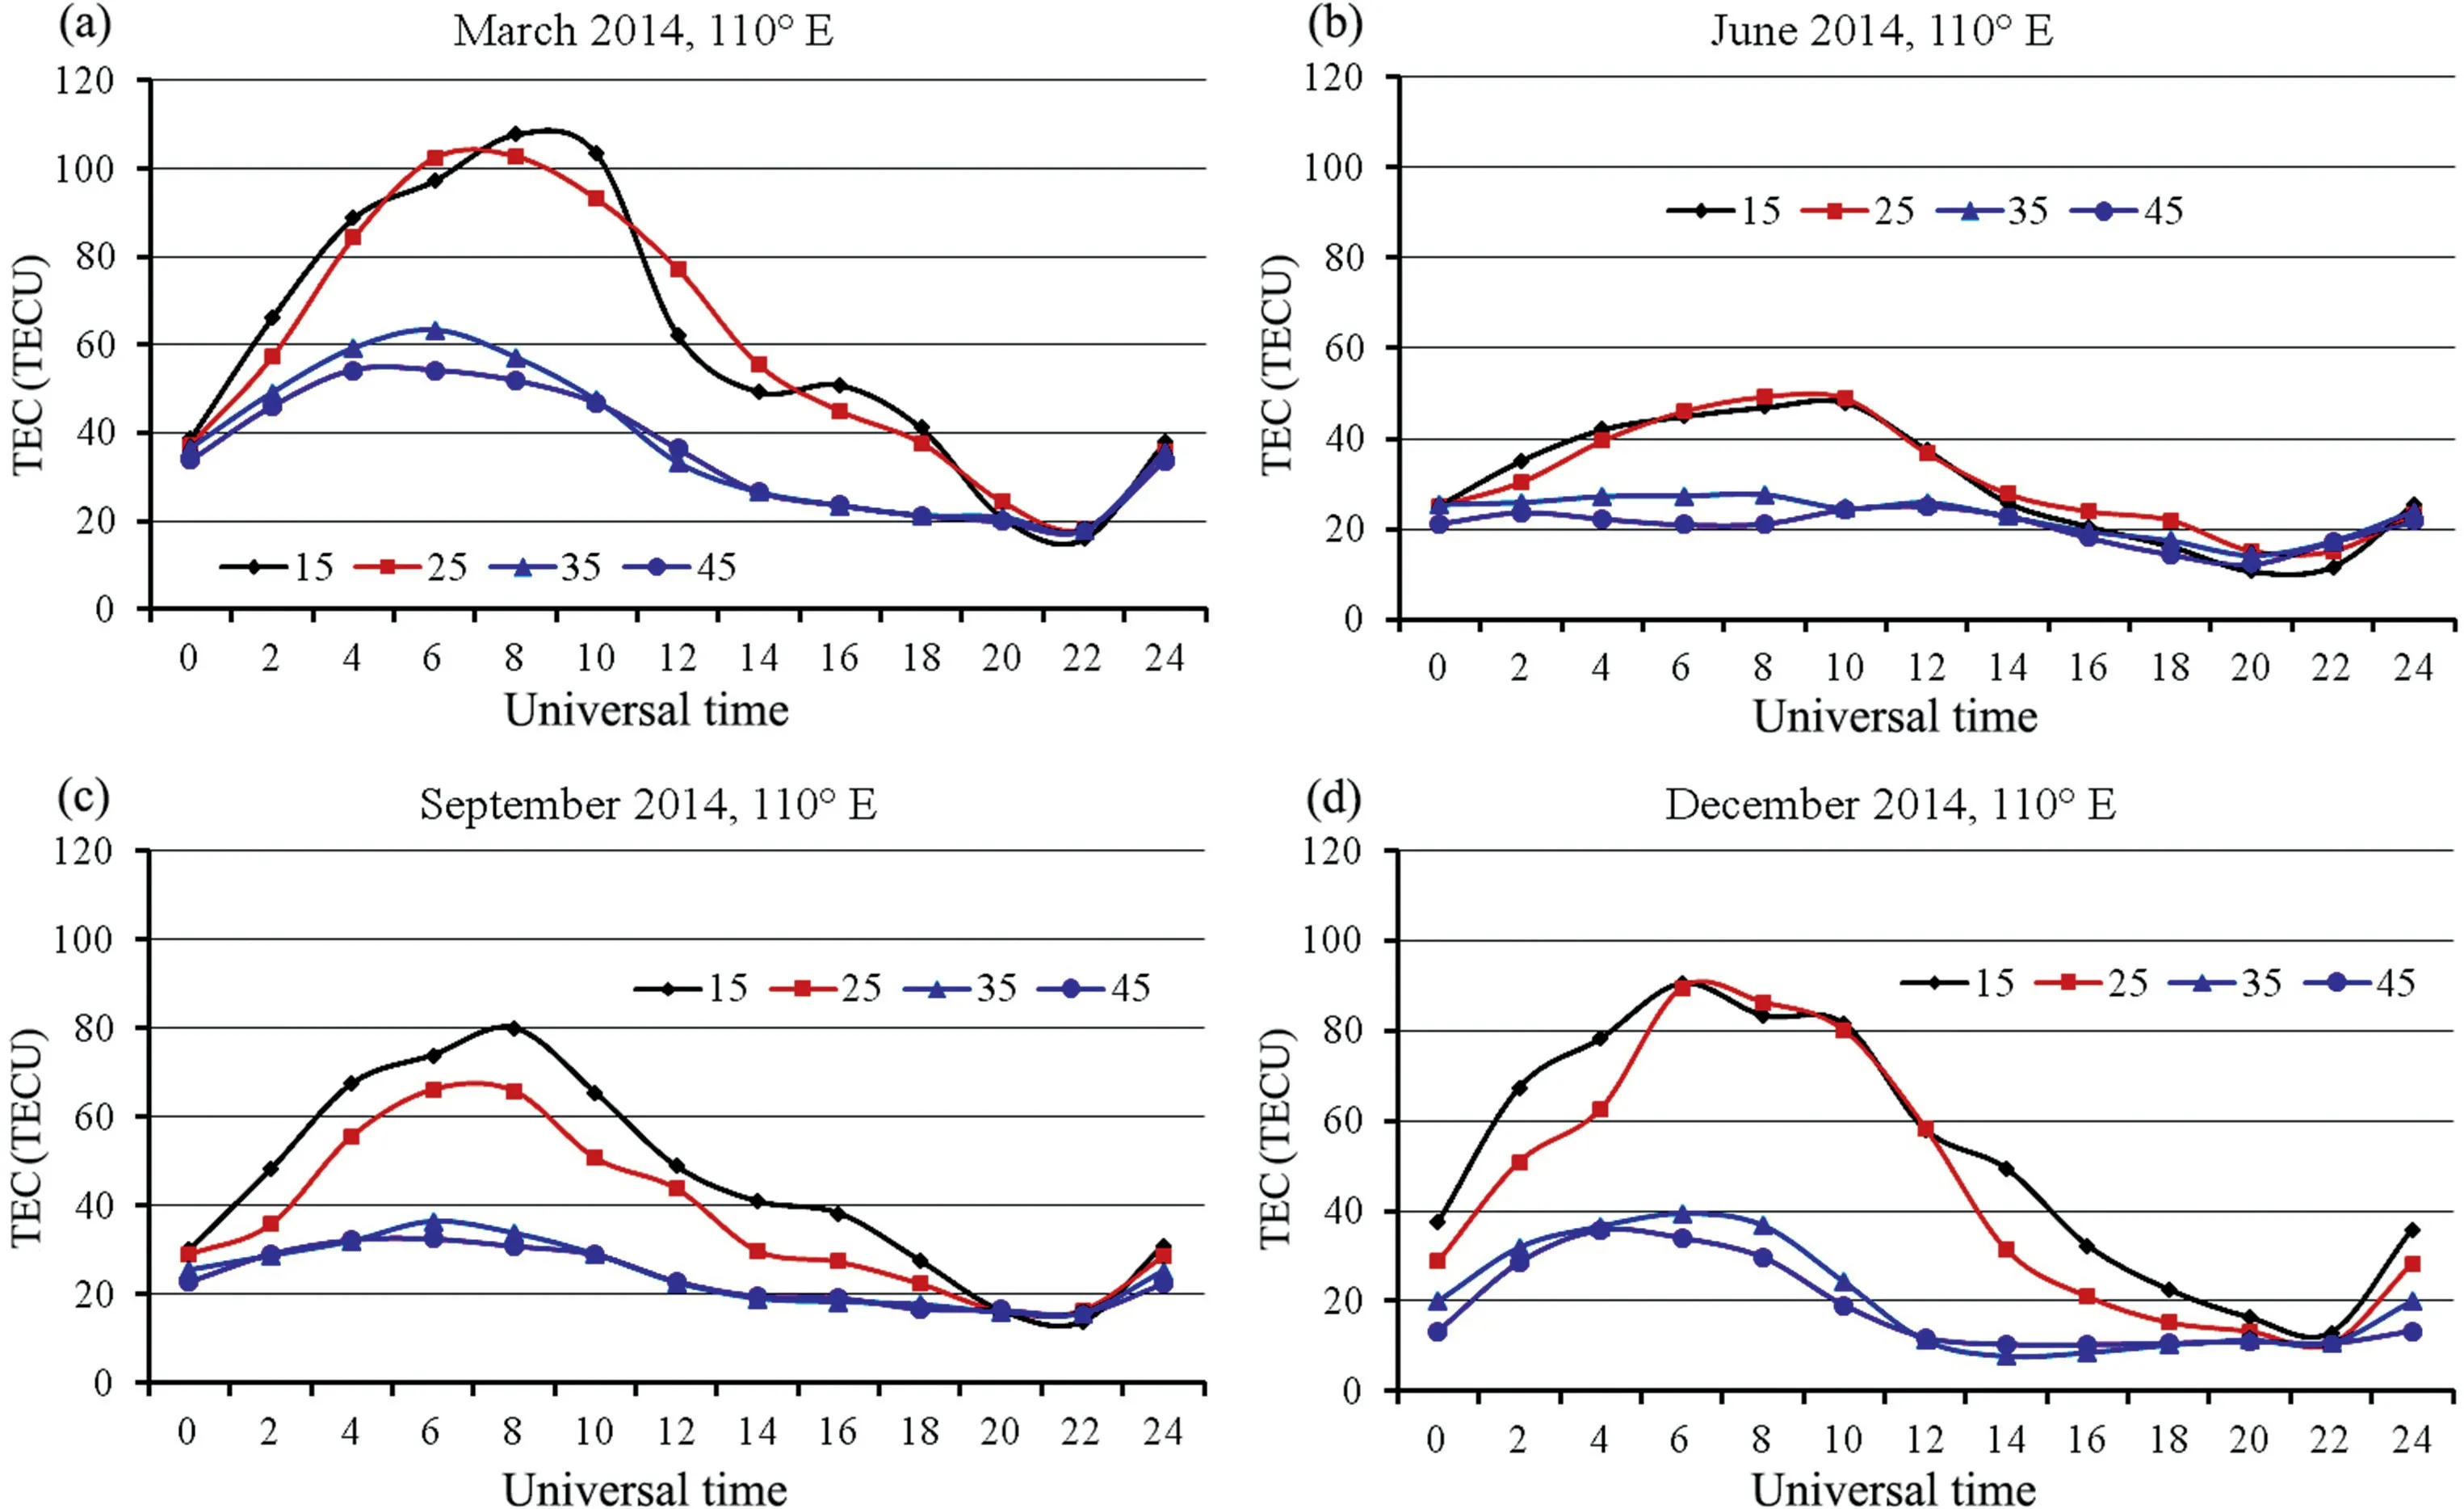
Fig.11. Seasonal TEC variations in the diurnal course at the 110° meridian for (a) March 2014, (b) June 2014, (c) September 2014, and (d) December 2014.
A review of publications in the introduction shows that the parameter τ has recently attracted increased interest. As noted in Ref. [30], this is due to the fact that the parameter τ describes the shape of the vertical electron density profile and,as a consequence,the plasma distribution in the ionosphere. Shortcomings in the τ modeling were noted and ways of improvement were indicated[30]:(1)a better representation of the shape of the topside profile,(2) a more correct modeling of τ based on TEC and NmF2 data, in addition, the development of a new model of τ was stated. A polynomial approximation of τ(Appr) along the 110°E meridian during disturbances on March 7-17,2012[26],allowed us to reveal features of foF2 behavior during disturbances at this meridian. At the same time,the τ(IRI)model was tested,which showed that this model has practically no latitude dependence. Therefore, in this paper, the model τ(IRI-Plas) and the latest model τ(NSTM) are tested. It turned out that τ(NSTM) fits the experimental values better than τ(IRI)but worse than τ(IRI-Plas).Besides,the values of τ(IRI) are almost constant and lower than those of the other models. The values of τ(IRI-Plas) are closest to the experiment.
Notably, the first comparison of the model τ(NSTM) was carried out in the paper [35] for the meridian 30°N with the parameter τ(Appr) constructed from Murmansk (68. 57°N, 33.2°E), Moscow(55.5°N, 37.2°E), Rostov (47.2°N, 39.7°E), Athens (38°N, 23.5°E) in March 2012. There are no plots of daily variation for all stations separately[35]forall models τ as in figure 2,but there is a comparison of all models τ for each station,which shows the same results.
Thus, it can be stated that the development of new models is a positive fact,even when their results are not always better than those of traditional methods, strengthening the positions of traditional methods.Probably,there cannot be models that will provide equally accurate results in all regions due to different physical conditions.
Author agreement statement
We, the undersigned, declare that this manuscript is original,has not been published before and is not currently being considered for publication elsewhere. We confirm that the manuscript has been read and approved by all named authors and that there are no other persons who satisfied the criteria for authorship but are not listed. We further confirm that the order of authors listed in the manuscript has been approved by all of us.We understand that the Corresponding Author is the sole contact for the editorial process.He/she is responsible for communicating with the other authors about progress, submissions of revisions and final approval of proofs signed by all authors as follows:
Conflicts of interest
The authors declare that there is no conflicts of interest.
Acknowledgments
The authors are grateful to the developers of IRI and IRI-Plas models and the relevant websites (https://ccmc.gsfc.nasa.gov/modelweb/models/iri2016_vitmo.php) and (http://www.ionolab.org/index.php?language=en). GIM map data were obtained using IONEX files on the site(ftp://cddis.gsfc.nasa.gov/pub/gps/products/ionex), and the data of VS were obtained using the IZMIRAN website (https://www.izmiran.ru/ionosphere/weather/foF2/). The values of indices Dst and AE were taken from the website (http://wdc.kugi.kyoto-u.ac.jp/wdc/Sec3.html). IMF and Np data selected on the site(http://omniweb.gsfc.nasa.gov/form/dx1.html).Authors express gratitude to anonymous reviewers for valuable comments.The research was financially supported by Southern Federal University, Russia,2020 Project VnGr/2020-03-IF.
杂志排行
Geodesy and Geodynamics的其它文章
- A new polar motion prediction method combined with the difference between polar motion series
- Insights into spatio-temporal slow slip events offshore the Boso Peninsula in central Japan during 2011-2019 using GPS data
- Local seismic hazard map based on the response spectra of stiff and very dense soils in Bengkulu city, Indonesia
- Coastal transgression and regression from 1980 to 2020 and shoreline forecasting for 2030 and 2040, using DSAS along the southern coastal tip of Peninsular India
- Thermospheric density responses to Martian dust storm in autumn based on MAVEN data
- Crustal structure of the Qiangtang and Songpan-Ganzi terranes(eastern Tibet) from the 2-D normalized full gradient of gravity anomaly
