Predictive Model of Live Shopping Interest Degree Based on Eye Movement Characteristics and Deep Factorization Machine
2022-09-29SHIXiujin石秀金LIHaoSHIHangWANGShaoyu王绍宇SUNGuohao孙国豪
SHI Xiujin(石秀金), LI Hao(李 昊), SHI Hang(史 航), WANG Shaoyu(王绍宇), SUN Guohao (孙国豪)
School of Computer Science and Technology, Donghua University, Shanghai 201620, China
Abstract: In the live broadcast process, eye movement characteristics can reflect people’s attention to the product. However, the existing interest degree predictive model research does not consider the eye movement characteristics. In order to obtain the users’ interest in the product more effectively, we will consider the key eye movement indicators. We first collect eye movement characteristics based on the self-developed data processing algorithm fast discriminative model prediction for tracking (FDIMP), and then we add data dimensions to the original data set through information filling. In addition, we apply the deep factorization machine (DeepFM) architecture to simultaneously learn the combination of low-level and high-level features. In order to effectively learn important features and emphasize relatively important features, the multi-head attention mechanism is applied in the interest model. The experimental results on the public data set Criteo show that, compared with the original DeepFM algorithm, the area under curve (AUC) value was improved by up to 9.32%.
Key words: eye movement; interest degree predictive; deep factorization machine (DeepFM); multi-head attention mechanism
Introduction
Online live shopping has now become one popular way for people to obtain information. Obtaining the users’ interest in the live broadcast process can not only improve the merchant’s live broadcast strategy and increase users’ satisfaction with watching the live broadcast, but also help designers develop more humanized live broadcast interaction methods to enhance user experience. Therefore, it is of great practical significance to obtain users’ interest when watching live shopping broadcasts.
The eye movement characteristic refers to the data feature of the subject’s eyeball when watching the live broadcast. Traditionally, eye tracking technology is an analysis tool that can be used in different disciplines such as medicine, psychology, and marketing[1-3]. In the process of visual evaluation, the method that combined eye tracking with some data processing methods can obtain fine-grained information in the process of individual cognition, and has achieved satisfactory results in a variety of scene detection.
Current assessments of interest in live streaming are mostly based on “black box” research. Specifically, this kind of research relies on the viewer’s self-expression to reflect the degree of interest in live streaming. However, the interest obtained by “black box” not only involves the subjective factors of the viewer, but also will be affected by many objective factors such as the environment and mood, which makes them difficult to truly reflect the influence of the viewer’s interest in live shopping. With the development of neural networks, click-through rate(CTR) estimation technology is increasingly used in interest degree predictive models. However, CTR ignores a lot of objective information such as the level of detail of products in live shopping, and some important factors like dynamic parameters. Figure 1 is a simple example of the attributes of each dimension entity in the live broadcast process. Many data dimensions can be extracted from a live video, such as eye movement data, traditional interest model dimensions and other dimensions, where eye movement data extracts data dimensions through video processing algorithm. It is necessary to consider the various factors shown in Fig. 1 in the live shopping interest model.

Fig. 1 Example diagram of each entity attribute
In this paper, we take the eye movement factor into account in the proposed model. At the same time, the base model also has room for improvement. We make innovations from these two aspects.
1 Related Work
1.1 Application of eye tracking technology
In recent years, eye tracking technology has been used more and more widely in visual evaluation research. Baazeemetal.[4]used eye movement data for machine learning to detect developmental dyslexia, and used random forest to select the most important eye movement features as input to the support vector machine classifier. This hybrid approach can reliably identify fluent readers. Bitkinaetal.[5]used eye movement indicators to classify and predict driving perception workload, and then studied the ability of eye movement indicators to predict driving load, and obtained a conclusion that some factors were correlated with gaze indicators. Relloetal.[6]studied the extent to which eye tracking improved the readability of Arabic texts, and used different regression algorithms to build several readability prediction models.
Eye tracking technology is used in many fields to complete recommendation tasks or classification tasks. In the recommendation task, the improvement of the index area under curve (AUC) is mostly between 2% and 10%, and specific conclusions or models have been drawn on the respective research issues. However, most of these models are based on machine learning methods and the number of samples used is small, from tens to hundreds, which brings certain accidental factors to the experiment, and the learning ability of these models can be further improved.
1.2 Interest prediction model
Existing interest degree predictive models are mainly divided into two categories, namely, CTR predictive models based on machine learning and deep learning. Interest prediction models based on machine learning are mainly divided into two categories: single model and combined model prediction. In a single model, logistic regression and decision tree are the more common models. In terms of model combination, gradient boosting decision tree(GBDT)+logistic regression(LR) and field-weighted factorization machines (FwFM)[7-10]are the more common models. However, the interest degree predictive model based on machine learning relies more on the processing of features manually, and a lot of manual feature engineering is required in the early stage of application model. The interest degree prediction model based on deep learning has shown good results by exploring the high-level combination of features in the interest degree prediction field. Among them, wide&deep, fast growing cascade neural network (FGCNN),etc.[11-13]are the more common models.
In the research related to the interest prediction in live broadcast, eye movement data is not used as a data dimension in the model.
2 Eye Tracking Data Obtaining Algorithm
Since the obtaining of eye movement data is an automated process and the eye tracker supporting software does not provide the calculation of the parameters that the subject is concerned about a single area. This paper proposes the fast discriminative model prediction for tracking(FDIMP) algorithm to solve the task of live video processing, and improves the tracking model based on the ability to discriminate goals and backgrounds and reduce the number of iterations. It provides an automated function to output the required data from the video. After the operation of filling the dimensions, the obtained dimensions are the CTR dimension and the eye movement dimension. The data set contains the data supplemented by the tested person and the characteristics of the large data set, which is used by the subsequent interest degree prediction model.
2.1 Obtaining live video
All subjects in this article have normal or corrected vision, and have no eye problems such as color blindness. The subjects include online shoppers and infrequent online shoppers, and are divided into different occupations. We apply the Noldus-Eye tracking glasses(ETG) eye tracker to collect the user’s eye movement data. The viewing distance is set as 60 cm. The device is calibrated before the experiment. If there is obvious head movement or it is detected on the screen used by the researcher to track eye movement drift, then we repeat the calibration[14]. The algorithm can generate relevant data such as live video corresponding to the viewpoint trajectory. In addition to the video, the eye tracker can also produce a variety of visual images, such as a heat map directly related to the number of gaze points, and a path diagram indicating the transition direction of gaze. These images are used as a supplement to the eye movement data and can intuitively show the characteristics of the learner when they are looking at the video. The experiment requires the subject to wear an eye tracker device to watch the live broadcast within a one-minute live shopping video. In the process, the data processing model is used to capture the relative gaze time and pupil concentration of the user for different areas of the plate. At the end of the experiment, we record the subject’s degree of satisfaction with the items introduced in the video.
2.2 Live shopping video processing model
The FDIMP processing model is used to process the subject’s eye movement video into the user’s relative gaze time and pupil concentration for different plate areas. As an end-to-end tracking architecture, it can make full use of the target and background appearance information to predict the target model[15]. The process is shown in Fig. 2. We apply random samples in the video sequence for training, where we extract three frames from a certain frame and the front as the training set, and extract three frames from the back of the frame as the test set, and pool the features of the extracted target area to obtain the initialized feature image. The function of model initialization is to initialize the features in the target area to generate a three-dimensional(4×4×n) feature filter. The initialized filter is combined with the background information of the target area to optimize, and the optimized filter is obtained in an iterative manner.
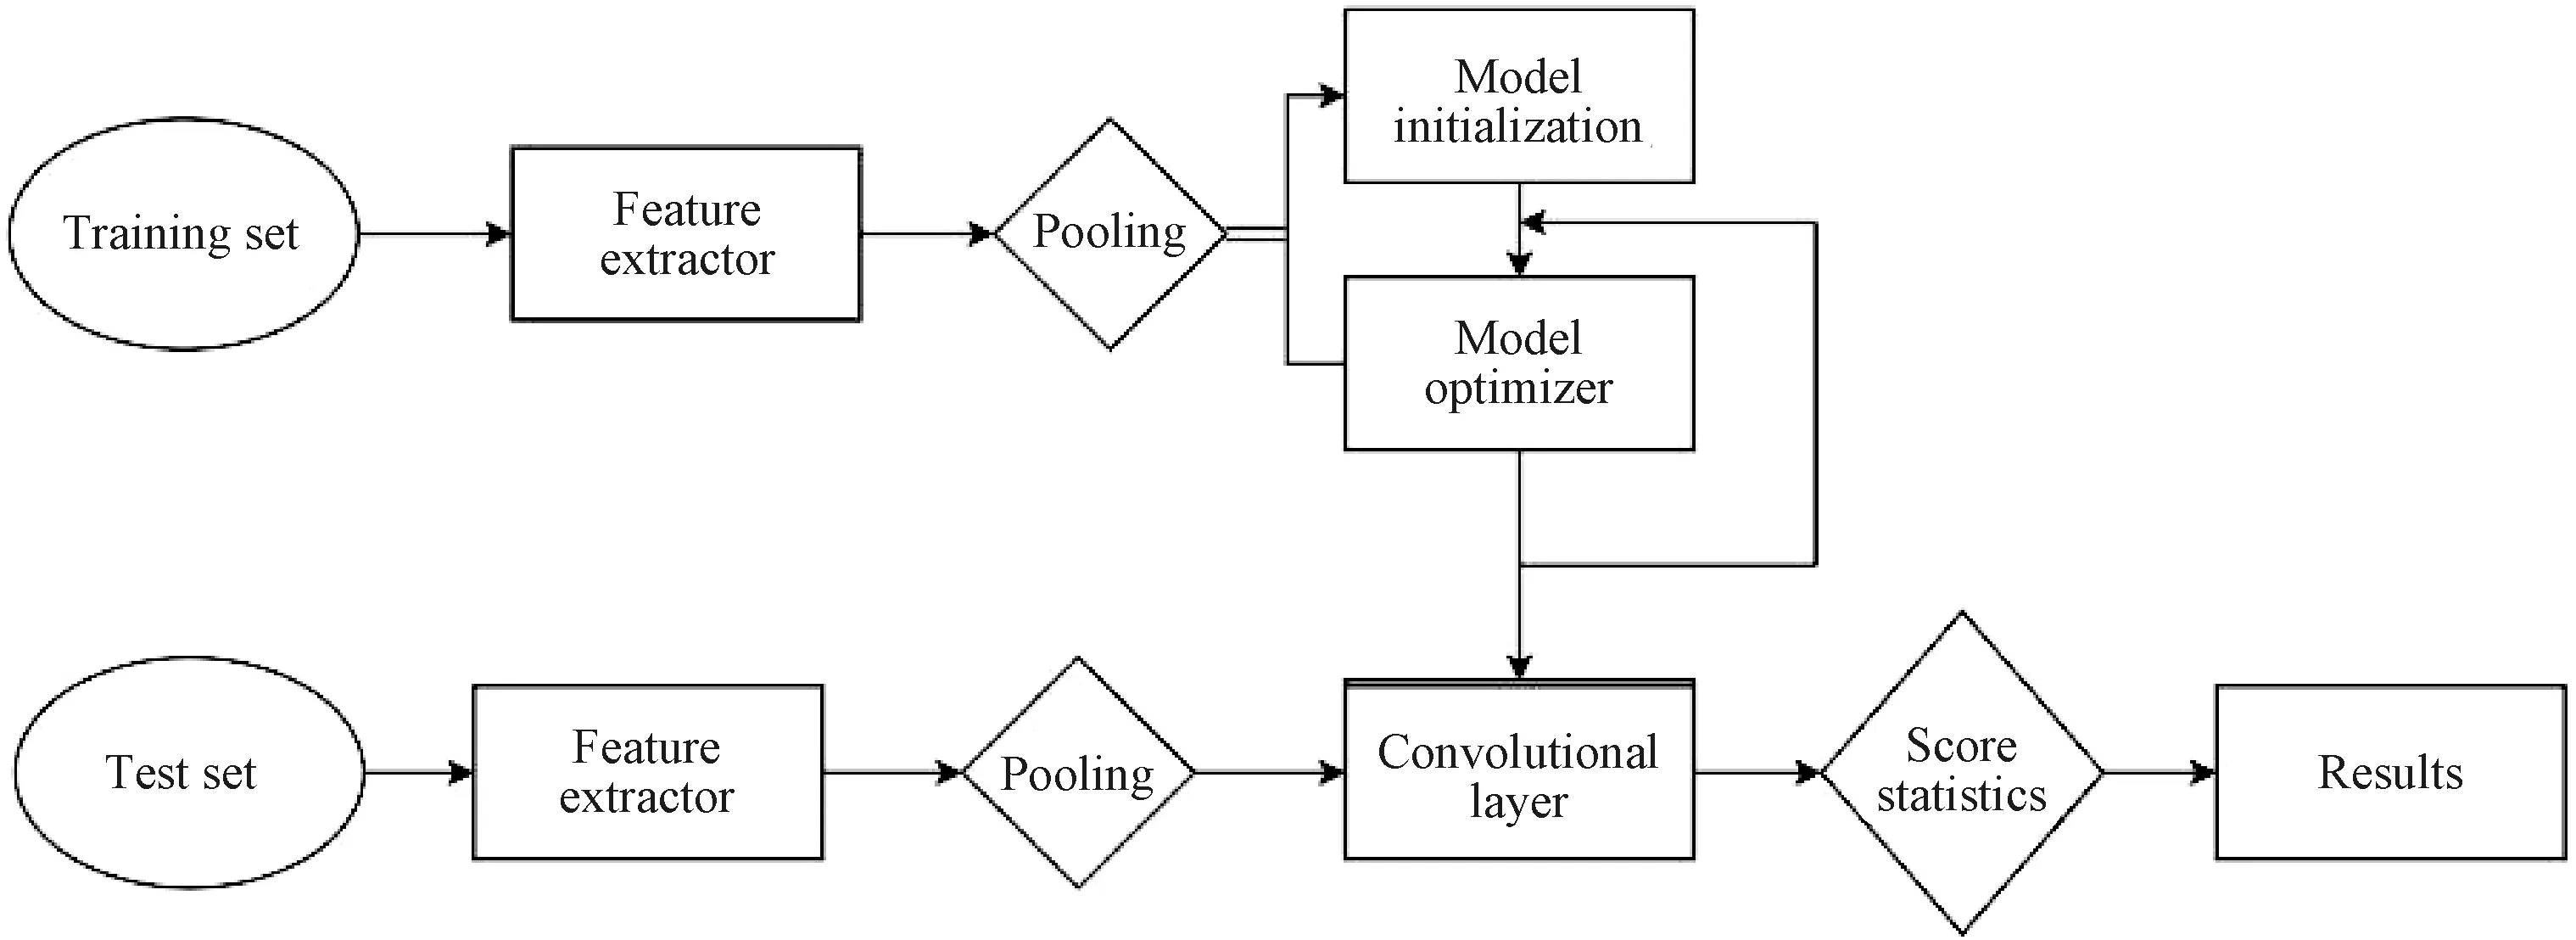
Fig. 2 Target tracking process
In the loss function setting,srepresents the number of training images, andrrepresents the residual function for calculating the predicted position and the target position. The common form is
r(s,q)=s-yq,
(1)
whereyqis the desired target scores at each location, popularly set to a Gaussian function centered atq. It is worth noting that, this simple form is directly used with mean-square-error (MSE) for optimization. Since there are many negative examples, and the labels of the negative examples are collectively referred to as 0, this requires the model to be sufficiently complex. In this case, performing optimization on the negative examples will cause the model to be biased towards learning negative examples instead of distinguishing between negative and positive examples. In order to solve this problem, we added weights to loss, and referred to hinge loss[16]in support vector machine (SVM) to filter out a large number of negative examples in the score map. For the positive sample area, MSE loss is used, so the final residual function is
r(s,c)=vc·[mcs+(1-mc)max(0,s)-yc],
(2)
where the subscriptcrepresents the degree of dependence on the center point;vcmeans weight;mc∈[0, 1] means mask, and in the background area,mc≈0; in the corresponding area of the object,mc≈ 1. In this way, the hinge loss can be used in the background area, and MSE loss can be used in the object area. In the design of this paper, regression factorsyccan be learned.
Obtaining eye movement parameters in different regions requires frequent switching of unlearned tracking objects. Compared with offline pre-training and similarity measurement models, FDIMP, an online learning and iterative update strategy, can be used in live shopping broadcasts, and can play a better role in tracking situations where objects are not clear.
2.3 Data used in the interest model
It is necessary to establish a tracking frame as the user’s point of view and target area when the packaged data processing algorithm is used to track live broadcast items. When the target area covers the user’s viewpoint, it is judged to be coincident. That is, the user’s viewpoint is paying attention to the area within the corresponding time. For the demo sales items, such as live broadcast anchors, background, comment area, and event coupon area, the data collecting method is shown as described above.
In addition to eye movement data, it is also necessary to collect user explicit feedback data, such as user age, user gender, and other customized information, to obtain user basic information and eye movement information (average blink time, number of blinks, attention time rate of sold items, attention time rate of anchor area, attention time rate of discount area, attention time rate of sold items, attention time rate of discount area and the number of attention points), and explain the subsequent model training after filling in the data.
3 Interest Recommendation Model Based on Eye Movement Characteristic Data
DeepFM algorithm is selected as the basic algorithm in this paper and it is improved on the basis of wide&deep. It does not need pre-training factor machine(FM) to obtain hidden vectors or artificial feature engineering. It can learn low-order and high-order combined features at the same time. FM module and deep module share the feature embedding part, which enables faster training and more accurate training and learning. It is very suitable for complex scenes such as interest prediction. Based on the DeepFM architecture, this model embeds and encodes eye movement data after introducing a collaborative information graph. Adding a self-attention mechanism to the deep neural network(DNN) improves the model’s ability to learn key information.
3.1 Embedded coding layer design
Since the original input features in interest degree prediction have various data types[17], some dimensions are even incomplete. In order to normalize the mapping of different types of feature components and reduce the dimensionality of the input feature vector, it is necessary to perform one hot vector mapping on the input feature first, and then perform one hot vector mapping on the input feature, followed by the extremely sparse after hot encoding the input layer, and cascading the embedding layer. Like field-aware factorization machines(FFM), DeepFM[18]summarizes features with the same characteristics as a field, and its formula is
x=f(S,M),
(3)
wherexis the corresponding vector after embedding coding,Sis the one-hot coding sparse eigenvector,Mis the parameter matrix, and its elements are the weight parameters of the connecting lines in Fig. 3. These parameters are iterated by learning during the training of the CTR prediction model.
As shown in Fig. 3, the embedded layer coding maps the one-hot code sparse vectors of different fields to low-dimensional vectors, which can compress the original data information and greatly reduce the input dimension.

Fig. 3 Original input sparse feature vector to dense vector to embedding mapping
As shown in Fig. 4, taking the particularity of the newly added data dimensions into account, the user behavior and project knowledge are coded into a unified relationship diagram through the collaboration information graph. To make an information graph, we first define a user item bipartite graph {(eu,yui,ei)∣eu∈U,ei∈I}, whereeuis a user entity,yuirepresents links between usersuand itemsi,eirepresents the project entity, anduandirepresent users and itemsets respectively. When there is an interaction between the two entities,yuiis set as 1. The collaboration info-graphic incorporates new data dimensions into it, where each user’s behavior can be represented as a triple(eu,R,ei).R= 1 indicates that there is an additional interactioneuandei. In this way, the user information graph can be integrated with the newly added dimension into a unified graph.
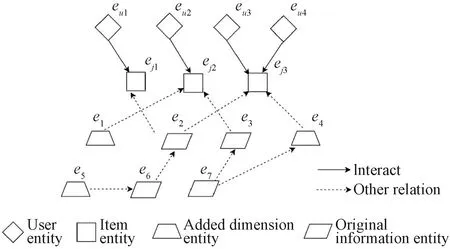
Fig. 4 Collaboration information graph structure
As shown in Fig. 5, the multi-modal information encoder takes the newly added dimension entities and the original information entities as input, and uses the entity encoder and attention layer to learn a new entity representation for each entity. The new entity representation retains its own information. At the same time, information about neighboring entities is aggregated. We use the new entity to represent the embedding in the interest prediction model.
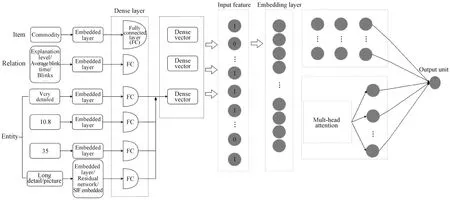
Fig. 5 Multi-modal information encoder
3.2 Factorization machine
In the CTR prediction, due to the extremely sparse input characteristics and the correlation between the input characteristics, the factorization machine model aims to fully consider the first-order features and the second-order combination characteristics when predicting the user’s CTR[19]. The regression prediction model in the factorization machine is
(4)
whereyFMis predicted output,nis the dimension of the input feature vector,xiis the feature vector for theith dimension,wiis the weight parameter of the first-order feature, andwijis the weight parameter of the second-order combination feature. In the second item, the estimated value ofwixiis taken and accumulated. There are many parameters to be learned for the second-order combination feature of the model, the number of parameters isn(n-1)/2. However, due to the sparseness of data in practical applications, this model is difficult to train. Therefore, we decompose the matrixwijintoVTV, where the matrixVis
V=[v1,v2, …,vi, …,vn],
(5)
whereviis thek-dimensional hidden vector associated withxi.
We encode different types of input data (images, texts, labels,etc.) into high-order hidden vectors. Then we combine multi-dimensional data based on the multi-modal graph attention mechanism module (multi-modal-knowledge-graphs attention layer).
3.3 DNN architecture
The DeepFM prediction model introduces DNN[20]to cascade the embedding and encoded feature vector in a fully connected layer to establish a regression or classification model. The output of each neuron is the linear weighted value of the neurons in the previous layer corresponding to the nonlinear mapping. That is, for the neurons in thel+1 layer, the corresponding output value is
a(l+1)=φ(W(l)a(l)+b(l)),
(6)
whereW(l),a(l)andb(l)respectively represent the first layer of weight matrix, thellayer of neuron output corresponding, connecting thellayer and thellayer of the bias value vector. For the nonlinear mapping function, the following ReLU function and Sigmoid function are commonly used. The corresponding expressions are
φ(d)=1/[1+exp(-d)],
(7)

(8)
wheredrepresents the input of the previous layer.
3.4 Self-attention mechanism
The self-attention mechanism was proposed in the field of image processing[21], and later used in various fields[22-26]. The purpose is to focus on certain feature information during model training. The conventional attention mechanism is to use the state of the last hidden layer of the neural network, or use the state of the hidden layer output by the neural network at a moment to align with the hidden state of the current input. The self-attention is directly weighted to the current input, which is a special case of the attention mechanism. It uses the sequence itself as the key and value vector of the data, and the output vector can be aggregated from the previous hidden output of the neural network.
A single attention network is not enough to capture multiple aspects and the multi-head attention network allows the model to focus on information from different locations and different representation spaces, and can simulate user preferences from multiple views of interest. Therefore, we adopt multi-head attention module after the hidden layer as shown in Fig. 6. The data dimensions are processed and fed into the input layer.
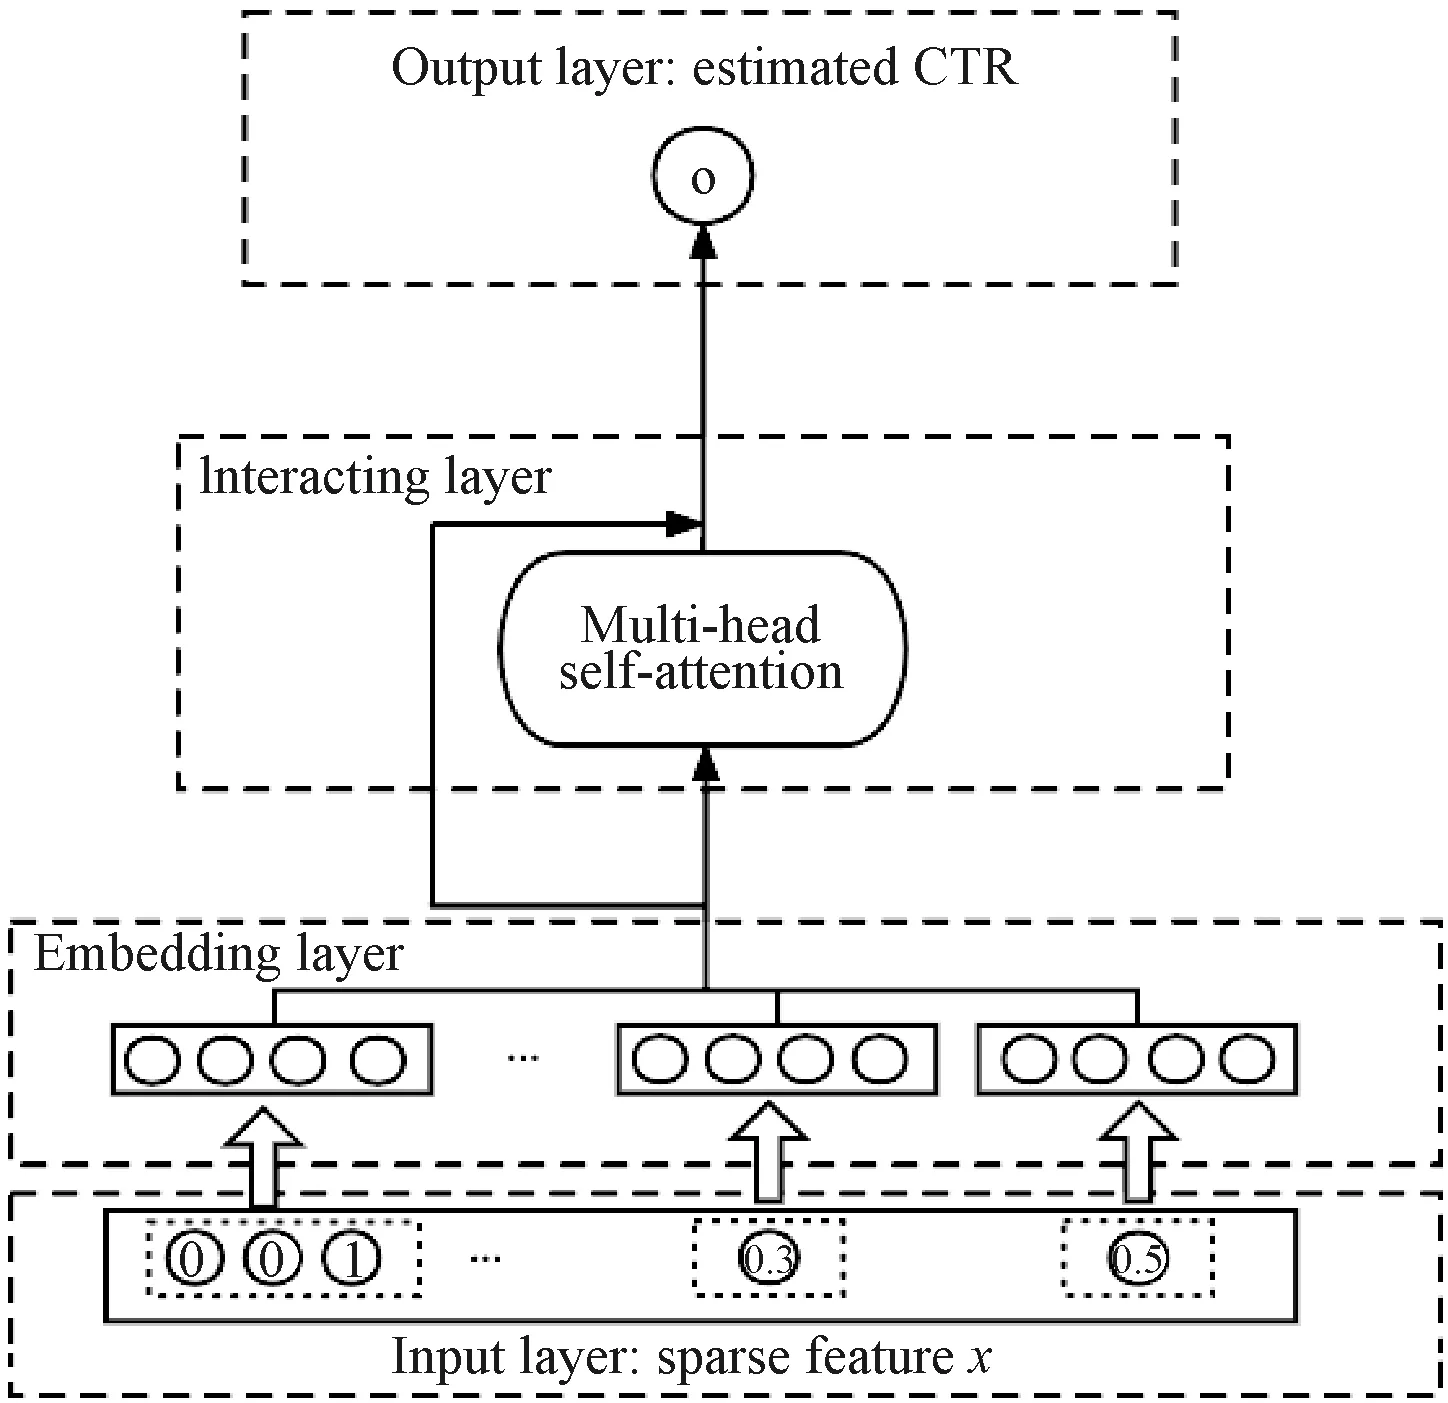
Fig. 6 DeepFM model of multi-head attention mechanism
4 Experiment and Analysis
4.1 Experiment preparation
The eye movement data set is collected manually from related industries and obtained from cooperative units, with a total of 673 pieces of data. The data set includes videos with the subject’s gaze area ranging from 30 s to 3 min, marked pictures of each area of interest, personal information, operation history and other related information. The eye tracking data set is populated and added to the public data set. In order to verify the performance of the proposed prediction model, the public data set Criteo is selected for evaluation, and the data in the data set Critro is filled with eye movement data. The data set contains more than 450 million user click events and 7-dimensional eye movement parameters. The data types include two major categories of numeric and hash values. The dimensions of click events are 13 and 26 respectively, and the proportions of positive and negative samples are 22.912 0% and 77.087 5% respectively. The data set is divided into training data set and test data set based on the ratio of 8∶2 respectively.
4.2 Interest model performance evaluation index
The interest model evaluation index uses the binary cross-entropy loss function Logloss and AUC. Logloss is defined as
(9)

AUC is defined as the area enclosed by the coordinate axis under the receive operating characteristic(ROC) curve:

(10)
whereArepresents AUC, andfpris the false positive rate. Different classification thresholds can get the true positive rate curve under different false positive rates, namely ROC.
4.3 Experimental results
4.3.1Experimentalsetup
In order to reduce the impact of the order of samples on the performance of the final model after training, we first randomize the samples in the data and divide the labeled data setDinto two parts, namely the training data setDtrainand the test data setDtest. In the experiment, the batch size is set as 512, the learning rate is set as 0.001, the scale of the embedded coding layer is 8, and the maximum supported dimension for one-hot coding mapping is 450. The effects of the probabilitypof random inactivation and the number of fully connected layers of adaptive residual DNN are studied respectively. The optimal parameters are selected, and then the improvement designed in this paper is compared with the DeepFM model.
4.3.2Hyperparameterimpactresearch
Figure 7 shows the influence of the random inactivation probabilitypand the number of fully connected layers of the adaptive residual DNN on AUC. It can be observed that when the probability of random inactivation gradually increases, the AUC performance on the test set gradually becomes more and more better, but when the probability of random inactivation exceeds 0.6, the AUC performance of the test set begins to decrease. This is because when there are too many neurons in inaction, the number of effective neurons is not enough to learn and not enough to represent the interest model as feature information. It can be also seen from Fig. 7 that, as the number of DNN fully connected layers increases, the AUC of the test set gradually increases, which is 0.856 6. The experimental results show that the random inactivation probability and the number of DNN fully connected layers have an important impact on the generalization performance of the model.
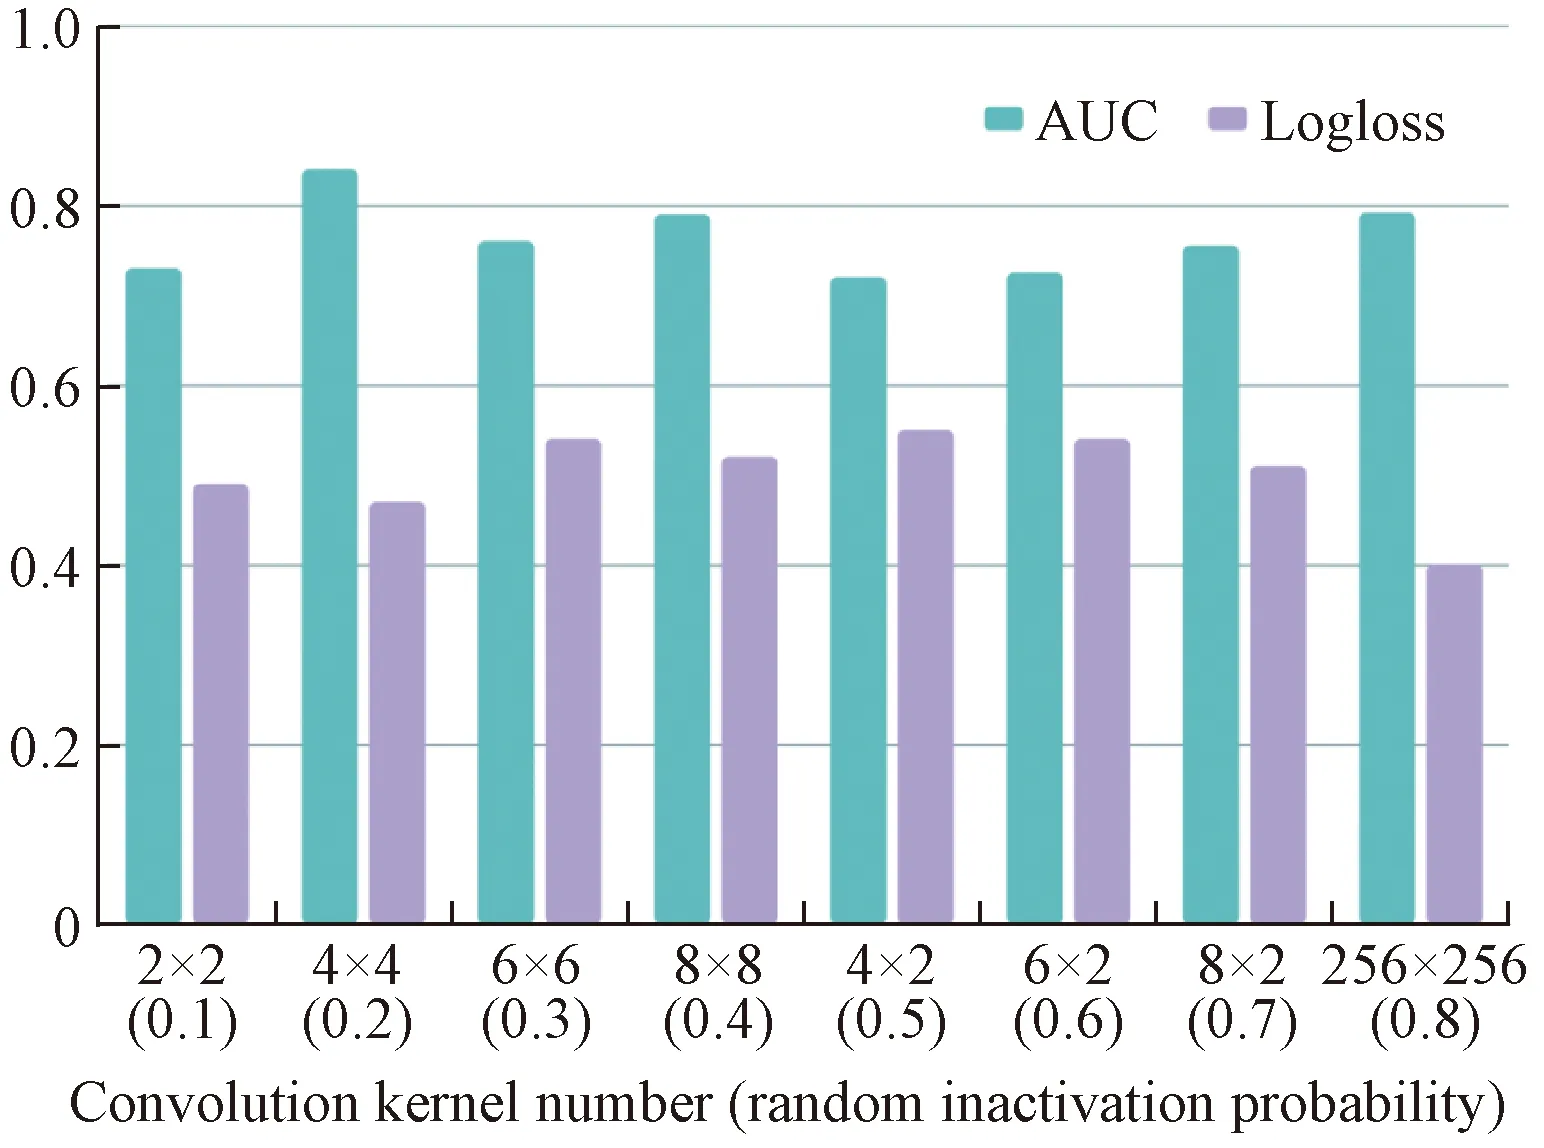
Fig. 7 AUC value of the test set under different random inactivation probabilities and different fully connected layers
4.4 Model performance evaluation
According to the experimental results in Table 1, after adding the eye movement data set, the AUC values of the logistic regression(LR) model, xDeepFM model, and DeepFM model were all improved, and the improvement rates were 2.40%, 4.46%, and 5.91%, respectively. Among them, DeepFM had the largest improvement. The combination of data dimensions will have better results. The proposed model shows the best performance. Compared with the basic model DeepFM, the AUC of the improved DeepFM on the data set Criteo increases by 5.91%, and the Logloss is reduced by 0.29%.
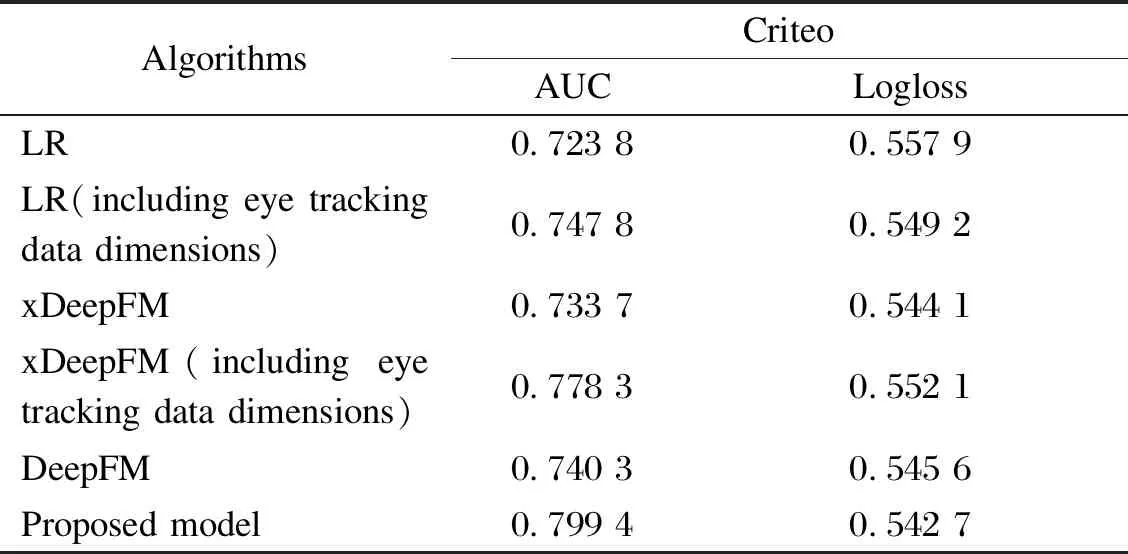
Table 1 Performance results of different models and improvements on data set Criteo
When the eye movement data dimension is added at the same time, the AUC of the proposed model on the data set Criteo is 5.91% higher than that of the basic algorithm DeepFM, and the AUC of xDeepFM on the data set Criteo is 4.46% higher than that without the eye movement data dimension. The AUC of LR on the data set Criteo is only 2.4% higher than that without the eye movement data dimension. That is, after adding the eye movement data dimension, the improvement of the xDeepFM model and the DeepFM model is larger, and the improvement of the LR model is smaller.
According to the experimental results in Table 2, the number of DNN fully connected layers is 4. Table 2 shows the performance parameters of the current mainstream interest degree predictive model after increasing the dimension of eye movement data and adding the self-attention mechanism. It can be seen that improvement 1 (increasing the dimension of eye movement data) and improvement 2 (increasing the dimension of eye movement data and self-attention mechanism) are respectively 8.25% and 9.32% better than DeepFM, which proves that eye movement data can be used as an important factor of user interest. Dimensionality and self-attention mechanism also improve the accuracy of the interest model to a certain extent.

Table 2 AUC value of the test set under different improvements
5 Conclusions
This paper proposes a prediction model of interest in live shopping based on eye movement features and DeepFM. In this model, we develop eye movement indicators, process eye movement videos through data processing algorithms, and add data dimensions to the original data set through information filling. We apply the DeepFM architecture in the proposed model. In addition, in order to effectively learn important features from different heads and emphasize the relatively important features, the multi-head attention mechanism is introduced into the interest model. Experiment on public data set Criteo shows that, compared with the DeepFM algorithm, the model proposed in this paper has lower Logloss and better AUC performance after increasing the data dimension and introducing the multi-head attention mechanism.
杂志排行
Journal of Donghua University(English Edition)的其它文章
- Classification of Preparation Methods and Wearability of Smart Textiles
- Computer-Based Estimation of Spine Loading during Self-Contained Breathing Apparatus Carriage
- Click-Through Rate Prediction Network Based on User Behavior Sequences and Feature Interactions
- Object Grasping Detection Based on Residual Convolutional Neural Network
- Time Delay Identification in Dynamical Systems Based on Interpretable Machine Learning
- Online Clothing Recommendation and Style Compatibility Learning Based on Joint Semantic Feature Fusion
