Extraction of Feature Points for Non-Uniform Rational B-Splines(NURBS)-Based Modeling of Human Legs
2022-09-29WANGXiWUZongqian吴宗谦LIQiao
WANG Xi(王 玺), WU Zongqian(吴宗谦), LI Qiao(李 乔)
1 College of Information Science and Technology, Donghua University, Shanghai 201620, China
2 Engineering Research Center of Digitized Textile & Fashion Technology, Ministry of Education, Shanghai 201620, China
3 College of Textiles, Donghua University, Shanghai 201620, China
Abstract: Methods of digital human modeling have been developed and utilized to reflect human shape features. However, most of published works focused on dynamic visualization or fashion design, instead of high-accuracy modeling, which was strongly demanded by medical or rehabilitation scenarios. Prior to a high-accuracy modeling of human legs based on non-uniform rational B-splines (NURBS), the method of extracting the required quasi-grid network of feature points for human legs is presented in this work. Given the 3D scanned human body, the leg is firstly segmented and put in standardized position. Then re-sampling of the leg is conducted via a set of equidistant cross sections. Through analysis of leg circumferences and circumferential curvature, the characteristic sections of the leg as well as the characteristic points on the sections are then identified according to the human anatomy and shape features. The obtained collection can be arranged to form a grid of data points for knots calculation and high-accuracy shape reconstruction in future work.
Key words: 3D scan; digital human modeling; non-uniform rational B-splines(NURBS); feature extraction
Introduction
With the rapid development of noncontact measurement techniques such as the 2D image measurement and 3D scanning technologies, shapes representation based on point clouds has been accepted as common description of surfaces[1-4], which has induced related methods of digitalization or modeling, like polygonal mesh[5-6], or constructive solid geometry modeling[7-8], or surface fitting[9-10]. However, in the scenarios of providing customized design of wearing products[1, 11-15], great challenges have been faced, especially the strong requirements of high-accuracy modeling by medical and rehabilitation applications[16].
Generally, the method of polygon mesh is of lower-accuracy sampling, thus more suitable for fast prototyping and shape animations[17]. The constructive solid geometry modeling focuses more on body building other than surface representation[7-8, 13]. The surface fitting is to fit the point cloud of scanned shapes with a parametric 3D shape, either tuned by digitalized parameters, or by location and number of feature points[9-10, 18]. For extracting the shapes of human legs for customized design of medical compression stockings, surface fitting is the most direct and effective way to realize digitalization and parameterization. However, the most frequently used scheme during reconstruction of shapes is interpolation, which requires larger number of feature points to improve smoothness while representing the shape. This would inevitably lead to the dilemma of balance between accuracy and computation efficiency. Moreover, when talking about fitting, the selection of feature points shall be in accordance with the anatomy facts, other than equidistantly picked by algorithm.
To overcome the above-mentioned problems, a non-uniform rational B-splines (NURBS)-based modeling is preferred[10, 19-21]. The reason lies in that, once the characteristic data points are determined, the NURBS-based model can naturally smooth the transition areas within those feature points, which is a promising solution for both accuracy and computation efficiency.
Hence in this work, in terms of modeling the human legs for customized design of medical compression stockings, the characteristic data points are to be firstly extracted. Methods are proposed on the data initialization, resampling, crucial cross section identification as well as characteristic point identification according to human anatomy. The obtained data points can be further arranged to form a grid for inverse computation of knots, vectors and reconstruction of a high-accuracy model of the human legs.
1 Methods: Extraction of Feature Points for Human Legs
Protocol of 3D scanning using the TC2system ([TC2] incorporation, USA) has been presented elsewhere[18]. Right legs were firstly intercepted from the scanned shape of whole body for analysis, which can be easily conducted when crotch is located. A position standardization process follows to make the leg upright, which is then resampled by horizontal equidistant cross sections. This resampling is to reduce the noises of points while representing the shape.
After that, the crucial sections are extracted and further analyzed to yield the feature points. The whole process can be shown in the schematic diagram as in Fig.1.

Fig. 1 Flowchart of this work
1.1 Initialization and resampling
Legs can be easily segmented with identified crotch shown in Fig. 2(a). To further make the leg upright, principal component analysis (PCA) was performed on the original data to obtain the orientation vector of the leg, according to which the leg could be placed normally via rigid body rotation, since the angle between the direction vector and theZaxis was used as the rotation angle. This process of data initialization involves no technic issues and will not be elaborated here.
After data initialization, shape resampling and noise reduction were simultaneously performed via a set of horizontal planes. A new set of data points were calculated when the plane intersected with the scanned shape, as in the following steps.
(1) For each planez=zi, search the nearby data points using a preset point-to-plane distance threshold.
(2) For each pointpain the nearby data set, search the closest data pointpbon the other side of the plane. The line determined by the two data pointslabintersect with the plane atpAshown in Fig. 2(b).
(3) Curve-fit the collection of intersection pointspAin the polar coordinates, resample the curve with a line space of angles between -π and π, and then transform to Cartesian coordinate system shown in Figs. 2(c)-2(d). HerepAis the representative point, and there are many similar points.θis the angle converted to polar coordinates.
In this work, 15-order fitting is implemented to largely ensure the degree of fitting to as high as 0.999 9 while avoiding overfitting.
To demonstrate the whole process, the extracted original leg and the resampled upright can be shown in Fig. 2(e).

Fig. 2 Data initialization and resampling: (a) segmented leg from 3D scanned body; (b) schematic diagram of calculating intersections by the resampling plane; (c) data points of intersections in Cartesian coordinates; (d) data points in polar coordinates; (e) resampled leg
1.2 Identification of featured cross sections
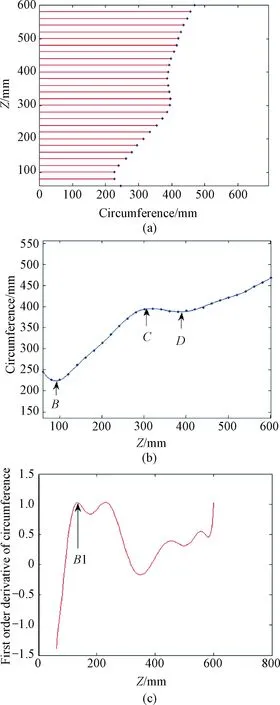
As in above, the extracted leg is placed normal and resampled to a set of horizontal planes. Circumferences of each cross section can be calculated, giving the limb circumferences subject to height of leg,i.e., the height-circumference curve shown in Fig. 3(a), which can be further fitted to a continuous curve (with coefficient of determinationR2= 0.999 3). For human legs, there are several crucial locations that are related to the human anatomy. According to the widely-used standards such as RAL-GZ387 and BS∶6612, totally four crucial locations (B,B1,C,D) are responsible for the shape variation of human legs.
Among the four locations,Bcorresponds to the smallest circumference (around the ankle),Cis the location of the largest circumference (over the belly of gastrocnemius), andDis the local minimum lower than the tuberositas tibiae. Those three locations can be identified through searching the peaks and valleys of the height-circumference curve shown in Fig. 3(b). However, as forB1, which is the connection point of tendon and the gastrocnemius, the first order derivative ofCis to be analyzed shown in Fig. 3(c).

Fig. 3 Identification of featured cross sections: (a) the height-circumference curve; (b) B, C, and D identification; (c) B1 identification through the first order of derivative of circumference
As can be seen in Fig. 3(c), the localized maximum corresponds to the sudden thickness increment during the transition from tendon to muscle.
Once the crucial locations are identified, the four cross sections corresponding to the four locations (B,B1,C,D) can be extracted, from which the feature points can be identified.
1.3 Identification of featured points
Due to the anatomy structure and relative locations of human tissues, especially the location of muscles and bones, the contour shape,i.e., the circumferential shape of the leg varies from each other. For further construction of NURBS modeling, those feature points shall largely reflect the shape characteristic. There are some published works working on the parameterization of the cross sections, involving different sub-section modeling schemes[18]. Here we incorporate a simple method of finding the characteristics points around the 2D cross sections.
For a 2D shape, the curvaturekcan be given as
wherexandyare coordinates in the 2D plane.
However, this would cause instability of the curvature trend, due to discrete sampling of the shape. To improve the smoothness of curvature, a 3-point curvature calculation scheme is implemented. The basic idea is to get the radius of a circle determined by the three neighboring data points.
As shown in Fig. 4, the curvature at the middle point (x2,y2) can be estimated by
wheretsatisfies the following conditions shown as
(x,y)|t=-ta=(x1,y1),
(x,y)|t=0=(x2,y2),
(x,y)|t=tb=(x3,y3),
where
and (a1,a2,a3) and (b1,b2,b3) are unknowns, which can be easily solved from the following matrix equations shown as
Considering the boundary conditions,
And finally the curvaturekcan be given as
Using one arbitrarily chosen cross section, the curvature distribution and identification of feature points can be demonstrated in Fig.4.

Fig. 4 Curvature calculation and identification of feature points: (a) schematic diagram of 3-point curvature calculation; (b) curvature distribution for a cross section; (c) feature points identification via analysis of curvature
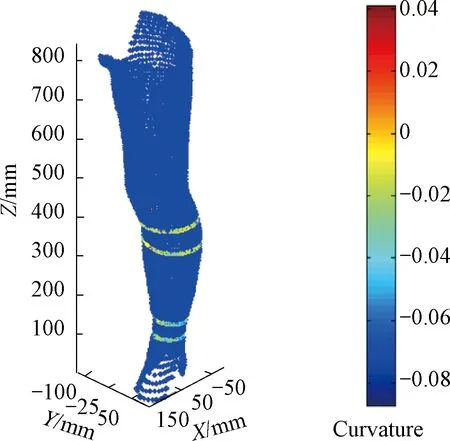
Using the above equations, curvature of each point can be obtained, which can be plotted in Figs. 4(b) and 4(c). Through analyzing the trends of the curvature variation, the localized peaks and valleys of curvaturesP1-P7, corresponding to corners (shape transition locations between different tissues or subsection) and smooth position (locations of current tissue or subsection) are successfully identified shown in Fig. 4(c). The identified feature points can further be plotted along with the leg shape as shown in Fig. 5.

Fig. 5 Feature points marked in the leg shape model
2 Discussion
As aforementioned, once the feature points are extracted, they can be properly arranged to form a quasi-rectangular grid for later calculation of control points and knots vectors. The series of methods are in accordance with current valid standards, and hence can provide much more detailed information of human legs for high-accuracy re-construction. To obtain a quasi-rectangle grid of points for NURBS surface fitting, the following challenges are expected to be lying in unifying the number of points for all cross sections, and in that to optimize the knot vector for better fitting.
Using the extracted feature points as above, knots can be calculated and the NURBS surface can be generated. The average relative error between original model and the NURBS model is observed as low as 0.3%, much higher compared to previous work, which is to be enclosed in another on-going study.
3 Conclusions
In summary, this paper generally reported and preliminary demonstrated a series of related methods to prepare feature data points for a NURBS-based high accuracy of human leg, including data initialization, resampling based on multi cross sections, and feature points identification. It is worth-mentioning that the proposed methods are all according to the anatomy-based mechanism underneath, and therefore is more efficient to describe the shape characteristics of human legs.
杂志排行
Journal of Donghua University(English Edition)的其它文章
- Time Delay Identification in Dynamical Systems Based on Interpretable Machine Learning
- Classification of Preparation Methods and Wearability of Smart Textiles
- Object Grasping Detection Based on Residual Convolutional Neural Network
- Online Clothing Recommendation and Style Compatibility Learning Based on Joint Semantic Feature Fusion
- Smart Clothing Fabric Color Matching with Reference to Popular Colors
- Color-Changing Fabric System with Temperature Control
