Investigation on synergistic deposition of wax and hydrates in waxy water-in-oil (W/O) flow systems
2022-09-23YngLiuXioFngLvQinLiShiDongZhouBoHuiShiHuiDuYunLeiPengFeiYuShngFeiSongJingGongBingCiSun
Yng Liu , Xio-Fng Lv , Qin-Li M *, Shi-Dong Zhou , Bo-Hui Shi , Hui Du ,Yun Lei , Peng-Fei Yu , Shng-Fei Song , Jing Gong , Bing-Ci Sun
a Jiangsu Key Laboratory of Oil and Gas Storage and Transportation Technology, Changzhou University, Changzhou, Jiangsu, 213164, China
b Institute of Petroleum Engineering Technology, Sinopec Northwest Oil Field Company, Urumqi, Xinjiang, 830011, China
c National Engineering Laboratory for Pipeline Safety/State Key Laboratory of Natural Gas Hydrate,China University of Petroleum-Beijing, Beijing,102249,China
d CNPC Safety and Environmental Protection Technology Research Institute Co. Ltd, Beijing,102206, China
Keywords:Flow assurance Wax Hydrates Flow properties Synergistic deposition
ABSTRACT Elucidating the synergistic effect of wax and hydrates, involving formation, aggregation and deposition,is imperative to the operation and transportation safety for offshore petroleum fields.To understand the characteristics and mechanism of synergistic deposition of wax and hydrates, flow and deposition experiments of systems with different wax contents (0-2.89 wt%), initial flow rates, pressures and temperatures were conducted in a high pressure visual flow loop. According to the flow rate and pressure drop data as well as the visual window observation, four different types of plugging scenarios of waxhydrate coexisting systems with different flow properties and wall deposition state were summarized,including rapid plugging, transition plugging, gradual plugging type I and gradual plugging type II.Compared with the wax-free system after hydrate formation,even with the addition of anti-agglomerant(AA)with the same concentration,wax-hydrate coexisting systems could not reach stable hydrate slurry flow state, indicating that the existence of wax deteriorated the performance of AA. Aside from the influence of wax crystals on hydrate agglomeration,it was found that wax deposition layer would alter the adhesion and bedding of hydrates,resulting in the variation of flow properties and wall deposition state.For low wax content systems (0.75 wt%) where rapid plugging occurred, the synergistic effect between wax and hydrates promoted the formation of wax-hydrate coupling aggregates,resulting in severe local deposition when the coupling aggregates attained critical deposition size and consequently decreasing flow rate, forming a vicious circle of decreasing transportability. Since bedding of coupling aggregates was hindered by the uniformly coated wax deposition layer on pipe wall, gradual plugging rather than rapid plugging occurred in medium wax content systems (1-1.25 wt%), predominately caused by the gradual increment in viscosity of waxy hydrate slurry. For relatively high wax content systems (2.89 wt%), hydrate formation and plugging did not occur, due to the insulation effect of wax deposition layer. A physical model for the synergistic deposition of wax and hydrates was also presented, which was meaningful to the development of a mathematical model for the prediction of blockage formation and risk analysis.
1. Introduction
Regarding the ever-growing demand on natural gas around the world, it is imperative to enlarge the amount of natural gas production (BP, 2021). Abundant oil and gas resources exist in offshore reservoirs and, particularly, deep-sea fields, which unfortunately bring about difficulties in exploitation due to their environment of low temperature and high pressure (Sloan and Koh,2007; Zhang et al., 2019). The subsea transmission lines, where multiphase products flow (potentially consisting of crude oil or condensate, natural gas, water, sands, clays and etc.), are prone to be affected by flow assurance threatening issues,such as hydrates,wax and asphaltenes (Melchuna et al., 2020). These issues are inclined to form or precipitate under appropriate thermodynamic conditions,depositing to the cold pipe wall,reducing the flow area,and resulting in pipeline blockage or even casualties (Sloan and Koh, 2007; Aman, 2021; Liu et al., 2020a). Collaborative efforts between industry and academia have been put in seeking for the mechanistic models to predict pipeline blockage caused by these issues(Huang et al.,2011;Haj-Shafiei et al.,2014;Wang et al.,2016;Liu et al., 2020b; Mahir et al., 2021).
Although there are extensive studies focusing on the formation or precipitation, agglomeration and deposition of a single flow assurance issue(Aman,2021;Geest et al.,2021),the fact that more than one of these issues are probable to coexist in the submarine oil and gas pipelines simultaneously is not negligible.The coexistence scenarios will pose greater challenges to the safety and economics of deepwater operation and transportation (Gao, 2008; Stoporev et al., 2019). Generally speaking, wax and hydrates are considered as two of the most major hazards for flow assurance industry,especially in gas reservoirs with high condensate content, coexistence of which have gained increasingly attention (Olivia et al.,2012; Darabonia et al., 2015; Liu et al., 2018; Song et al.,2021).
Based on the researches of the last decades, it is known that blockage caused by hydrate formation is difficult to predict,and the mechanism of hydrate deposition has not been comprehensively understood so far, while wax deposition is much easier to be predicted by the already-developed mathematical models. Thus,plugging mechanisms of hydrates can provide useful information to that of the coexistence system. Turner (2006) presented a mechanistic model of hydrate plugging, which consisted of four continuous stages, namely water entrainment or emulsification, hydrate shell growth,agglomeration and plug.Lately,Lachance et al.(2012)and Aman et al. (2015) pointed out that two aspects of effect of hydrate formation in oil-dominated systems should be considered:one is the increment in fluid viscosity due to the agglomeration of hydrate particles;the other is the adhesion of hydrates to the pipe wall that results in the decrement in flow area. The governing factors of hydrate agglomeration and wall adhesion were deduced to be the cohesive force between hydrate particles (Aman et al.,2011; Hu and Koh, 2017) and the adhesive force between hydrates and the pipe wall(Aspenes et al.,2010;Sj¨oblom et al.,2010).Micro-mechanical force(MMF)apparatus was used to measure the above two forces, in order to provide insights into the blockage mechanisms (Aman et al., 2011; Qin et al., 2020). Moreover,Hernandez(2006)and Grasso(2015)suggested that migration and accumulation of hydrates from the bulk phase to the pipe wall due to the increase in particle concentration or the decrease in flow rate should also be considered: for homogeneous suspension flow or heterogeneous suspension flow, a stationary bed of hydrates formed after the emergence of moving bed, leading to the dramatically decrease in flow area.Chen et al.(2015)observed the conversion of water network to hydrate network in their oildominated systems, and presented that the hydrate network would shrink and deposit to the pipe wall. Ding et al. (2017)claimed that hydrate deposition, which occurred in their w/o flow systems, could be divided into four stages: initial formation and deposition, deposit sloughing, secondary formation and redeposition, and deposit annealing.
There are literatures which indicate that wax affects the nucleation (Gao, 2008; Raman and Aichele, 2017; Shi et al., 2018;Liu et al., 2019), growth (Shi et al., 2018; Guo et al., 2021) and agglomeration (Liu et al., 2018; Wang et al., 2020; Brown et al.,2020) process of hydrates, the rheological properties of hydrate slurries(Shi et al.,2018;Liu et al.,2021;Chen et al.,2021)as well as the deposition characteristics (Gao et al., 2008; Liu et al., 2018) in oil-dominated systems, where experiments in rheometers, MMF apparatus, rocking cells, autoclaves and flow loops are conducted.Based on the experiments in high-pressure autoclaves, some researchers suggested that wax crystals could provide the necessary nucleation sites for hydrate formation(Ji,2004;Raman and Aichele,2017),while the others(Zheng et al.,2017;Shi et al.,2018;Liu et al.,2019) argued that wax crystals inhibited hydrate nucleation. This divergence may be ascribed to the difference in their experimental materials: crude oil versus diesel oil. The influence of asphaltene and resin on hydrate formation should be further clarified (Ning et al., 2021). Shi et al. (2018) suggested the presence of wax inhibited hydrate growth under low pressure conditions. Hydrate growth images at oil-water interface were captured by Song et al.(2021) recently. They found that the morphology of the hydrate shells formed under different wax contents varied. Gao (2008)found that when wax and hydrates coexisted in their rocking cell apparatus, the amount of deposit increased compared to the independent wax deposition scenario. Brown et al. (2020) proposed that wax could significantly alter both the cohesive and adhesive forces of hydrates based on their MMF experiments. Wang et al.(2020) obtained similar MMF results with Brown et al. In other words, wax pose impact on the agglomeration and wall adhesion process of hydrates. The conjecture about the effect of wax on the cohesive force could be further supported by the experimental results of Liu et al. (2018), who used a high-pressure flow loop equipped with PVM probe. They claimed that wax-hydrate coupling aggregates were discerned by the PVM probe, which showed different morphology and size compared to the normal hydrate aggregates.It was also found that wax crystals suppressed the effectiveness of AA, as flow loop plugging occurred in the presence of wax and hydrates.Recently,Liu et al.(2021)suggested that wax-hydrate coupling aggregates led to the additional increment in the viscosity of waxy hydrate slurry due to the phase interactions among wax, hydrates and water droplets.
Previously,we have reported three plugging scenarios in 0.75 wt% wax content w/o systems after hydrate formation, namely rapid plugging,transition plugging and gradual plugging(Liu et al.,2018).The existence of wax-hydrate coupling aggregates was verified and conjectured to be the main cause of rapid plugging.However,to the best of our knowledge, the flow properties and deposition characteristics of flow systems with different wax contents after hydrate formation have not been reported and compared yet.For one thing,it can be deduced from the above that wax participates in the whole process from the initial hydrate formation to the final hydrate deposition and bedding. In other words, since the final deposition and bedding state of hydrate is subject to its preorder physical processes, the synergistic deposition of wax and hydrates actually refers to an integral physical process. For another thing,flow loop is a useful tool to simulate the flow conditions of actual pipelines (Sun et al., 2021). A high-pressure flow loop equipped with visual windows can provide meaningful information on wall deposition characteristics of the wax-hydrate synergistic system.
In this work,plugging scenarios in 0.75,1,1.25 and 2.89 wt%wax content w/o systems with hydrate formation were investigated,which were characterized by the flow properties and wall deposition state.A novel type of gradual plugging scenario was observed.Predominating factors that had an impact on pipeline plugging,including wax content, initial flow rate, initial pressure and temperature, were comprehensively analyzed. A physical model of pipeline plugging was then proposed considering the fact that the occurrence of pipeline plugging with the coexistence of wax and hydrates is a complicated multi-physical coupling process. The results of this work can cast some light on the understanding of blockage mechanism of wax-hydrate synergistic systems, which enable opportunities to develop new low-dosage hydrate inhibitors and mathematical models that are able to quantitatively predict hydrate blockage risk in multiphase transmission lines.
2. Material and methods
2.1. High-pressure visual flow loop
The experiments were conducted in a high-pressure visual flow loop system,as shown in Fig.1.The test section of the loop is made of stainless-steel pipe with 25.4 mm internal diameter, and the total length of which is 30 m.A separator with a volume of 220 L is used to provide the gas-liquid mixture space. The maximum working pressure of the loop is 150 bar, which is supplied by two high-pressure gas cylinders. The working temperature ranges from -20°C to 100°C, which is controlled by four coolant baths(model FP51-SL, Julabo Technology Corporation). The flow in the loop is sustained by a magnetic centrifugal pump with a flow rate up to 2200 kg/h. The following parameters: pressure, pressure drop, flow rate and density, are acquired by the corresponding transducers (Endress-Hauser Corporation) with the precision of 0.1 bar, 0.1 kPa,0.1 kg/h and 0.1 kg/m3,respectively.Temperatures are logged by platinum resistance thermometers (Kunlun Gongkong Corporation) distributed along the loop with a precision of 0.1°C. A FBRM probe (model D600X, Mettler-Toledo Corporation)and a PVM probe (model V819, Mettler-Toledo Corporation) are installed at the inlet of the flow loop, which can characterize the microscopic behaviors of water droplets and hydrate particles.
Two visual windows with a good visual transparency are distributed at two middle locations of the loop, each of which is composed of two sight glasses that were installed on the front center and back center of the pipe.With the help of a CCD camera that can record in real time,the visual windows can provide a clear observation of flow patterns and wall deposition states (Li et al.,2013; Ding et al., 2017). As shown in Fig. 2a, the sight glass is of 90 mm length and 30 mm width,while the rectangle area marked by red dashed lines (60 mm × 20 mm) is selected for the wall deposition analysis. In order to exclude the influence of other undesired light sources, a shading cover and a LED light source are used (see Fig. 2b).
2.2. Materials
The materials used in the experiments include deionized water,natural gas, diesel oil, a paraffin mixture and AA, detailed information about which can be found in our previous work(Liu et al.,2018). The carbon number of the paraffin mixture ranges from C28to C41. Paraffin mixture is dissolved in diesel, so as to obtain controllable wax contents and thus focus on the effects of wax on the flow properties of hydrate slurries and plugging scenarios.The combined AA is a mixture of Span 20, which serves as the emulsifier, and esters polymer, which works as the effective antiagglomerate.

Fig.1. Schematic diagram of the high-pressure hydrate flow loop.
2.3. Procedures for the experiments
Water-in-oil systems composed of 80 vol%diesel oil and 20 vol%deionized water with 1.0 wt%AA were used in all the experiments.AA concentration is defined as the mass fraction of AA to water.Five sets of wax contents (0, 0.75, 1, 1.25 and 2.89 wt%), four target temperatures of water bath(-1,1,3 and 5°C),four initial pressures(0, 50, 60 and 70 bar) and three initial flow rates (1120,1400 and 1640 kg/h)were selected.The wax content is defined as the weight fraction of wax to diesel oil under 20°C.The specific experimental conditions for the hydrate formation and flow/plugging experiments are listed in Table 1.The experiments without the addition of wax as well as the experiments under ambient pressure were carried out to be comparative tests for the other experiments with both wax and hydrates. In particular, case 12,13 and 14 were performed at least three times to verify the reproducibility of flow experiments. The specific procedure for the flow experiments can be found in Liu et al. (2018, 2019), while Fig. 3 illustrates the variation trend of target temperature. Hydrate equilibrium temperature was calculated by Chen-Guo model (Chen and Guo, 1998),while hydrate formation temperature can be characterized by the abrupt increase in system temperature curve(Liu et al.,2019).Wax appearance temperature(WAT)is measured by DSC(see subsection 2.4). For cases 4-17, WAT is always higher than the hydrate formation temperature, which means that the occurrence of wax precipitation is prior to that of hydrate formation for all the pressurized wax containing systems in this work.For the systems with higher wax content, WAT is larger than hydrate phase equilibrium temperature (case 21). Note that 50% reduction in flow rate (Liu et al., 2018) is still regarded as the criteria of the occurrence of flow loop plugging.
2.4. Measurement of WATs and calculation of wax deposition layer thickness
An ambient-pressure DSC (model Q20, TA Instruments) was used to measure the WAT of the experimental materials. Table 2 tabulates the WAT of the samples with different wax contents using DSC,and the average thickness of wax deposition layer of flow experiments. According to the thermograms that are shown in Figure S1 in Supplementary Information, the heavy ends of diesel oil itself have little or no influence on the precipitation of added wax at the experimental temperatures.For the method to calculate the average thickness of wax deposition layer, please refer to Supplementary Information-B.
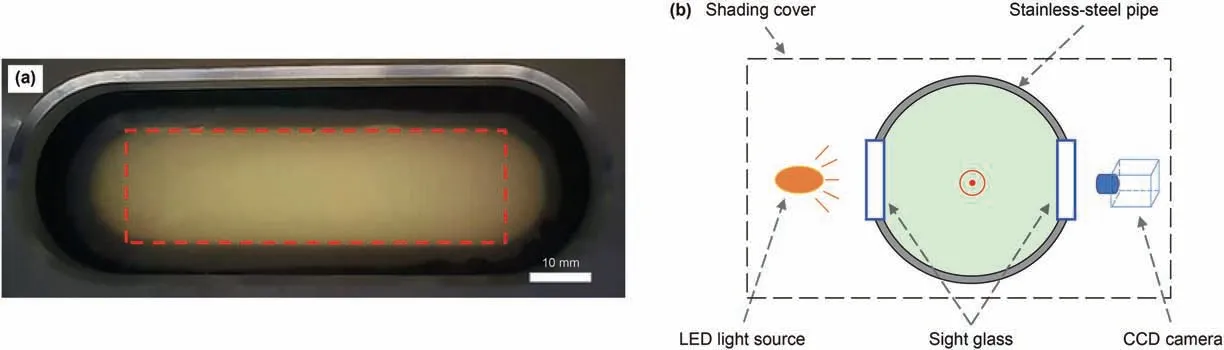
Fig.2. (a)Photograph of the visual window.Red dashed rectangle is added to guide the eye.(b)Profile of the visual window and CCD camera.A shading cover is used to exclude the influence of other undesired light sources.
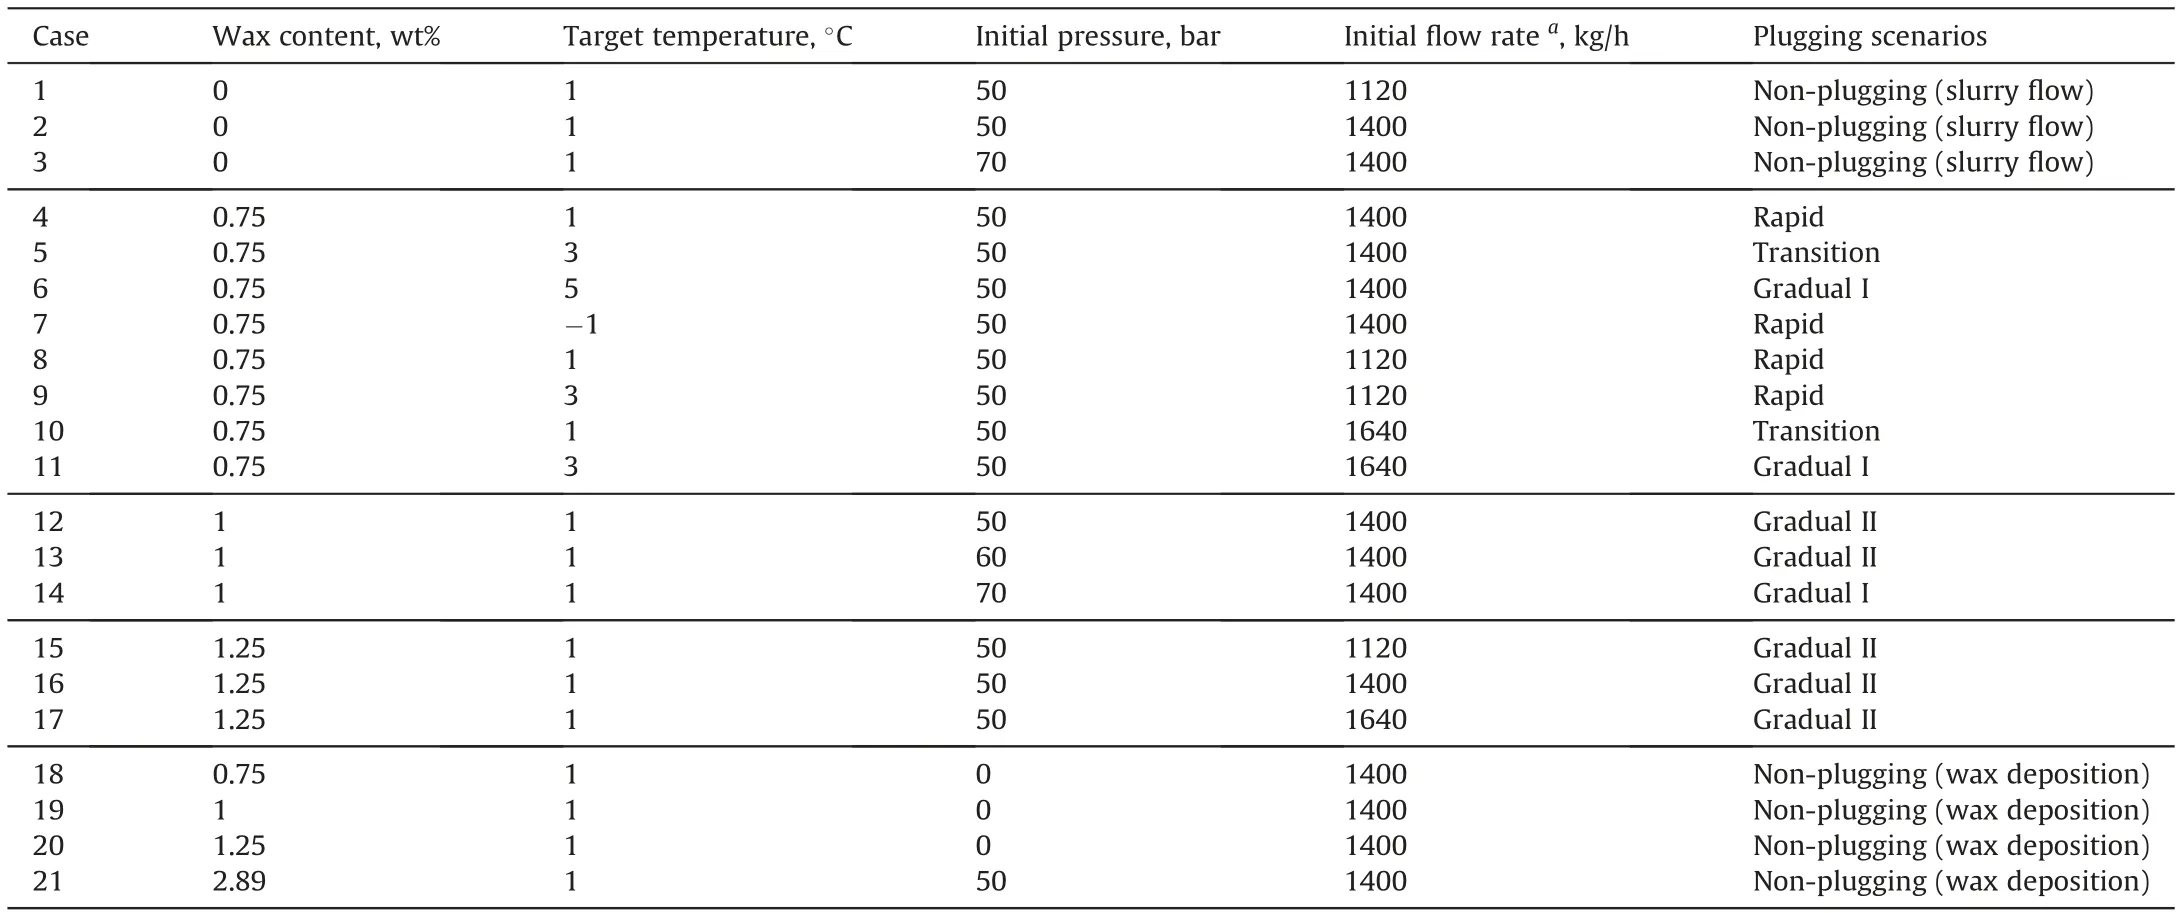
Table 1 The different specific experimental conditions and the corresponding plugging scenarios using the same water cut and AA dosage.
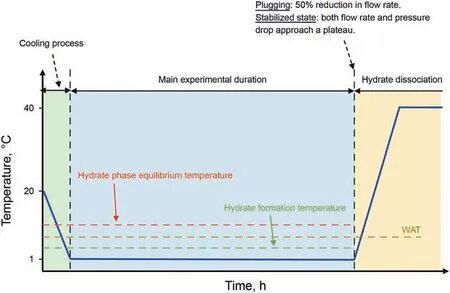
Fig.3. Schematic diagram of variation trend of coolant bath target temperature of the whole experimental process.
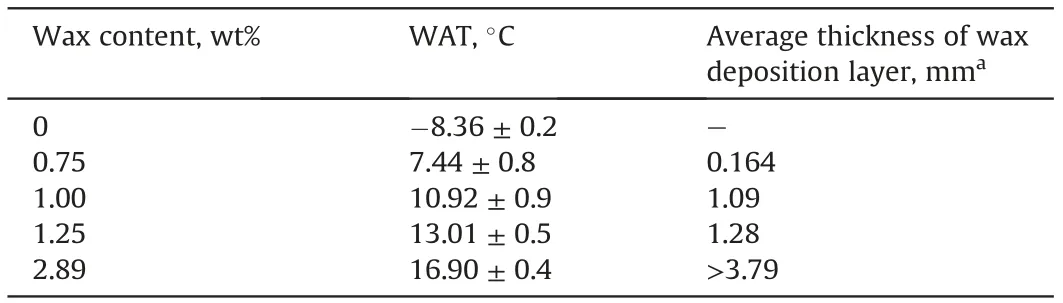
Table 2 WAT of the oil samples with different wax contents and the average thickness of wax deposition layer.
2.5. Determination of hydrate volume fraction
Based on the equation of state for real gas, hydrate volume fraction in the flow loop can be obtained by Eq.(1)(Liu et al.,2018).
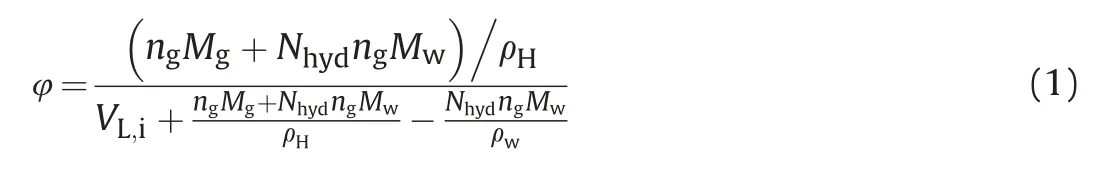
where φ is the hydrate volume fraction;ngis the total amount of gas consumption, which can be calculated based on the equation of state for the real gas; Mgis the average molar mass of natural gas,kg/mol;Nhydis the hydration number(for natural gas,Nhyd=5.85);Mwis the molar mass of water,kg/mol;ρHand ρware the densities of the hydrate and water respectively, kg/m3; and VL,iis the initial volume of the liquid phase, m3.
3. Results and discussion
3.1. Flow properties of different plugging scenarios
As shown in Fig.4,pressure drop,flow rate and hydrate volume fraction during the experimental process of the flow system with 0.75 wt%wax content under initial pressure of 50 bar(case 4),the flow system without wax under initial pressure of 50 bar (case 2)and the flow system with 0.75 wt% wax content under ambient pressure(case 18)are compared.For case 18,wax deposition occurs when the system temperature is lower that WAT. Then pressure drop gradually increases and flow rate gradually decreases due to wax deposition.But the variation of flow rate and pressure drop is marginal due to the low wax content.
For case 2, the main experimental process after hydrate
formation can be divided into initial hydrate fast-growing and aggregation phase,dynamic recovery phase as well as balanced phase(Liu et al.,2018).Finally,a stable slurry flow state is reached due to the function of AA. As seen, system pressure drop increases from the initial 15 kPa to the final 21.9 kPa, an approximately 46% increase, and flow rate decreases from 1425 kg/h to 1308 kg/h, an approximately 8% decrease. On one hand, hydrate deposition in case 2 is negligible, and the flow area nearly remains unchanged;on the other hand, the increase in fluid viscosity (w/o emulsion:7.95 mPa s;hydrate slurry:16.7 mPa s)is prominent.Based on the Darcy-Weisbach hydraulic formula, Eq. (2),although the exponent of viscosity term equals to that of the flow rate term under laminar flow, the influence of viscosity increment on the pressure drop is larger than that of the flow rate in case 2. Thus, pressure drop increases as the flow rate slightly decreases.

Where Δp is the pressure drop,Pa;v is the kinetic viscosity of fluid,m2/s;β and m are the parameters that determined by flow region(for laminar flow, β = 4.15, m = 1; for hydraulic smooth zone,β=0.0246,m=0.25);Q is the flow rate,m3/s;ρ is the fluid density,kg/m3;D is the flow diameter,m;L is the length of the pipeline,m.
As for case 4,the onset of wax deposition and hydrate formation can be judged by the first and the second deflection point of the pressure drop curve respectively (Liu et al., 2019). Then wax deposition phase(I)and hydrate formation/plugging phase(II)can be divided. 30 min after hydrate formation, flow rate decreases from the initial 1380 kg/h to 680 kg/h, an approximately 50%decrease, pressure drop increases from 15 kPa to 54.8 kPa, an approximately 2.6-fold increase. A rapid plugging scenario occurs,where pressure drop rises dramatically and flow rate drops by half abruptly. This type of plugging is presumably attributed to the emergence of wax-hydrate coupling aggregates that result in the sharp increase in fluid viscosity and local severe deposition (see subsection 3.2),which have been evidenced by the PVM probe and visual window observation(Liu et al.,2018).Thus,even with a fairly small amount of hydrate volume fraction and low wax content,the coexistence of wax and hydrates, in other words, the synergistic effect between wax and hydrates, lead to the final pipeline blockage, which is different from the single wax-free or hydratefree situation.
As shown in Fig. 5, for 0.75 wt% wax content systems with different target temperature or initial flow rate(case 6,5°C;case 11,3°C, 1640 kg/h), pressure drop gradually decreases with the decreasing flow rate in case 6 and case 11. Specifically, a 50%reduction in both pressure drop and flow rate is observed in case 11.Because both the size and the amount of wax-hydrate coupling aggregates is smaller due to the higher target temperature and flow rate,the pipe flow is capable of carrying these aggregates,and the increase in fluid viscosity along with hydrate volume fraction is much slower (final viscosity of waxy hydrate slurry of case 6:18.3 mPa s). Finally, gradual plugging scenario occurs. Detailed plugging mechanisms of cases 4-11 can be found in Liu et al.(2018).
Fig.6 illustrates the comparison of pressure drop,flow rate and hydrate volume fraction among the flow system with 1 wt% wax content under initial pressure of 50 bar (case 12), the flow system without wax under initial pressure of 50 bar(case 2) and the flow system with 1 wt%wax content under ambient pressure(case 19).Comparing case 18 and case 19, as the wax content increases, the variation of flow properties caused by wax deposition becomes evident. Due to the limited total amount of wax added, wax deposition gradually ceases 4.5 h later. Pressure drop increases from 15 kPa to the final 27.4 kPa, an approximately 83% increase,while flow rate decreases from 1380 kg/h to the final 1340 kg/h,an approximately 2.9% decrease, predominately resulting from the reduction in flow area that is caused by wax deposition as well as the slight increase in fluid viscosity that is caused by the suspended and adsorbed wax crystals (Ma et al., 2017).

Fig. 4. System pressure drop, flow rate and hydrate volume fraction of case 2 (wax free, 50 bar, 1400 kg/h, 1 °C), case 4 (0.75 wt%, 50 bar, 1400 kg/h, 1 °C) and case 18(0.75 wt%,ambient pressure,1400 kg/h,1 °C)versus time.The pressure drop of Y-axis is in log-scale. Red dashed lines are added to guide the eye. The same is for Figs. 5-7.
During the wax deposition phase (I) of case 12, pressure drop increases from 15 kPa to 26 kPa, an approximately 73% increase,while flow rate decreases from 1380 kg/h to 1310 kg/h, an approximately 5.0%decrease.Obviously,the wax deposition rate of waxy w/o emulsion under ambient pressure is higher than that of the pressurized waxy w/o emulsion,since the dissolved natural gas in oil phase elevates the solubility of wax.The same phenomenon is also observed in 1.25 wt% wax content situations (see Fig. 7: the pressure drop curve of case 20 is above that of case 16 during wax deposition phase).After the onset of hydrate formation,the system pressure drop first steeply then gradually rises from 26 kPa to the final 46 kPa,while flow rate drops gradually from 1310 kg/h to the final 920 kg/h, an approximately 33% decrease of the initial value.Finally,a gradual plugging scenario occurs,where pressure drop is gradually tripled as flow rate gradually reduced by a third.Notably,for the consideration of avoiding pipeline plugging which is hard to handle and the running time of experimental devices (PVM probe and its auxiliary device),the flow experiment of case 12 is stopped at around the eighth hour.The tendency of the increase of pressure drop and the decrease of flow rate still exists before 50%reduction in flow rate.
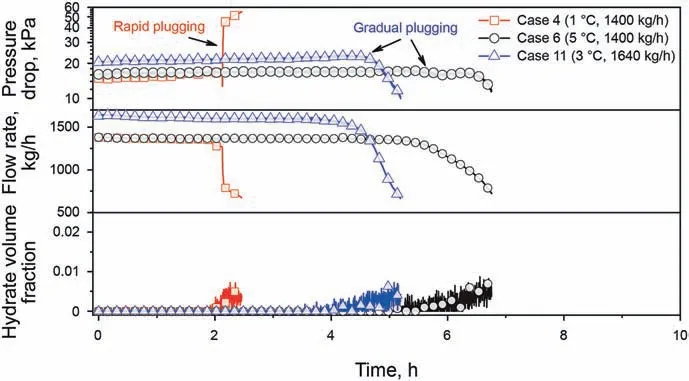
Fig.5. System pressure drop,flow rate and hydrate volume fraction of case 4(0.75 wt%, 50 bar, 1400 kg/h, 1 °C), case 6 (0.75 wt%, 50 bar, 1400 kg/h, 5 °C) and case 11(0.75 wt%, 50 bar,1640 kg/h, 3 °C) versus time.

Fig. 6. System pressure drop, flow rate and hydrate volume fraction of case 2 (wax free,50 bar,1400 kg/h,1 °C),case 12(1 wt% wax content,50 bar,1400 kg/h,1 °C)and case 19 (1 wt% wax content, ambient pressure,1400 kg/h,1 °C) versus time.
Moreover, taking Figs. 5 and 6 into comparison, the flow properties of case 6 and 12 are different when gradual plugging occurs,which can be attributed to the following two reasons:(i)significant wax deposition in case 12, resulting in a smaller flow diameter compared to case 6;(ii)higher fluid viscosity in case 12(final waxy hydrate slurry:33.2 mPa s).In circumstances like case 12 and case 16, the decrease in flow area and the increase in viscosity are the prevailing factors of determining pressure drop compared to flow rate. For distinguishing, gradual plugging scenarios with the flow properties like cases 6 and 11 are marked as type I,while those with flow properties like cases 12 and 16 are marked as type II.
Fig. 7 depicts the comparison of pressure drop, flow rate and hydrate volume fraction among the flow system with 1.25 wt%wax content under initial pressure of 50 bar (case 16), without wax under initial pressure of 50 bar (case 2) and with 1.25 wt% wax content under ambient pressure (case 20). The variation trends of flow properties of case 16 are similar to that of case 12, indicating that they are both gradual plugging type II scenario. Moreover, it requires more than 210 min for the occurrence of plugging in case 12 after hydrate formation, while it requires approximately 380 min in case 16.It is also discerned that there are fluctuations in pressure drop curve and flow rate curve of case 16 between the time point of 6 h and 8 h, which is presumably resulted from the sloughing and re-deposition of wax-hydrate coupling aggregates.The wax deposition layer is thicker (see Table 2) and more uniformly when the wax content is higher, so the compatibility between coupling aggregates and the pipe wall coated by wax is weaker, resulting in a smaller adhesive force (Brown et al., 2020).Deposited coupling aggregates are sloughed to the bulk phase,leading to higher fluid viscosity and decrement in flow rate. Then the aggregates re-deposited to the pipe wall. The circle of sloughing-redeposition-sloughing continues.
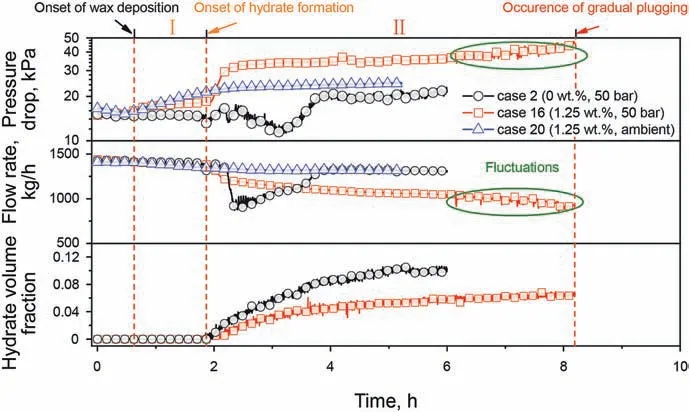
Fig.7. System pressure drop,flow rate and hydrate volume fraction of case 2(wax free,50 bar,1400 kg/h,1 °C),case 16(1 wt% wax content,50 bar,1400 kg/h,1 °C) and case 20 (1 wt% wax content, ambient pressure,1400 kg/h,1 °C) versus time. Green circles are added to guide the eye.
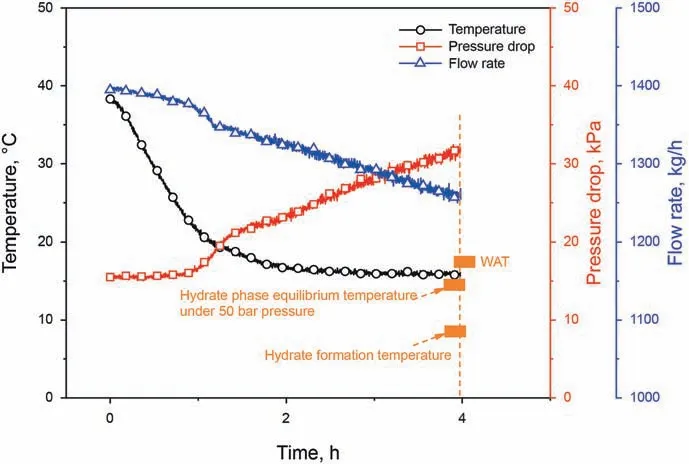
Fig. 8. System temperature, pressure and flow rate of case 21 (2.89 wt% wax content,50 bar,1400 kg/h,1 °C) versus time.
As shown in Fig.8,when wax content increases to 2.89 wt%,the system temperature can no longer be cooled to hydrate formation temperature or even the hydrate phase equilibrium temperature,due to the insulation effect of thick wax deposition layer and the limited power of coolant baths. Thus, no hydrate forms in case 21,and only wax deposition occurs,developing in to the non-plugging scenario.
It can be concluded that:(i)independent wax deposition(cases 18-21) and independent hydrate formation (cases 1-3) will not produce such high pressure drop compared to the cases where wax and hydrates coexist (cases 4-17), and will not develop into the plugging scenario; (ii) for coexisting systems (cases 4-17), even with the same dosage of AA,the stable slurry flow state still cannot be reached, indicating that the existence of wax crystals deteriorates the performance of AA. In cases 4-17, the state of wax deposition (i.e., the thickness and uniformity of wax deposition layer) that occurs before hydrate formation significantly alters the flow properties of the fluid after hydrate formation, indicating there must be synergistic effect between wax and hydrates.Table 3 tabulates the flow properties,deposition state(see subsection 3.2)and the required time for the occurrence of different plugging scenarios. As seen, different plugging scenarios in the flow loop possess different characteristics.For rapid plugging,flow properties change abruptly, and severe deposition of coupling aggregates occurs simultaneously,resulting in a short available time to response after hydrate formation.Gradual plugging scenario corresponds to more gradual changes in flow properties,weaker deposition and a longer response time. Transition plugging scenario is the intermediate state of the above two plugging scenarios.
3.2. Synergistic deposition characteristics of different plugging scenarios
Researchers have presented that adhesion to the pipe wall, wall growth,moving bed and stationary bed were possibly to occur after hydrate formation. In order to distinguish with wax deposition,hydrate wall deposition was defined as the process where hydrate particles or aggregates adhere to the pipe wall and form stationary bed.Based on the observation through high pressure visual window(see Fig. 2), synergistic deposition states of different plugging scenarios were analyzed and characterized. The histogram function of ImageJsoftwarewasusedtoanalyzetheimages,whichwerecaptured by the CCD camera that in-situ recorded the experimental process.Then the average intensity of the light that permeated through the visual window was obtained.Examples are shown in Fig.9.The value of light intensity is inversely proportional to the degree of wall deposition:the lower the value,the severer the wall deposition.
Fig.10 shows typical images captured by visual window during the experimental process of case 2(wax-free,50 bar),while Fig.11 shows the corresponding light intensity.As seen,the light intensity gradually increases during the hydrate formation and slurry flow process. 210 min after hydrate formation, the light intensity increases by approximately 22%. Before hydrate formation, w/o emulsion flows in the loop (Fig. 10a), while the amount of water that can participate in emulsification decreases due to the consumption of hydrate formation,resulting in more light permeation(Fig.10b~e). For case 2, the emulsification degree is the dominant factor that determines light intensity.The wall deposition in case 2(stable hydrate slurry flow scenario) is inconspicuous.
For rapid plugging scenario, the light intensity of case 4 after hydrate formation decreases abruptly, and a 52.4% reduction is observed 15 min after hydrate formation. Fig.12b~d clearly illustrate that there is severe wall deposition in case 4. For gradual plugging type I scenario,the light intensity first decreases and then increases, variation of which is within ±20%, indicating a pretty weak deposition level. As for case 12 (gradual plugging type II scenario),both Figs.11 and 13 show that wax deposition results in the decrease in the amount of light permeation through the visual window,and a 20.2%reduction in light intensity is observed.After hydrate formation, although there are still certain deposits that adhere to the visual window (see Fig. 13c~f), the light intensity gradually increases by approximately 47.2% (see Fig. 11, case 12).Approximately 120 min after hydrate formation,nearly all the bulk phase water has been consumed, i.e., bulk phase water has either been converted into hydrates or participate in the formation of wax-hydrate coupling aggregates, and the light intensity approaches a high plateau. The variation trend of light intensity of case 16 is similar to that of case 12.Since the wax content of case 16 is higher than that of case 12,the overall light intensity of case 16 is lower than that of case 12 due to the thicker wax deposition layer(see Fig.14).In conclusion,the deposition rate of gradual plugging is weak and continuous,which is significantly different from that of rapid plugging. It is also found that lower wax content provokes much severer wall deposition for the hydrate-wax synergistic system, while medium to low wax content systems possess much weaker wall deposition state (see Table 3).
Another two interesting phenomena are obtained based on the visual window observation and light intensity analysis.First,there is a sharp increase in light intensity once hydrate formation begins for all the cases (see Fig. 11, region I). Based on the microscopic observation via MMF apparatus (Aman et al., 2011), NMR (Haber et al., 2015) and PVM probe (Akhfash et al., 2017; Liu et al., 2019)etc., it is suggested that the surface properties of hydrate particles are different from that of water droplets. Although hydrate nucleation is a local event (Liu et al., 2019), large amount of water droplets will participate in hydrate formation or aggregation in a few minutes (typically 1-3 min) after the onset of hydrate nucleation, due to the collision between water droplets and hydrate particles. In other words, the local hydrate nucleation promptly develops into the massive hydrate growth in the flow loop. This conjecture can be corroborated by the abrupt increase in the overall fluid viscosity after hydrate formation(Webb et al.,2014;Qin et al.,2020;Liu et al.,2021).Second,the increment in light intensity after hydrate formation for wax-containing systems is higher than that of the wax-free system(see Fig.11, region II),indicating that thereare less free water droplets in the bulk phase of wax-containing systems due to the emergence of wax-hydrate coupling aggregates, i.e., the synergistic effect between wax and hydrates, which also can be supported by the fluid viscosity data (Liu et al., 2021).

Table 3 Summary of different plugging scenarios and their corresponding features.
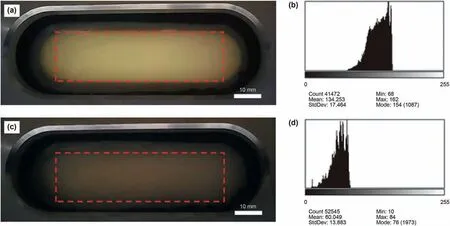
Fig.9. Light intensity of images obtained by Image J:(a)images of wax-free system captured after hydrate formation;(b)average light intensity of image(a)is 134.253;(c)images of 0.75 wt% wax content system captured after hydrate formation; (d) average light intensity of image (c) is 60.049.
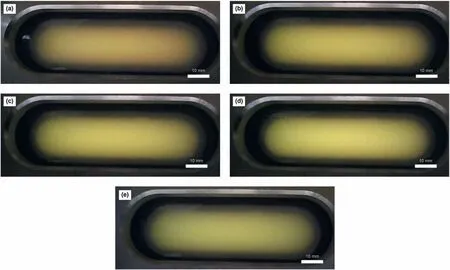
Fig.10. Results of visual window observation of case 2(wax-free,50 bar):(a)before hydrate formation;(b)30 min after hydrate formation;(c)90 min after hydrate formation;(d)150 min after hydrate formation; (e) 210 min after hydrate formation.
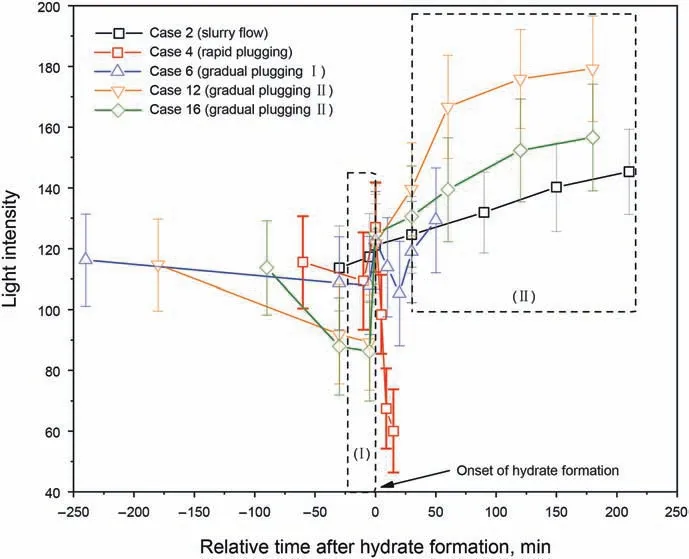
Fig. 11. Light intensity versus relative time after hydrate formation of case 2 (waxfree), case 4 (0.75 wt% wax), case 6 (0.75 wt% wax), case 12 (1 wt% wax) and case 16(1.25 wt% wax). Black dotted rectangles are added to guide the eye.
3.3. Physical model of pipeline plugging
As the energy output of the magnetic centrifugal pump on the flow loop is constant, flow rate firstly decreases when energy consumption of the pipe flow (i.e., pressure drop) rises due to the increment in fluid viscosity caused by hydrate formation or the decrement in flow area caused by deposition,so as to reach a new energy output-consumption balance. A pressure drop versus flow rate plot is helpful in analyzing the working points of a flow system.Fig.15 illustrates the working points of different plugging scenarios,where the initial state, the onset of wax deposition, the onset of hydrate formation and the final state of each scenario are plotted(3 points for wax-free systems, while 4 points for wax containing systems). For the experimental systems used in this work, since independent wax deposition (case 18-21) and independent hydrate formation (case 1-3) will not develop into the plugging scenario, an acceptable working area (dashed rectangle in Fig.15)can be obtained, which refers to the working condition with low plugging tendency. If a working point is away from the area, the plugging tendency of it rises. And the longer the distance, the higher the plugging risk. On the other hand, the plugging region corresponding to four plugging scenarios can be divided, which is useful to judge whether plugging will occur under a specific experimental condition,and what region it will fall into.Note that although Fig.15 of the current version is not available to predict the working condition of real pipeline flow,it can be extended based on the similarity criterion, after (i) developing a real time pressure drop model based on the coupling of viscosity model and deposition mechanisms and(ii)introducing dimensionless numbers(such as Reynolds number, Capillary number and Froude number). This will be the focus of our future work.

Fig.12. Results of visual window observation for case 4(0.75 wt%wax,50 bar):(a)before hydrate formation;(b)5 min after hydrate formation;(c)9 min after hydrate formation;(d) 15 min after hydrate formation.
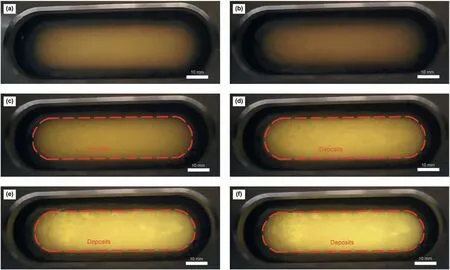
Fig.13. Results of visual window observation for case 12(1 wt%wax, 50 bar): (a)before wax precipitation; (b)180 min after wax precipitation,and before hydrate formation; (c)5 min after hydrate formation; (d) 30 min after hydrate formation; (e) 60 min after hydrate formation; (f) 120 min after hydrate formation. The visual window is coated by the deposition layer.
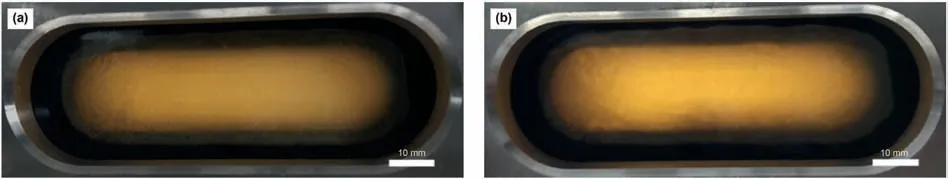
Fig.14. Results of visual window observation for case 16 (1.25 wt% wax, 50 bar): (a) 90 min after hydrate formation; (b) 180 min after hydrate formation.
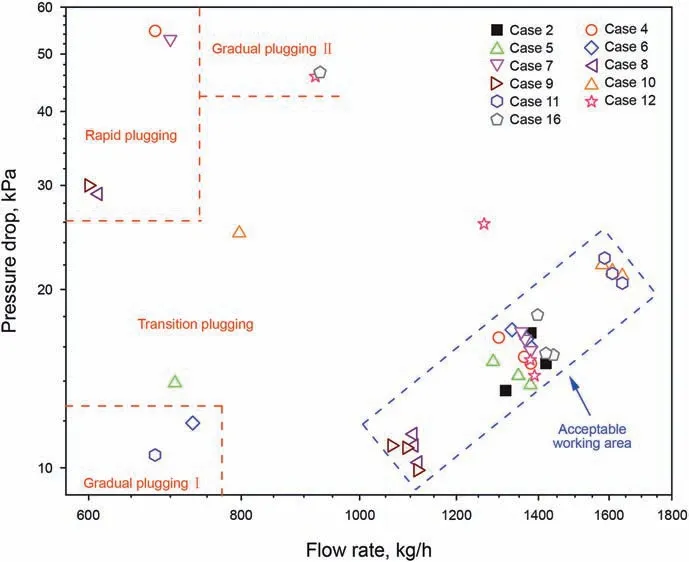
Fig.15. Pipeline working condition diagram of different plugging scenarios. Working points at the initial state, the onset of wax deposition, the onset of hydrate formation and the final state are plotted.Dashed lines are added to guide the eye.Both x-axis and y-axis are plotted in log-scale.
Combing Table 3 and Fig.15,it can be elucidated that:(i)When wax content is low,target temperature(cases 4-7)and initial flow rate (cases 8-11) dominate the final plugging scenario. (ii) When wax content increases, the final plugging scenario is no longer sensible to the system pressure (cases 12-14) and initial flow rate(cases 15-17). The occurrence of pipeline plugging with the coexistence of wax and hydrates is a complicated multi-physical coupling process. Based on the flow properties and wall deposition analysis of the experiments conducted with different wax content, target temperature, pressure and flow rate, the physical model of different plugging scenarios is shown as follows.
(i) Rapid plugging scenario. As shown in Fig. 16a, under the condition of low wax content, low flow rate and low target temperature (0.75 wt%,1120-1400 kg/h, ≤1°C), wax deposition layer cannot uniformly coat on the pipe wall. After hydrate formation, large amounts of coupling aggregates emerge in the bulk phase.Simultaneously,hydrates grow on the pipe wall due to the hydrophilicity of the pipe wall made of stainless steel. Note that the amount and the size of coupling aggregates increase as hydrates continue to grow.When the size of a coupling aggregate exceeds a critical size that the pipe flow can carry, this coupling aggregate will adhere to the pipe wall or the hydrates growing on the pipe wall.This critical size can be defined as the critical deposition size. When more aggregates reach the critical deposition size,catastrophic reduction in flow area occurs.On the other hand, the fluid viscosity increases with the increasing hydrate volume fraction.Thus,flow friction increases and flow rate decreases. Finally, lower flow rate results in lower carrying capacity of the pipe flow and larger coupling aggregates(the cohesion force between hydrates is larger than the shear stress),then more and larger aggregates deposit on the pipe wall,and consequently reinforcing a vicious circle of the decreasing transportability, causing severe local deposition of coupling aggregates and rapid plugging.
(ii) Gradual plugging type I scenario.Under the condition of low wax content, relatively higher flow rate and higher target temperature(0.75 wt%,1400-1640 kg/h,3-5°C),compared to the rapid plugging scenarios:the driving force of hydrate formation in the bulk phase and on the pipe wall reduces;the critical deposition size of aggregates is larger;the size of coupling aggregates is smaller due to higher flow shear stress. Thus, the vicious circle and severe local deposition is relieved in this circumstance.However,as hydrates continue to grow,the fluid viscosity gradually increases,resulting in a lower flow rate and consequently lower critical size of aggregates. Thus, part of large size aggregates gradually deposits on the pipe wall. The variation of pressure drop is caused by the conjunction of gradual increase in viscosity and decrease in flow area.
(iii) Gradual plugging type II scenario.As shown in Fig.16a,under the condition of medium to low wax content (1-1.25 wt%),wax deposition layer is sufficient to uniformly coat the pipe wall. Hydrate wall growth is hindered due to the weak hydrophilicity of wax deposition layer (Brown et al., 2020).Although the bedding of wax-hydrate coupling aggregates still occurs, the adhesive force between the coupling aggregates and the wax-coated pipe wall is much smaller than that between the coupling aggregates and the steel pipe wall,resulting in fairly small amount of coupling aggregates that can form stationary bed.The abovementioned vicious cycle is further relieved compared to type I scenario, and most coupling aggregates suspend in the bulk phase.However,as the duration of hydrate formation prolongs, although plugging will not occur in a short time(90 min in this work),the fluid viscosity gradually increases to a high level(more than 4 folds of the initial w/o emulsion), resulting in the increasing pressure drop with a decreasing flow rate.Finally,gradual plugging occurs after a relatively longer duration after hydrate formation (120-240 min in this work).
Fig. 16b illustrates the physical process of the occurrence of synergistic deposition, and key parameters and their determining factors of each phase, which are significant to the development of the mathematical model, are listed. Within a certain range of wax content,the synergistic effect between wax and hydrates impact on the hydrate nucleation and growth process (Liu et al., 2019), promoting the emergence of wax-hydrate coupling aggregates (Liu et al., 2018), accelerating the deposition of each other, influencing the sloughing of deposit,and finally resulting in pipeline blockage.As seen, the synergistic deposition of wax and hydrates is an integral physical process. Under the circumstance where wax and hydrates coexist, a stricter method of monitoring the composition of products, a better management of fluid temperature and flow rate, as well as a comprehensive strategy for the inhibition of this synergistic effect (e.g., the combination of AA and pour point depressant), should be implemented, so as to ensure the safety of multiphase transmission lines.

Fig.16. (a)Conceptual diagram of rapid plugging and gradual plugging scenario.(b)Physical process of the occurrence of synergistic deposition.Key parameters of each phase are marked in blue. The impact of a parameter on the other ones is shown by red dashed arrows.
4. Conclusions
In this paper,flow and deposition experiments were conducted in a high pressure visual flow loop,where flow systems with a wide range of wax content (0-2.89 wt%) were used, so as to better elucidate the characteristics of synergistic deposition of wax and hydrates from the aspect of flow properties and wall deposition state. Flow properties were characterized by the flow rate and pressure drop data, while the wall deposition state was characterized by the intensity of light permeation through the visual window. For wax-free flow systems, stable hydrate slurry flow state was reached due to the addition of AA. Pressure drop increases by 46% while flow rate decreases slightly. The wall deposition state was deemed to be weak.For flow systems with medium to low wax content (0.75-1.25 wt%), there was a synergistic effect between wax and hydrates,resulting in the increase in fluid viscosity and the occurrence of synergistic deposition. Four types of plugging scenario,namely rapid type,transition type,gradual I type and gradual II type, were discerned. The abrupt variation of flow properties accompanied by severe wall deposition occurred in the rapid plugging scenario, while the gradual variation of flow properties accompanied by a weak wall deposition occurred in the gradual plugging scenario. Transition plugging scenario was the intermediate state of the above two plugging scenarios. A vicious circle of the decreasing flow ability resulted from the emergence of waxhydrate aggregates was found to be the main plugging mechanism.For flow systems with higher wax content,hydrates could not form due to the insulation effect of wax deposition layer.The flow system gradually reached equilibrium state of wax deposition.Under certain circumstance where wax and hydrates coexist, synergistic effect between them resulted in the synergistic deposition,provoking higher plugging tendency, and a comprehensive inhibition strategy should be further investigated and applied.
Author information
The authors declare no competing financial interest.
Acknowledgements
This work was supported by the National Natural Science Foundation of China (Grant No. 52004039 & 51804046 &51974037), Open Project of Jiangsu Key Laboratory of Oil-gas Storage and Transportation Technology(Grant No.CDYQCY202102)and China Postdoctoral Science Foundation (Grant No.2021M693908),all of which are gratefully acknowledged.
Appendix A. Supplementary data
Supplementary data to this article can be found online at https://doi.org/10.1016/j.petsci.2022.04.004.
杂志排行

Petroleum Science的其它文章
- A fast space-time-domain Gaussian beam migration approach using the dominant frequency approximation
- Predicting gas-bearing distribution using DNN based on multicomponent seismic data: Quality evaluation using structural and fracture factors
- Reflection-based traveltime and waveform inversion with secondorder optimization
- Determination of dynamic capillary effect on two-phase flow in porous media: A perspective from various methods
- Settling behavior of spherical particles in eccentric annulus filled with viscous inelastic fluid
- Laboratory investigation on hydraulic fracture propagation in sandstone-mudstone-shale layers