Predicting gas-bearing distribution using DNN based on multicomponent seismic data: Quality evaluation using structural and fracture factors
2022-09-23KiZhngNinTinLinJiuQingYngZhiWeiJinGuiHuLiRenWeiDing
Ki Zhng , Nin-Tin Lin ,b,*, Jiu-Qing Yng , Zhi-Wei Jin , Gui-Hu Li ,Ren-Wei Ding
a College of Earth Sciences and Engineering, Shandong University of Science and Technology, Qingdao, Shandong, 266590, China
b Laboratory for Marine Mineral Resources, Qingdao National Laboratory for Marine Science and Technology, Qingdao, Shandong, 266237, China
Keywords:Multi-component seismic exploration Tight sandstone gas reservoir prediction Deep neural network (DNN)Reservoir quality evaluation Fracture prediction Structural characteristics
ABSTRACT The tight-fractured gas reservoir of the Upper Triassic Xujiahe Formation in the Western Sichuan Depression has low porosity and permeability. This study presents a DNN-based method for identifying gas-bearing strata in tight sandstone.First, multi-component composite seismic attributes are obtained.The strong nonlinear relationships between multi-component composite attributes and gas-bearing reservoirs can be constrained through a DNN. Therefore, we identify and predict the gas-bearing strata using a DNN. Then, sample data are fed into the DNN for training and testing. After optimized network parameters are determined by the performance curves and empirical formulas, the best deep learning gas-bearing prediction model is determined. The composite seismic attributes can then be fed into the model to extrapolate the hydrocarbon-bearing characteristics from known drilling areas to the entire region for predicting the gas reservoir distribution. Finally, we assess the proposed method in terms of the structure and fracture characteristics and predict favorable exploration areas for identifying gas reservoirs.
1. Introduction
Tight sandstone gas reservoirs are typically low porosity, low permeability,and non-homogeneity reservoirs.This leads to minor differences in seismic response between the gas reservoir and surrounding rocks, making the identification of gas-bearing strata difficult. In addition, there is a complex nonlinear relationship between tight sandstone gas reservoirs and seismic responses.Therefore,gas-bearing identification using seismic data remains to be challenging. Over recent years, many studies have successfully attempted to identify tight sandstone gas reservoirs. Examples of technical advancements include seismic attribute analysis (Wang et al., 2015), AVO (Hart, 2006; Liu and Wang, 2018; Zong et al.,2021), seismic impedance inversion (Zhang et al., 2022c), seismic fracture prediction (Wang et al., 2020), petrophysical analysis (Yin et al., 2019), forward simulation (Yue et al., 2019; Ding et al.,2021), and multi-component seismic exploration (Li, 1997; Wei et al., 2008; Huang et al., 2021a). However, identifying and predicting unconventional reservoirs in complex areas are still onerous, especially for tight sandstone gas reservoirs.
Machine learning algorithms provide a novel approach to this problem owing to their nonlinear processing capabilities. In the 1980s, shallow machine learning algorithms, such as clustering analysis,artificial neural networks,self-organizing neural networks(SOM), and support vector machines were widely used in seismic reservoir prediction, such as for seismic phase classification,reservoir parameter inversion, fracture prediction, and hydrocarbon detection(Hampson et al.,2001;Niknam et al.,2016;Liu et al.,2020;Dixit and Mandal,2020;Liao et al.,2022).However,owing to the simple network structure of shallow machine learning methods,its ability to solve complex nonlinear problems is limited,and their generalization ability is somewhat constrained.Different machine learning models have been applied to geophysics over time, from shallow to deep learning (DL) models. Currently, DL methods are rapidly developing, which has drawn substantial exploratory research attention from the geophysical field,owing to their automatic feature extraction capability,ability to handle highdimensional data, and above all, the ability to match human cognitive functioning in terms of its approach to solve a problem,that is,by learning with multiple levels of abstractions.DL methods,represented by DNN and CNN,have also made significant progress in seismic processing and interpretation, including initial picking(Zhang et al.,2020),estimation of seismic local slopes(Huang et al.,2021b), velocity intelligence analysis (Lin et al., 2013), seismic phase analysis (Xie et al.,2017; Qian et al., 2018), horizon tracking and interpretation(Yang and Sun,2019;Zhang et al.,2022a),multicomponent information fusion (Zhang et al., 2019), rock mound identification (Shi et al., 2019), and reservoir parameter inversion(Chen et al., 2020; Zhang et al., 2021). However, research on the identification of DL-based gas reservoirs is still at a preliminary stage (Lin et al., 2018; Gao et al., 2020; Yang et al., 2021). For instance, Lin et al. (2018) proposed a reservoir prediction method using a CNN under small-sample conditions,while Gao et al.(2020)presented a CNN and transfer learning-based gas reservoir identification method. Such techniques are usually based on PP-wave seismic data. Currently, with the widespread use of multicomponent seismic surveys, the implementation of DL-based multi-component seismic data for gas reservoir prediction must be further studied.Therefore,this study performs exploratory work by extracting the attributes sensitive to gas reservoirs and relating sensitive attributes and the gas-bearing properties in DL to identify the gas reservoirs.
The deep tight sandstone gas reservoirs of the Upper Triassic Xujiahe Formation in the Western Sichuan Depression(WSD)have a complex seismic response of gas-water relationships (Gan and Gao, 2005; Ye, 2007). Therefore, conventional seismic exploration techniques face difficulties in reservoir prediction and gas-bearing strata identification. As part of the solution, multi-component seismic exploration is a necessary complementary technique owing to its ability to provide additional reservoir information. In addition, compared with conventional single PP-wave, these data are abundant in kinematic (velocity, travel time, etc.) and dynamical (amplitude, frequency, phase, absorption, attenuation, anisotropy, etc.) information. Therefore, a multi-component seismic survey was conducted to identify gas-bearing strata in tight sandstones.
In this study, with the assistance of DNN, the information of known gas-bearing well sections is extrapolated to the entire region to predict gas reservoirs. Because the prediction result was obtained from a mathematical perspective, whether the gas reservoir prediction results actually match the actual situation from a geological perspective needs to be verified to assess the effectiveness of the proposed method. The innovations are as follows.
(1) Multi-component seismic data are abundant in kinematic and dynamical information. We acquire three composite attributes,which can reduce the multi-solution of single PPwave prediction and improve the prediction accuracy.
(2) Although DNN is a general tool,for DNN gas reservoir identification and prediction in different regions, we need to adopt different implementation strategies in the selection of input datasets, construction of sample sets (label), determination of network model architecture, super-parameter preference, and method evaluation. The scheme designed and implementation strategy adopted of gas reservoir identification in the present study can provide useful guidance and reference for other regions.
2. Geological setting
2.1. Tectonics and structure
The WSD,a secondary depression in the Sichuan Basin(Li et al.,2019), is located on the eastern side of the Longmen Mountain thrust belt and the western side of the Central Sichuan Uplift(Fig.1a). Since the Late Triassic, the WSD has undergone multiple tectonic movements, such as the Indosinian, Yanshan, and Himalayan movements, exhibiting a tectonic pattern of “three uplifts,two depressions” (Fig.1b). The geological and tectonic profiles of the WSD over the cross-sectional AB line denoted in Fig. 1b are shown in Fig.1c.The Fenggu Structural Belt is an anticline trap.The present surface features a nose structure near the NEE part of the structure.The location of the study area is shown in the blue box in Fig.1b.
2.2. Stratigraphy characteristics
Fig. 2a shows the stratigraphic characteristics of the Xujiahe Formation (T3x1-T3x5represents the Mbr 1- Mbr 5 of the Xujiahe Formation). The regional natural gas are mainly distributed in the sandstones of the T3x2and T3x4, whereas T3x3and T3x5are dominated by large sets of mud-shales as the main cover over hydrocarbon source rocks (Li et al., 2011, 2019; Zhang et al., 2016). The buried depth of T3x4is generally 3000-4000 m, and the sedimentary thickness is 535-610 m. T3x4is mainly a tight sandstone reservoir,with 10 sets of sand bodies from top to bottom,numbered T3x41to T3x410. The main target layer is T3x46.
2.3. Reservoir properties
Fig.2b shows several typical casting thin sections,revealing the different pore types,including primary pores,secondary pores,and micropores in T3x4.Sample testing(Li et al.,2019)revealed that the porosity of the T3x4gas reservoir ranged from 1.0% to 12.1%(average = 5.86%), which represents a low-porosity reservoir. The permeability varies from 0.001 to 287.82 mD(average=1.41 mD),and the tightness of the reservoir is apparent(Li et al.,2019).From a microscopic perspective,it is a typical tight sandstone reservoir(Li et al., 2019).
3. Dataset
The three-dimensional multi-component seismic data acquisition was conducted for the Fenggu Structural Belt (blue box in Fig. 1b), aiming to compensate for the insufficiency of single PPwave exploration and to predict deep tight gas reservoir. The seismic survey area is approximately 550 km2, and the main acquisition parameters are as follows:the trace range of the inline is 87-1234,a total of 1148 traces;the trace range of the crossline is 80-849, a total of 770 traces; the trace spacing is 25 m; the sampling interval is 2 ms.A total of 12 drilled wells are present within the study area, with CF131, FG3, GM4, and GM31 not reaching the T3x4. The acquisition work area is shown in Fig. 3.
The seismic data used in the present study consisted of the PPwave and PS-wave post-stack seismic data. In general, for the frequency spectrum, the main frequency and bandwidth of the converted PS-wave are lower than those of the PP-wave(Deffenbaugh et al.,2000).Fig.4a shows the PP-wave seismic profile for overwell CF563 with a main frequency of 25 Hz and a frequency bandwidth of 10-40 Hz; Fig. 4b shows the converted PS-wave seismic profile for overwell CF563 with a main frequency of 15 Hz and a frequency bandwidth of 5-25 Hz.T3x4is the main gas-bearing strata,and the top,bottom, and target horizons are shown in Fig. 4.
4. Methodology and workflow
4.1. Methodology
4.1.1. Multi-component seismic attribute analysis
The different propagation mechanisms of PP-wave and PS-wave cause differences in frequency, phase, amplitude, energy, velocity,and other attributes between the two(Yang et al.,2013).Hence,we extracted seismic attributes and identified gas reservoirs by analyzing the differences. The joint inversion of multi-component data contributes to decreasing the multi-solutions of singlecomponent data prediction and improves the reservoir prediction accuracy. Several types of seismic attributes were described as follows.
Amplitude attributes: In the process of seismic attribute analysis, the amplitude attribute is commonly used and has a distinct parameter meaning. It is sensitive to the response of geological anomalies and can highlight larger or smaller amplitude anomalies,with widespread applications in lithological identification, pore prediction, and fluid detection. These attributes mainly include root-mean-square (RMS) amplitude, total absolute value amplitude, and average peak amplitude, and so on.
Spectrum statistics attributes: This attribute describes the variation characteristics of the seismic signal frequency spectrum,which is a common class of attributes derived by the spectral analysis of seismic data,mainly including the effective bandwidth,arc length,and main frequency.
Complex seismic trace attributes:This type of attribute is also called an instantaneous attribute, which mainly includes instantaneous amplitude, instantaneous frequency, and instantaneous phase.It is a“triple instantaneous”attribute obtained by the Hilbert transform of seismic data, that is, through complex seismic variations, to obtain a virtual seismic record.
Coherence attributes: This type of attribute mainly uses the principle of waveform similarity to seek similarities while reserving differences for seismic data to suppress continuity and highlight discontinuity. Areas with high coherence values indicate that the strata have good continuity,while areas with low coherence values show poor stratigraphic continuity and are usually closely related to faults,fractures,and special lithologic bodies.As a result,we can analyze horizontal sections of coherent bodies to reveal geological phenomena such as faults, fractures, unconformities, and rock boundaries and to provide evidence for predicting and evaluating gas reservoirs.
Herein, we extracted the typical multi-component seismic attributes of T3x46(Fig. 5), which provide the basis for subsequent research.
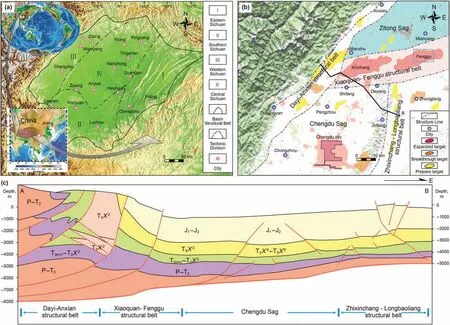
Fig.1. Geological overview map(Liu et al.,2017)showing:(a)the location and geological structure map of the Sichuan Basin;(b)the structural map of the WSD with the AB crosssectional line; and (c) the geological and tectonic profile over the AB line in the WSD.
4.1.2. Multi-component composite seismic attributes
Multi-component seismic data can be used to derive multicomponent composite seismic attributes such as difference class,ratio class, superposition class, and product class through mathematical operations. Several typical attributes shown in Fig. 5 indicate that they have different responses to gas reservoirs. From previous studies,after composite attribute experiment calculations(Fu et al., 2018; Zhang et al., 2019, 2022b), three new composite attributes that can highlight gas anomalies were constructed.These are briefly described below.
First type. Petrophysical analysis shows that PP-wave reflects rock skeleton and pore fluid characteristics, while PS-wave basically reflects rock skeleton information and is little affected by the pore fluid.The amplitude of the PP-wave passing over the gas layer is heavily absorption attenuated, while the PS-wave is almost constant.RMS amplitude,as one of the common seismic attributes for gas reservoir identification,is sensitive to geological anomalies and lateral changes of amplitude caused by gas bearing.Therefore,the first type composite attribute can qualitatively predict the gas bearing property of reservoirs.The calculation formula is shown in Eq. (1).
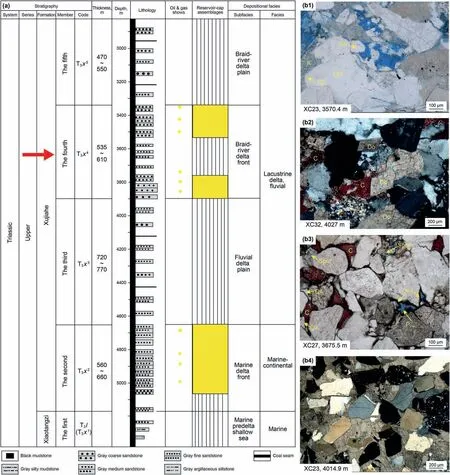
Fig. 2. Stratigraphic characteristics and casting thin sections showing: (a) stratigraphic characteristics (modified from Li et al., 2019); and (b) images of four casting thin sections that show different pore types (modified from Li et al., 2019). Note: T3x1-T3x5represents the Mbr 1-Mbr 5 of the Xujiahe Fm.
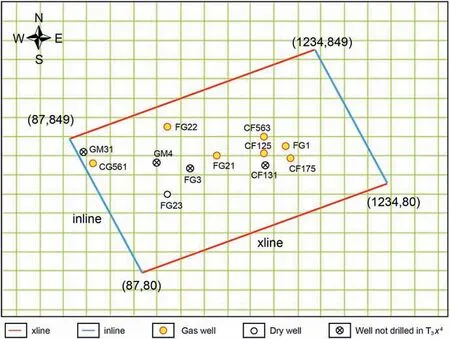
Fig. 3. Acquisition work area and drilling distribution. The seismic survey area is located in the blue box of Fig.1b.
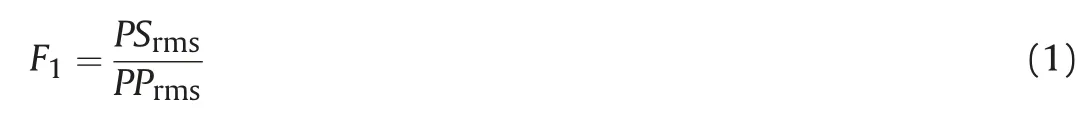
where PPrmsand PSrmsare the RMS amplitudes of the PP-and PSwaves, respectively.
Fig.6 shows the first type composite attribute in T3x46.Compared with the RMS amplitude of a single component (Fig. 5c), the amplitude of the known gas drilling area is visibly enhanced after the composite calculation according to Eq. (1).Qualitative analysis shows that the high-value areas are coincident with reservoirs with better gas content, and the low-value area corresponds to a reservoir with poor gas content.
Second type.In general,sandstone strata are characterized by a strong amplitude and low frequency,whereas mud-shale strata are just on the opposite. It is important to delineate the sand body distribution as an indicator of the gas. Petrophysical analysis and seismic wave attenuation research mechanism show that the absorption attenuation of PP-wave is greater than that of PS-wave for gas reservoirs. Under the same reservoir conditions, PP-wave is more sensitive to gas reservoir, and PS-wave is only sensitive to rock skeleton and shale content(Yang et al.,2013).The gas-bearing characteristics can be amplified by calculating the second type of composite attributes. The calculation formula is shown in Eq. (2).

where PPinsampand PSinsampare the instantaneous amplitudes of the PP-and PS-waves,respectively;and PPinsfreqand PSinsfreqare the instantaneous frequencies of the PP- and PS-waves,respectively.
Through the composite calculation in Eq. (2), the second type composite attribute is obtained,as shown in Fig.7.As a composite attribute that amplifies the contrast with the single-component attributes (instantaneous frequency in Fig. 5b, instantaneous amplitude in Fig.5d),it can be observed that the background value is significantly suppressed,and the depicted boundary information is clear. The qualitative analysis suggests that the low-value areas represent siltstone and mudstone. The high-value areas represent favorable reservoir development areas.
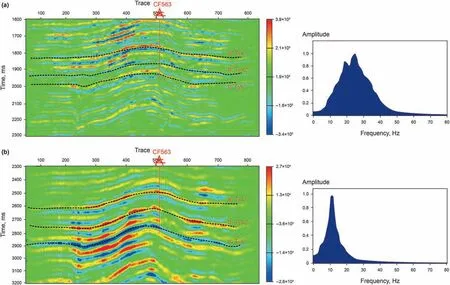
Fig. 4. Seismic profile of drilled overwell CF563 and frequency spectrum: (a) the PP-wave seismic profile and amplitude spectrum; (b)the PS-wave seismic profile and amplitude spectrum. The dotted lines a and c represent the top and bottom of the T3x4, the dotted line b represents the target.
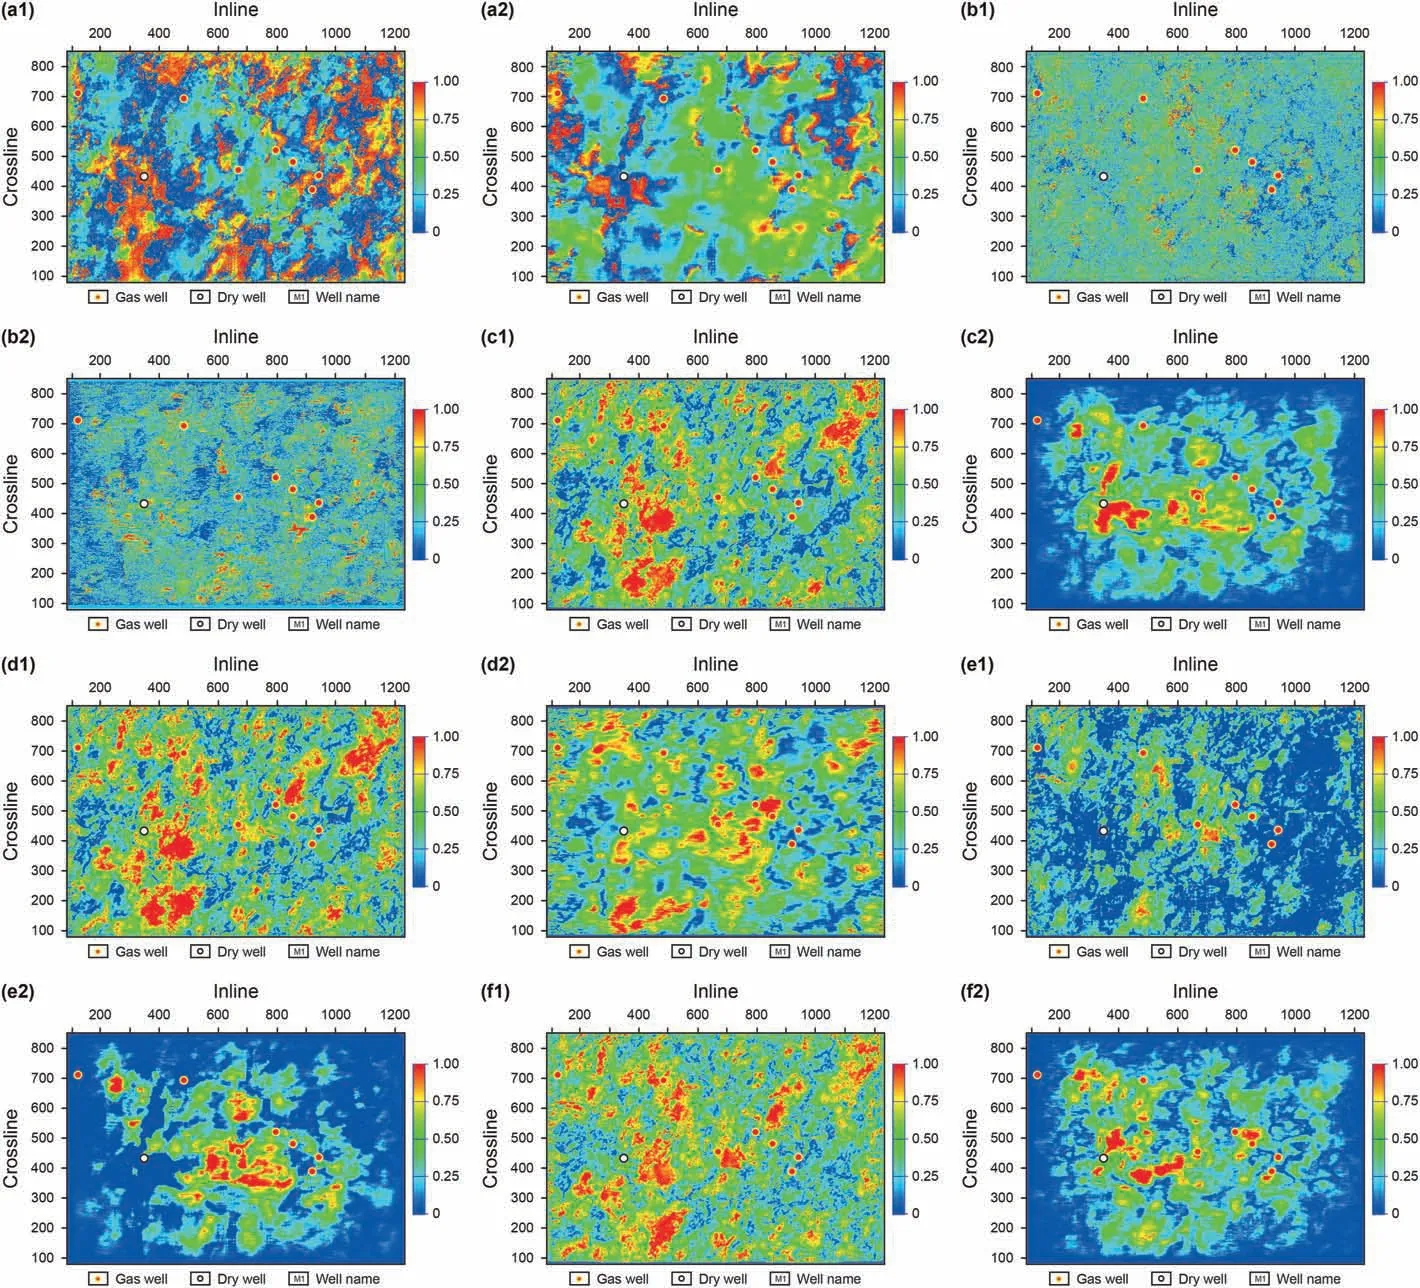
Fig.5. Typical seismic attributes of the T3x46:(a1),(a2)instantaneous phase;(b1),(b2)instantaneous frequency;(c1),(c2)RMS amplitude;(d1),(d2)instantaneous amplitude;(e1),(e2) average peak amplitude; (f1), (f2) arc length. Panels (a1)-(f1) show PP-waves, and (a2)-(f2) show PS-waves.
Third type. Ye (2007) concluded that the “single weak” and“double weak” dark spot types are unique gas reservoir identification patterns in the Fenggu area of the WSD. The arc length attribute is sensitive to the changes of frequency and amplitude caused by gas-bearing property. The average peak amplitude is a common attribute for predicting gas potential. Using Eq. (3), the dark spot characteristics can be effectively enlarged:
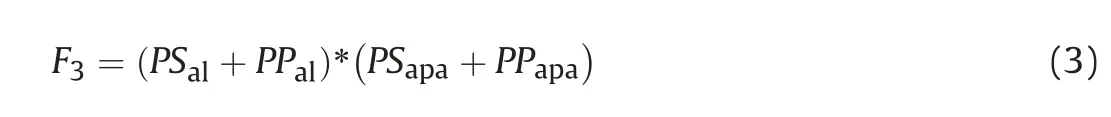
where PPaland PSalare the arc length attributes of the PP-and PSwaves, respectively; and PPapaand PSapaare the average peak amplitude attributes of the PP- and PS-waves,respectively.
Compared with the above two single-component attributes(Fig. 5e and f), the gas drilling area characteristics of third multicomponent composite attribute (Fig. 8) are also significantly enhanced,and the depicted reservoir boundaries are clearer owing to the known drilling information.
The above analysis shows that the composite attribute constructions take into account the differences and similarities of seismic responses between the PP-wave and PS-wave, the geological significance of each attribute and the petrophysical characteristics. Therefore, these three composite attributes have a certain correlation with gas-bearing properties which are indicative of the distribution of gas reservoirs. Accordingly, we have selected these composite attributes for training.
4.1.3. Deep neural network (DNN)
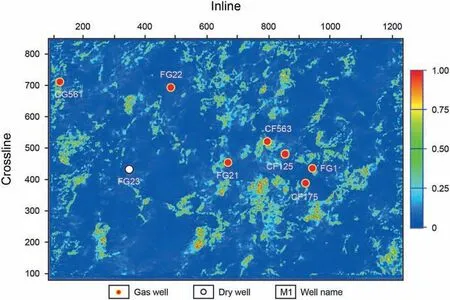
Fig. 6. First type composite attribute.
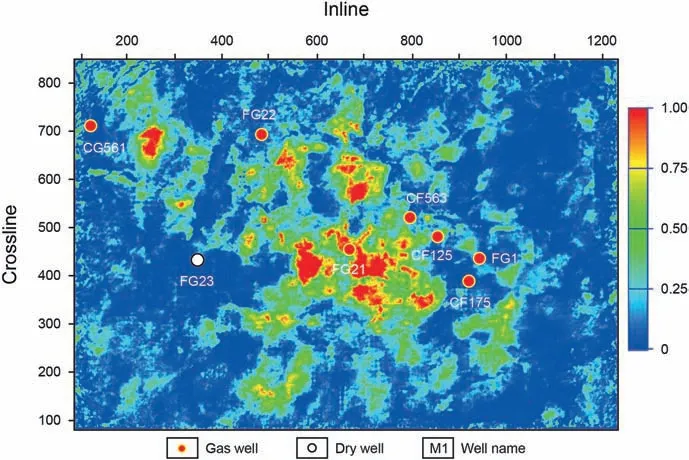
Fig. 8. Third type composite attribute.
DNNs are multilayer neural networks developed from a singlelayer back-propagation (BP) neural network. Compared to shallow neural networks, as the layers of a DNN are deeper, the connections between neurons are more extensive. This enables more complex hidden features to be learned autonomously,resulting in better solutions to nonlinear problems in various domains.
The DNN network mainly includes input, hidden and output layer, wherein there are three or more hidden layers, as shown in
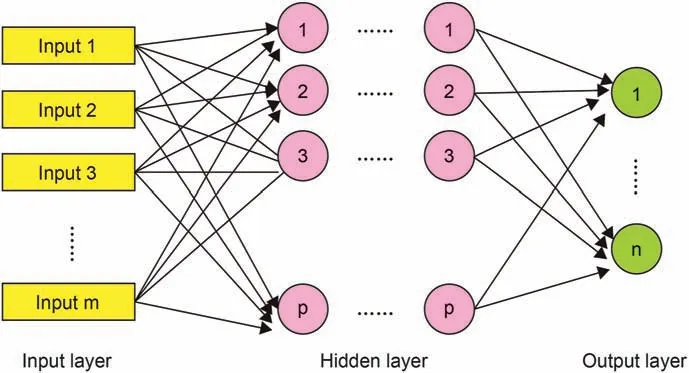
Fig. 9. Deep neural network (DNN) model architecture.
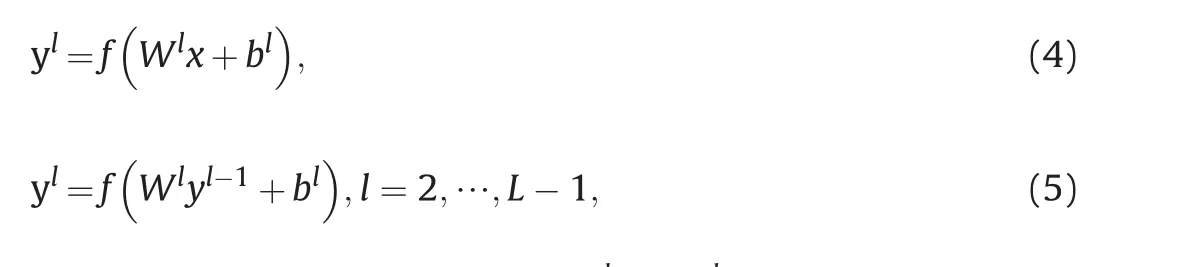
where x is the input eigenvector, Wland blare the weight coefficient matrix and bias vector of layer l,respectively,f is the activation function, ylis the output of layer l, and l is the total number of layers.
For gas reservoir prediction by supervised learning-DNN, the sample is the most challenging issue. Compared to seismic data,there is a lack of labeling of gas reservoir features, usually due to limitations in the number of wells drilled and insufficient deep logging markers. In other words, using the information of known gas-bearing intervals to extract more labels to delineate the characteristics of gas reservoirs is one of the critical problems. Sang et al. (2021) develop a new method for machine learning reservoir prediction based on virtual sample generation, which generates virtual samples in a high-dimensional hypersphere space that better match the original data characteristics.Gao et al.(2020)and Song et al. (2022) extract a large number of subgathers from borehole-side seismic gathers by using a sliding window way. The gas/nongas labels are determined by the gas-bearing curves at the central locations of the subgathers. This method increases the sample data near the well by correlation coefficient calculation using a sliding window way, and has strong interpretability.
In the present study, the local seismic waveform data of the known gas wells are extracted as the standard seismic trace.The gasbearing probabilistic results were characterized by calculating the similarity between the standard seismic trace and the seismic data of the surrounding areas of the well(Lin et al.,2018;Gao et al.,2020).
The basic idea of the DNN-based gas reservoir prediction model is the establishment of the relationship between multi-component data and gas reservoir characteristics. The mathematical model is shown in Eq. (6):

where DNNs is the constructed network architecture,X is the input multi-component seismic attribute data, Y is the output gas reservoir probability distribution prediction result, and m is the collective model parameters, including the number of hidden layers,node number, step size, learning rate, weight, and bias of the network.
At this point,seismic attribute data at known wellbores and gas reservoir distribution probability results (sample data) are input into Eq. (6) for training the network. In this process, network optimization is performed with a minimum root mean square error,as shown in Eq. (7):
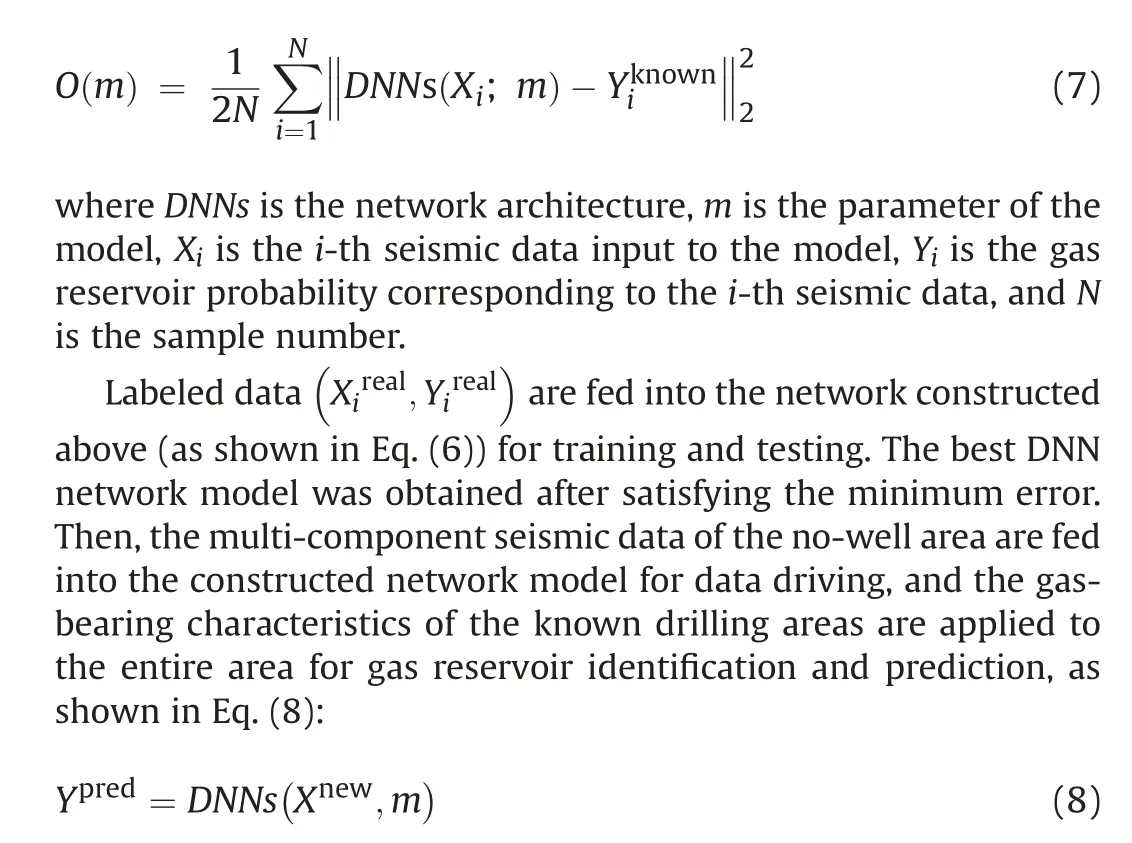
where, DNNs are the network models obtained by training and texting, Xneware the seismic data of the no-well area, and Ypredis the gas-bearing distribution probability corresponding to the output seismic data of the no-well area.
4.2. Workflow
In the previous study (Part 4.1.2), we discussed the geological significance of composite attributes. We considered that there is a certain nonlinear relationship between composite attributes and gas-bearing properties.Therefore,with the assistance of a DNN and driven by multi-component seismic data, we could push the limited gas-bearing information of the known drilling area to the entire area to predict gas reservoir distribution.To further verify the prediction results, we comprehensively evaluated the results in terms of the structural evolution and fracture characteristics. The flowchart is shown in Fig.10.
In the present study, the gas-bearing probabilistic results were characterized by calculating the similarity (Lin et al., 2018; Gao et al., 2020; Song et al., 2022). Among them, the gas-bearing probability at the dry well is 0, the gas-bearing probability at the drilling with the highest gas content is 1, and the gas-bearing probability at other gas-bearing drilling is between 0 and 1. The gas bearing probability around the drilling is obtained through correlation calculation,and the specific process is as follows.Firstly,a large number of subgathers are extracted from borehole-side seismic gathers, and the correlation coefficients between standard seismic traces and subgathers are calculated by sliding time window.Then,the gas-bearing probability(correlation coefficient)at the center of the subgathers is used as a label. The similarity calculation parameters are set as follows: the length of the sliding time window is 16 sampling points,the length of the sub trace set is 24 sampling points,and the sliding step size is 1.About 30 sample points were extracted from around each well, and a total of 230 data points were extracted. The training and test datasets were divided in a ratio of 7:3.The statistical characteristics of the sample data set are shown in Table 1. Fig.11 shows the statistical characteristics of the sample set.
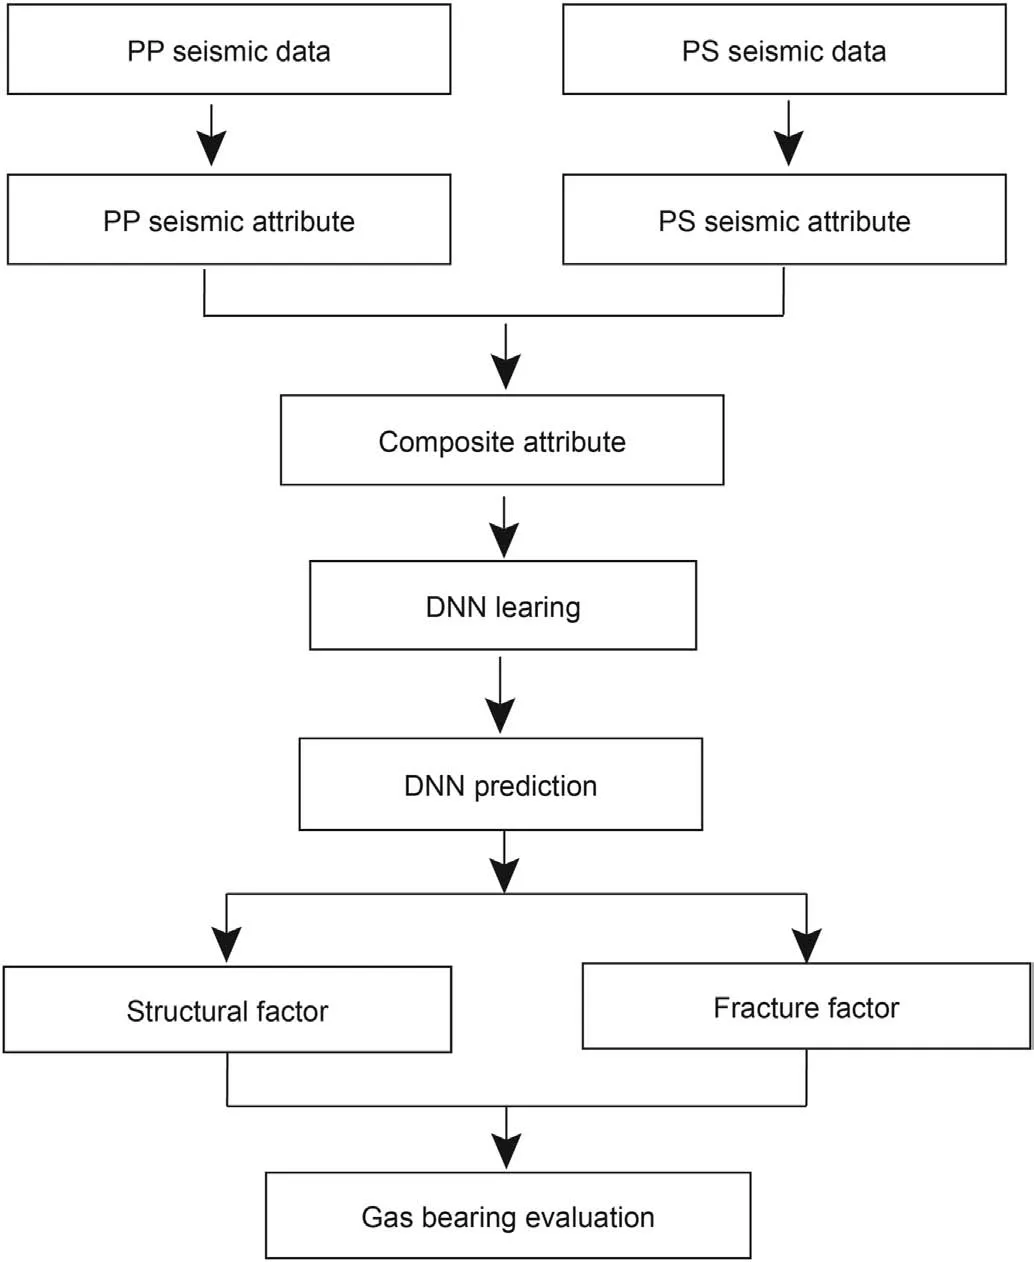
Fig.10. Gas reservoir prediction scheme by DNN.
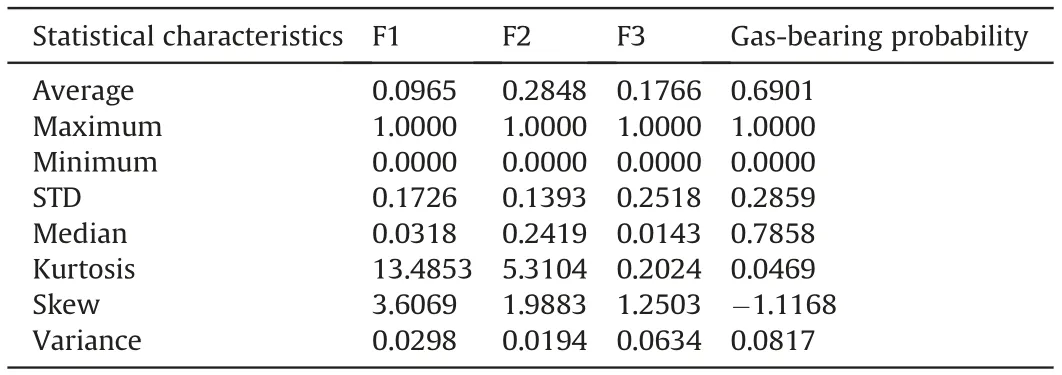
Table 1 Statistical characteristics of input data.
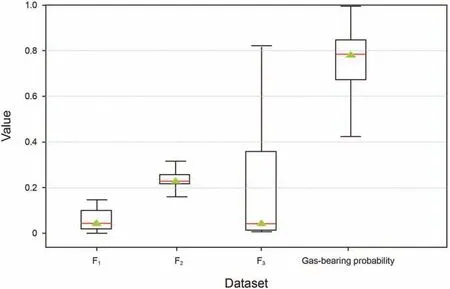
Fig.11. Box plots for the original dataset.
5. Results
In this section,the gas reservoir prediction scheme described in Fig.10 is applied for the gas reservoir prediction of the target area in the WSD. From the perspective of mathematics, we obtained the best prediction of gas reservoir distribution.
5.1. Acquisition of the best DNN network model
Super parameter optimization is used to optimize the key parameters, that is, network layers and hidden layer neurons, to obtain the best network model. Compared with conventional neural network models,DNN models can have more hidden layers,which can vary for different problems.The number of hidden layers and neurons determines the complexity of the model;moreover,an increase in the number of hidden layers and nodes can improve the prediction accuracy to a certain extent.However,too many hidden layers and nodes increase the network training time,and may cause overfitting. Therefore, the optimal model parameters were determined. The performance of the model was evaluated by the root mean square error, which is defined as shown in Eq. (9):where yrealis the true value,ypredictedis the predicted value,and n is the total number of sample data.
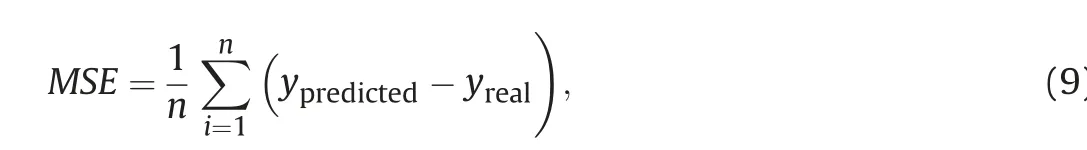
Fig.12 shows the performance curves of different hidden layers and different training times. Fig. 12a shows that the root mean square error decreases continuously as the number of hidden layers increases. The error tends to stabilize when the number of hidden layers is greater than seven. Meanwhile, Fig. 12b shows that the root mean square error under the same number of hidden layers decreases as the training time increases. The error stabilized at more than 2000 training epochs. According to the actual demand for gas reservoir prediction,we designed three input layer neurons and one output layer neuron. Using the empirical formula, we acquired node numbers in different hidden layers and used the ReLu activation function, with a learning rate of 0.01. Fig.12 shows that when the neural network is trained 20,000 times, the root mean square error reaches 0.001, which meets the required accuracy.Finally, we determined that the best DNN model had nine hidden layers (3-5-7-7-7-9-9-11-11-11-1), as shown in Fig.13.
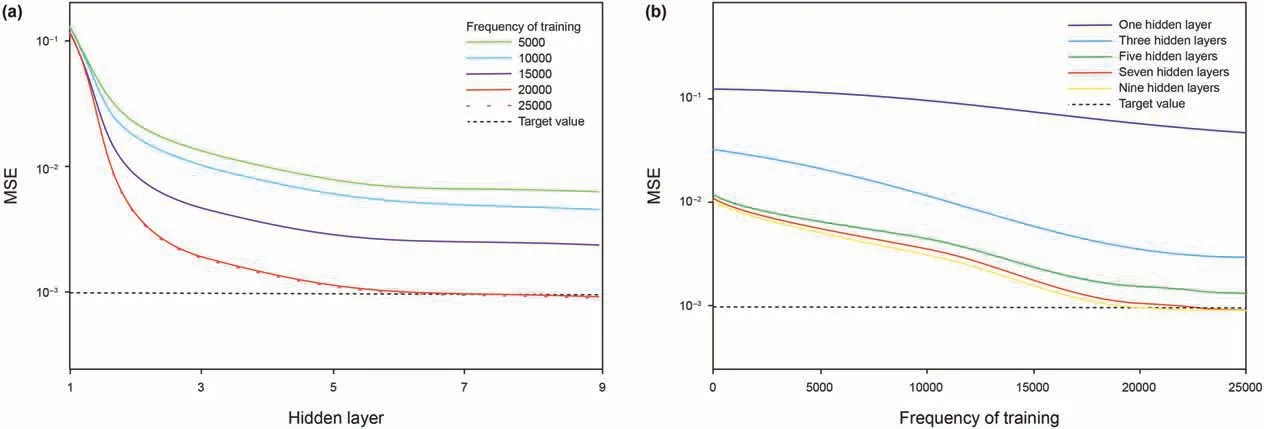
Fig.12. Performance curves of the DNN: (a) performance curves with different number of hidden layers; and (b) performance curves with different training times.
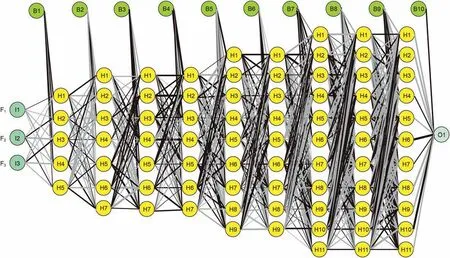
Fig.13. Best DNN network model (3-5-7-7-7-9-9-11-11-11-1). Black lines represent positive weights and gray lines represent negative weights. Line thickness is proportional to magnitude of weight relative to all others. Yellow circles represent hidden nodes and green circles represent hidden layers.
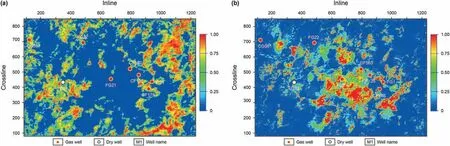
Fig.14. Deep neural network prediction results: (a) the results using single PP-wave data; and (b) the results using multi-component data.
5.2. Comparison of prediction results from PP-wave and multicomponent seismic data
First, the conventional single PP-wave-sensitive attributes(instantaneous amplitude, frequency and phase) were used as input data for prediction using DNN. The results are shown in Fig. 14a. Then, three composite attributes were input into the trained DNN, and the results are shown in Fig. 14b. It can be observed that the single PP-wave prediction result is in poor agreement with the distribution of gas wells, whereas the multicomponent composite attribute prediction result is consistent with the gas wells. The comparison shows that the multicomponent composite attribute prediction result has higher accuracy and clearer boundaries, which further demonstrates the advantages of multi-component seismic exploration.
5.3. Sensitivity analysis of the DNN to the input parameters
The sensitivity of the DNN to the input parameters was analyzed to determine the contribution of the input features (F1, F2, F3) to the output features (gas-bearing probability). In the DNN model,the connection weight between neurons is the connection between input and output. The sensitivity of the predicted output to input variables mainly depends on the connection weight.The larger the relative weight, the more sensitive the model is to the corresponding input variables, or the greater the contribution of the input parameters to the model. We performed a statistical characterisation of the weights and biases of the best DNN models, as shown in Table 2. Subsequently, the Olden method (Olden and Jackson, 2002) was used to analyze the sensitivity of all input variables of the best DNN models, as shown in Fig.15. It can be seenthat F1 and F3 have the highest weight, with an average value of 0.6207 and -0.4101 respectively, and F2 has a lower weight, with an average value of -0.255. So, the highest sensitivity of DNN gas reservoir prediction model to input parameters is F1,followed by F3 and F2.
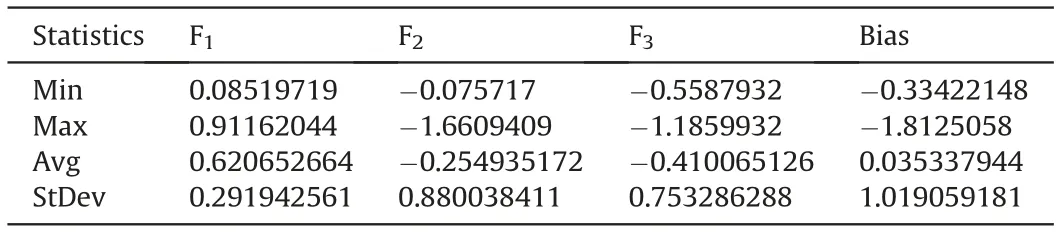
Table 2 A statistical characterisation of the weights and biases of the best DNN models.

Fig.15. Sensitivity analysis of the DNN model.
5.4. Comparison of prediction results for different networks
In the previous study,an unsupervised learning-based SOM was used to predict the gas reservoir distribution (Zhang et al.,2022b),as shown in Fig.16.Combined with the known drilling information,the predicted results are in good agreement with the known drilling areas. Although the SOM does not require a large amount of training data, the gas reservoir characteristics can be obtained based on the distribution of the data. However, it is not easy to quantitatively determine the optimal number of clusters and other network parameters,which is a limitation.For this reason,a study of supervised learning prediction methods based on DNNs was implemented in a follow-up study.
Fig.17 shows the comparative results of the BP neural network and the DNN. The gas reservoir area predicted by the BP neural network is not sufficiently focused to clearly describe the gas reservoir distribution boundary,as shown in Fig.17a.However,the prediction results of the DNN, shown in Fig.17b, have a high prediction accuracy. To further quantitatively analyze the prediction results,the prediction value generated by the two networks in the test data set was compared with the actual value, and the results are shown in Fig. 17c. The results of the DNN network have low discrepancies with the actual data, and the correlation coefficient,R2=0.92,indicates a high degree of fit,as shown by the red points in Fig.17c.In contrast,the prediction results of the BP network are substantially different from the actual data, with a correlation coefficient of R2=0.78,and a lower fit than that of the DNN model,as shown by the blue points in Fig.17c.
Compared with the BP neural network, the above analysis demonstrates that DNN has more extensive connections between neurons as the number of neural network layers increases. This allows better learning of complex hidden features with stronger nonlinear expression, higher fit, and improved gas reservoir prediction accuracy.
6. Discussion
In the previous study, we determined the best network model using DNNperformancecurves,empiricalformulas,etc.Thiswasonly used to obtain the best gas reservoir distribution prediction results from a mathematical perspective.Whether the gas reservoir predictionresultsmatchtheactualsituationneedstobefurtherinvestigated from a geological perspective to assess the proposed methods.
The gas reservoir in the study area is a tight fractured gas reservoir. Drilling and research have concluded that fractures are vital for high production in tight reservoirs (Ye, 2007). Therefore,fracture prediction is also the focus of deep tight reservoir prediction, and tectonic movement controls the fracture system and hydrocarbon accumulation.Based on the control of the local structure and fracture system on reservoir formation and gas accumulation,we discuss the consistency between the above prediction results and the actual situation and predict a favorable exploration area.
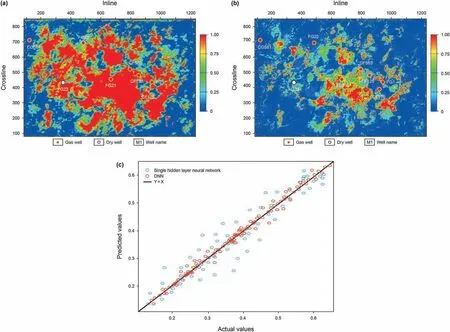
Fig.17. Comparative prediction results of different networks:(a)the gas reservoir area predicted by the BP neural network;(b)the gas reservoir area predicted by the DNN;and(c)the comparative results of the predicted values of both networks with actual data.
6.1. Fracture system and structural characteristics
6.1.1. Fractures
Seismic coherence attributes are currently widely used for fracture prediction, but these are greatly affected by the seismic amplitude.Therefore,we also used the seismic curvature attribute,which is correlated with tectonic stress,and can reveal the degree of curvature of the seismic horizon.
As shown in Fig.18a,the PP-wave coherence attribute allows us to infer fracture development characteristics.The main gas drilling areas show medium-low coherence values, indicating that the fractures are relatively developed. Fig.18b shows the energy curvature attribute, where warm areas represent positive curvature regions, indicating the anticline deformation characteristics of the formation, while cool areas represent negative curvature regions,reflecting the syncline deformation characteristics of the formation.An absolute value of curvature close to 1,indicates high possibility of fracture development. As shown in Fig. 18c, the fracture prediction superposition diagram of energy curvature and coherence attributes shows that there are areas with high absolute values of energy curvature in the high coherence value area. Thus, it is speculated that these areas are potential fracture development areas.
6.1.2. Structural characteristics
Structural characteristics play a pivotal role in the fracture system, reservoir formation, and gas migration. The basin burial-thermal evolution history (Fig. 19) shows that the source rocks had the highest hydrocarbon generation and expulsion rates in the Middle and Late Jurassic, indicating that this was the dominant accumulation period of the Xujiahe Formation gas reservoir(Li et al.,2011).According to the burial-thermal evolution history of the Xujiahe Formation(Fig.19),there were two periods of rapid subsidence: 217-208 Ma and 156-144 Ma. Therefore, there were two main periods of tectonic fracture development: the first stage led to the formation of fault-associated fractures by NWW-SEE-oriented fault action during the Yanshanian.The other stage led to fault-associated fractures formed by the NE-SE and NEE faulting in the Himalayan period.On the one hand,the tectonic fractures substantially increased the permeability of the tight reservoir and provided the basis for hydrocarbon accumulation.On the other hand, the Yanshan and Himalayan periods were vital for the gas reservoir formation in calcareous sandstone(Li et al.,2011),which was also at the peak of hydrocarbon generation. The structural fractures formed by these two periods of tectonic movement provided migration channel for early gas migration.
At the same time, the structural traps controlled the gas migration from low positions to the higher strata.Fig.20 shows that the majority of the gas wells are at a high position,which indicates that the structure controlled gas migration and accumulation.
Based on the above analysis,comprehensive fracture prediction using coherent attributes and energy curvatures was performed to comprehensively evaluate the fracture structure(Fig.21).From the analysis,type I fracture development satisfied both coherence and energy curvature, and type II fracture development satisfied only one of them.The results show that the fracture regions are mainly distributed in the higher part(anticline),structural flank,and lower part (syncline). Accordingly, the structure higher part with developed fractures is a critical gas exploration area.
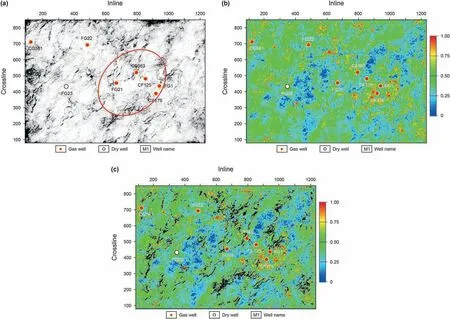
Fig.18. Fracture prediction results: (a) PP-wave coherence attribute; (b) energy curvature attribute; and (c) superposition diagram of energy curvature and PP-wave coherence attribute.
6.2. Gas reservoir prediction results evaluation
Combined with the local structure and fracture system, we assess the proposed method in terms of the structure and fracture characteristics and predict the favorable exploration area. Finally,the gas reservoir exploration area is obtained as shown in Fig. 22;the gas-bearing area of T3x4is divided into three types.
The type I region is the gas accumulation area,as shown by the red ellipse in Fig. 22. This area is located at a high position within the structure,with relatively developed fractures conducive to gas accumulation. The type II region is a more favorable gas-bearing area, and wells FG22 and CG561 have lower gas production. According to the geological data,CG561 and FG22 are low production and thin layer gas wells respectively, which have low seismic response gas bearing index.The area is at the edge of the Gaomiao Structural Belt and has well-developed fractures conducive to reservoir formation and hydrocarbon accumulation. The type III region is a favorable gas-bearing prediction area, as shown by the blue ellipse in Fig.22.Although there are no wells,the gas-bearing characteristics predicted by different methods is distinct, delineating a favorable gas reservoir area for further exploration.
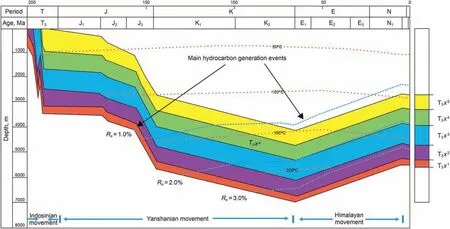
Fig.19. Burial-thermal evolution history (modified from Li et al., 2011).
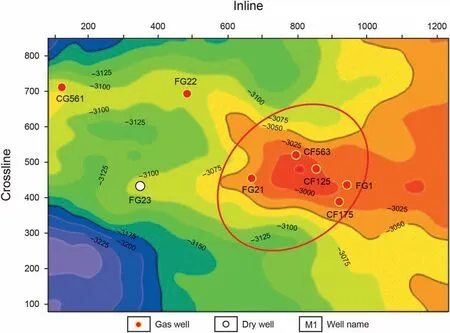
Fig. 20. Structural characteristics of the T3x46.
6.3. Overall performance
This study extracts the composite attributes, pushes the gas reservoir characteristics of known drilling area to the whole area through DNN, and directly obtains the gas bearing probability of the whole area.Therefore,it is difficult to apply the trained model to other regions for gas reservoir identification. However, the scheme designed and implementation strategy adopted of gas reservoir identification in the present study can provide useful guidance and reference for other regions.
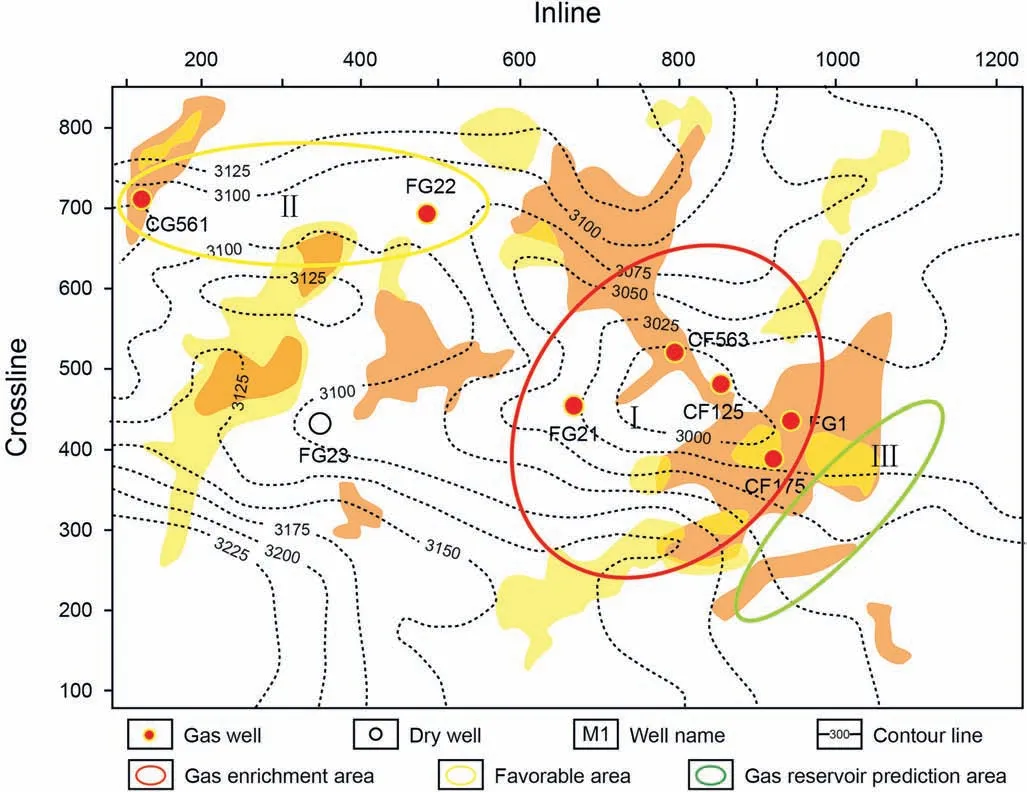
Fig. 21. Comprehensive fracture structure evaluation results.
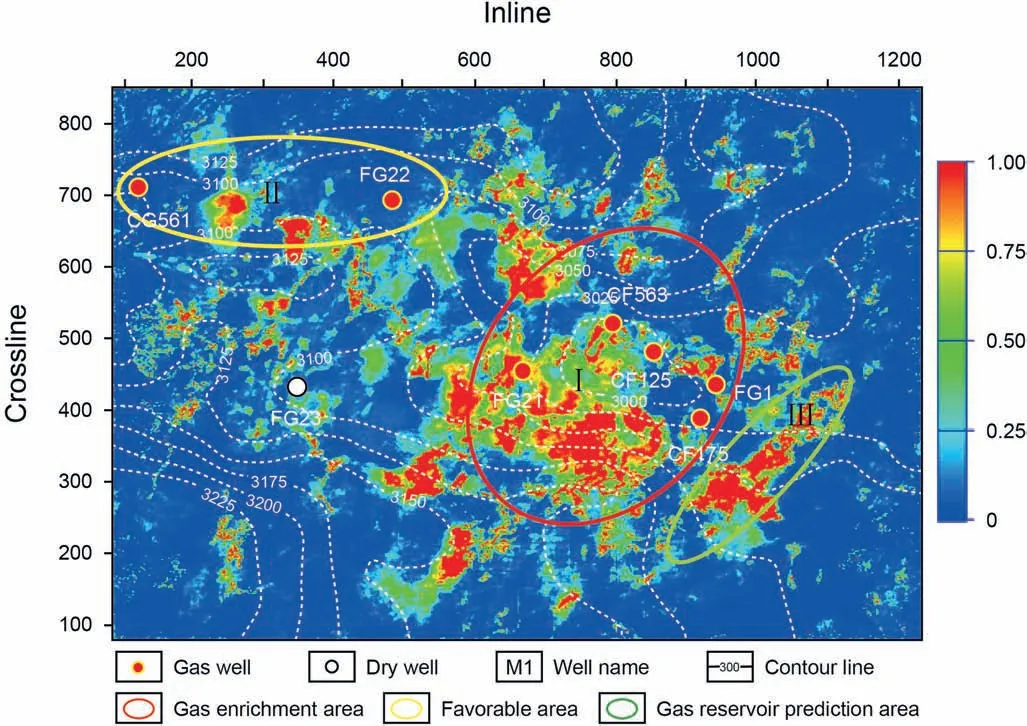
Fig. 22. Qualitative evaluation areas of the T3x46 strata.
In the next step, we will expand the labeled data labels by making model data and semi-supervised learning to enhance the transportability or generalization of the model.
7. Conclusions
This study presents a DNN-based method for predicting gas reservoirs to solve the gas-bearing identification problem of tight sandstone gas reservoirs.By applying this scheme to the prediction of actual gas reservoirs, the following conclusions were obtained.
(1) The best DNN network structure had nine hidden layers (3-5-7-7-7-9-9-11-11-11-1) determined by error analysis and performance curves for different numbers of hidden layers.Then, multi-component seismic data were fed to the DNN model. With the assistance of the DNN, the gas characteristics of the known drilling area were modelled for the entire area,and prediction results were obtained.This allowed the best prediction of the gas reservoir distribution from a mathematical perspective.
(2) The DNN technique has powerful nonlinear expression capabilities. Compared with the BP neural network, the DNN has a higher fitting degree and can improve the accuracy of delimiting the gas reservoir distribution boundaries. Meanwhile,the use of multi-component seismic data reduces the chance of a multi-solution outcome from using single PPwave data for gas reservoir prediction. This allows a higher accuracy of gas reservoir identification.
(3) Based on the gas reservoir prediction results of the DNN,likely locations of gas-bearing strata could be identified from a geological perspective.According to the local structure and fracture characteristics,relatively higher structures that bear fractures are considered to be a key area for gas exploration.Combined with the DNN gas reservoir prediction, favorable gas-bearing areas in the target layer were evaluated, predicted, and divided into three types. This provides scientific support for further exploration and development of gas reservoirs and may guide the exploration in other areas.
Acknowledgements
The research was funded by the Natural Science Foundation of Shandong Province (ZR202103050722) and National Natural Science Foundation of China (41174098). We thank editor and anonymous reviewers for their constructive comments and suggestions in improving the manuscript.We also thank the Sinopec Petroleum Exploration and Production Research Institute for providing data.
杂志排行

Petroleum Science的其它文章
- A fast space-time-domain Gaussian beam migration approach using the dominant frequency approximation
- Reflection-based traveltime and waveform inversion with secondorder optimization
- Determination of dynamic capillary effect on two-phase flow in porous media: A perspective from various methods
- Settling behavior of spherical particles in eccentric annulus filled with viscous inelastic fluid
- Laboratory investigation on hydraulic fracture propagation in sandstone-mudstone-shale layers
- Damage of reservoir rock induced by CO2 injection