Determination of dynamic capillary effect on two-phase flow in porous media: A perspective from various methods
2022-09-23JinChoCiYinChenJunChengQioLiuYngJinHuiZengChenHoSun
Jin-Cho Ci ,Yin Chen , Jun-Cheng Qio , Liu Yng , Jin-Hui Zeng ,Chen-Ho Sun ,*
a State Key Laboratory of Petroleum Resources and Prospecting, China University of Petroleum, Beijing,102249, PR China
b Institute of Geophysics and Geomatics, China University of Geosciences, Wuhan, 430074, Hubei, PR China
c State Key Laboratory for Geomechanics and Deep Underground Engineering, China University of Mining and Technology (Beijing), Beijing,100083, PR China
Keywords:Dynamic capillary effect Capillary pressure Two-phase flow Modeling method
ABSTRACT The relationship between capillary pressure and saturation plays a critical role in the characterization of two-phase flow and transport in aquifers and oil reservoirs. This relationship is usually determined under the static condition, where capillary pressure is the only function of saturation. However,considerable experiments have suggested that the dependence of capillary pressure on desaturation rate is under the dynamic condition. Thus, a more general description of capillary pressure that includes dynamic capillary effect has been approved widely. A comprehensive understanding of the dynamic capillary effect is needed for the investigation of the two-phase flow in porous media by various methods. In general, dynamic capillary effect in porous media can be studied through the laboratory experiment, pore- to macro-scale modeling, and artificial neural network. Here, main principle and research procedures of each method are reviewed in detail. Then, research progress, disadvantages and advantages are discussed, respectively. In addition, upscaling study from pore- to macro-scale are introduced, which explains the difference between laboratory experiment and pore-scale modeling. At last, several future perspectives and recommendations for optimal solution of dynamic capillary effect are presented.
1. Introduction
The constitutive relationship between capillary pressure (Pc)and wetting phase saturation (Sw) is the foundation for the characterization of immiscible two-phase flow in porous media(Cai and Yu, 2011; Cai et al., 2014, 2021; Ansarinasab and Jamialahmadi,2016; Gao et al., 2018; Liu et al., 2019). Pcis regarded as the pressure difference between the average non-wetting (Panw) and wetting (Paw) phases (Bear and Verruijt,1987). In general, the average Pc-Swrelationship is determined under the static condition where desaturation (Zhou et al., 2021) rate (∂S/∂t) is assumed as zero. A diagrammatic sketch of the non-linear and static Pc-Swrelation is given in Fig.1a. Mathematically, the relation is described as:

However, static representation by Eq. (1) leads to a poor prediction of two-phase flow behavior, especially for the case of high flow velocities(the injected phase)as shown in experimental data(Topp et al., 1967; Wildenschild et al., 2001; Oung et al., 2005;Camps-Roach et al., 2010; Sakaki et al., 2010). In this case, Pcis dependent not only on the saturation but also on the desaturation rate ∂S/∂t.The saturation-rate dependency during two-phase flow at non-equilibrium condition is called the “dynamic capillary effect”.Several phenomena have been reported as responsible factors for the presence of a dynamic capillary effect, such as air and/or water entrapment, pore water blockage, air entry effect, and dynamic contact angle (Friedman, 1999; Wildenschild et al., 2001).The difference between dynamic and static Pc-Swcurves was firstly revealed by Topp et al. (1967). In their experiment, the dynamic capillary pressure is always larger than the static one (Fig. 1b).Dynamic capillary coefficient τ,which refers as the relaxation time or damping coefficient, is a parameter for directly measuring the dynamic capillary effect. Specifically, τ controls the speed of reaching the equilibrium state. A larger value of τ indicates that more time is required for flow to reach the equilibrium after a disturbance (Li et al., 2018). More detailed summarizations on influential factors of the dynamic capillary effect, the influencing mechanism and tendency of each factor could consult the recent review work by Chen et al. (2022).
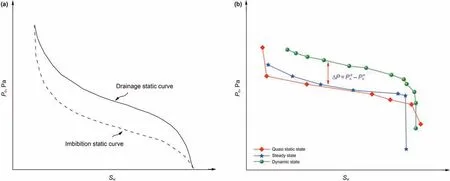
Fig.1. The schematic of Pc-Sw curves: (a) static curves (Pc is only related to Sw); (b) dynamic curves (Pc is related to Sw and its change rate over time) (Topp et al.,1967).
From the perspective of research methods, this work mainly reviews laboratory experiments, pore- to macro-scale modeling,and artificial neural network (ANN). The research procedures of each method for determining the dynamic capillary effect are introduced. For pore-scale modeling, the application condition,disadvantages and advantages of lattice Boltzmann method(LBM),pore network model (PNM) and pore-unit assembly model are discussed systematically. For macro-scale modeling, the innovations(taking different factors into account)of each model are presented, which contributes to adopting appropriate model in specific case. In addition, the cause leading to the deviation between pore-scale modeling and laboratory experiment is also explained. Lastly, several challenges for future research directions are presented.
2. Laboratory experiments for dynamic capillarity effect
In laboratory, flow experiments are better performed by changing boundary conditions monotonically since such changes prevent the occurrence of hysteresis interference (Sakaki et al.,2010). In addition, packed soils in laboratory can reduce the complications that might arise from soil heterogeneity. Meanwhile,noise of surrounding environment can be minimized, which improves the accuracy of measurement data (Diamantopoulos and Durner, 2012). As demonstrated by Lo et al. (2017), acoustic excitation results in a change in contact angle and air-entry pressure,thus affecting the dynamic capillarity effect in sample column.However, experimental approach is time and cost consuming.Meanwhile,laboratory experiments are difficult to determine some micro-scale parameters, such as interface tension and wettability.Additionally, the deviation in experiment is unavoidable owing to manual operation errors.
The schematic of the experimental apparatus is shown in Fig.2.Along the vertical direction of pressure cell, a set of probes consisting of one non-wetting phase tensiometer (Pnw), one wetting phase tensiometer(Pw), and one moisture probe (Sw) are installed at different depths. The local values of Pnw, Pwand Sware then measured at different depths. To up-scale these local values to the core-scale,an averaging process is needed.The conventional way of averaging is expressed below:
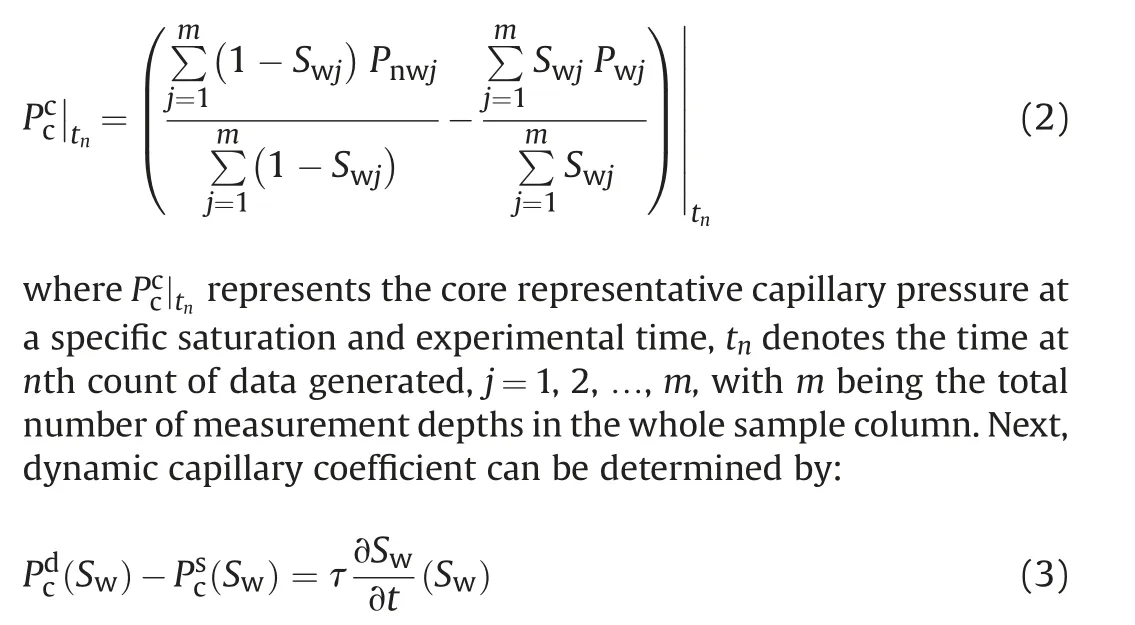
where Pdcrefers to the dynamic capillary pressure (the instantaneous local pressure difference between the two phases), Pscsignifies the static capillary pressure (Pcin a static displacement).Thus, Pdc-Sw, Psc-Swand ∂Sw/∂t-Swcurves are required to obtain the value of τ.
To determine the Pc-Swcurves, a filter system should be equipped with a tensiometer. Such a choice is based on two considerations.On the one hand,the filter system prevents the microparticles in porous media from transporting to the tensiometer.On the other hand,it allows the tensiometer to contact with one fluid solely,thus determining the pressure of each phase,respectively.A common filter system is shown in Fig.3(Oung et al.,2005),whose core component is a semi-permeable membrane (hydrophilic or hydrophobic). The membrane is too thin, where a filter plate is required to support it. One of the major drawbacks of this filter system is the limitation of applied pressure (<0.1 MPa). To assess this issue,a tensiometer is developed by connecting ceramic porous cup to pressure transducer (Camps-Roach et al., 2010), however,this arrangement may damage the structure of the porous medium.
To determine the Pc-Swcurves more rapidly,the sample column is always placed between the hydrophobic and hydrophilic membranes (Topp et al., 1967; Kalaydjian, 1992; Sakaki et al., 2010).Nevertheless,several studies have speculated that membrane may obviously affect Pc-Swcurves through disturbing the fluid distribution (Hassanizadeh et al., 2002; Bottero et al., 2006; Goel et al.,2016). In this regard, Li et al. (2020a) designed a special pressure measurement system, including semi-permeable metal plates and pressure transducers,on both sides of the sample.When compared with the traditional semi-permeable plates in Fig. 3, these metal plates have several flow channels in both radius and tangent directions,which ensure fluid to flow evenly.Thus,the disturbance to flow that resulted from filter system can be eliminated.In addition,the maximum test pressure of this special system can reach up to 1000 psi. It is therefore able to study the dynamic flow in low permeability reservoirs.
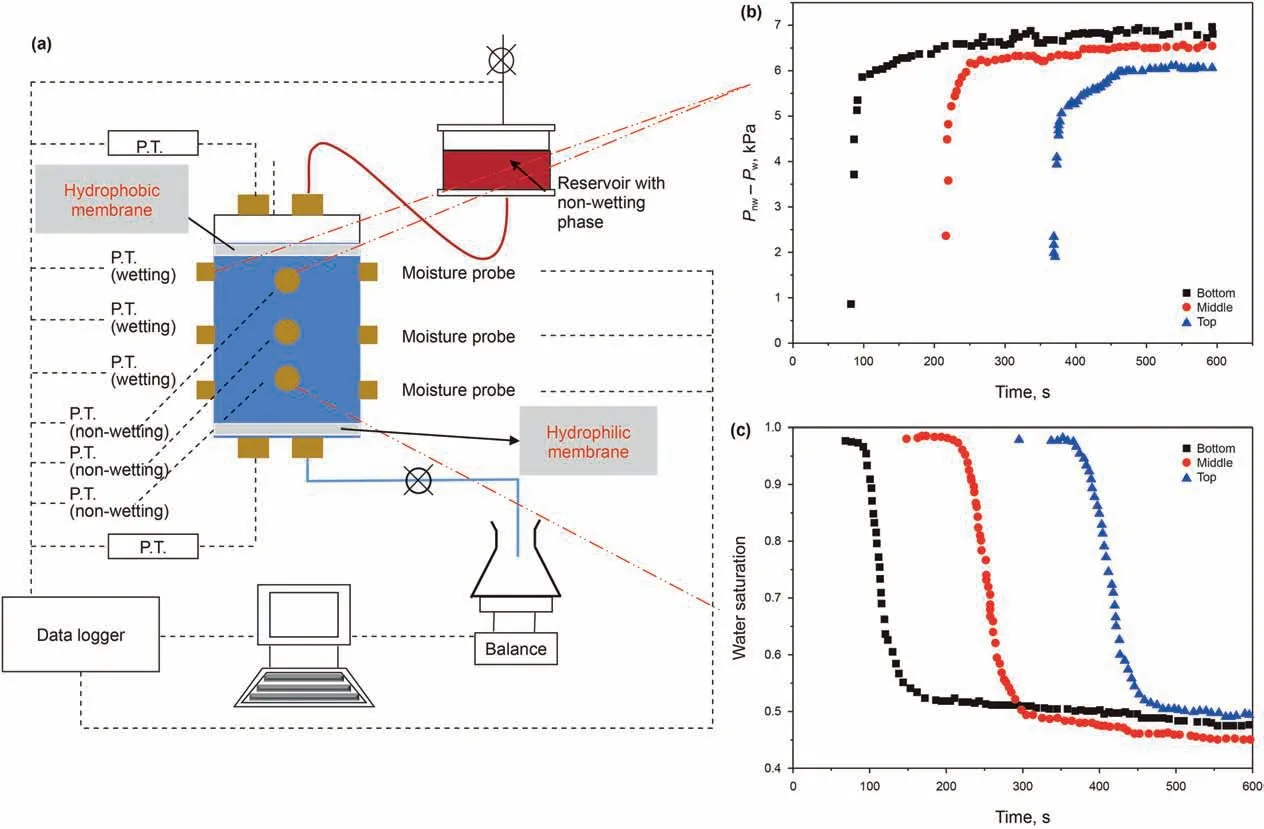
Fig. 2. (a) A schematic of experimental set up (Goel and O'Carroll, 2011), wetting phase saturation and pressure difference of two-phase are mainly measured; (b) The measured pressure difference of non-wetting and wetting phases at different depths through pressure transducers(Bottero et al.2011);(c)The measured water saturation at different depths through water probe (Bottero et al., 2011). P.T. refers to the pressure transducer.
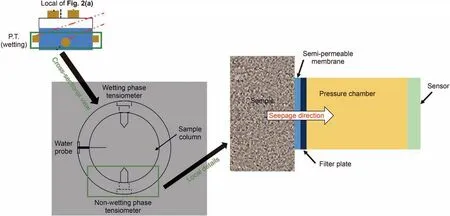
Fig. 3. The illustration of filter system in experimental set up (Camps-Roach et al., 2010; Li, 2018).

Table 1 Experimental studies dealing with dynamic capillary effect.
Table 1 summarizes various experiments concerning the dynamic capillary effect in two-phase flow. To sum up, there are mainly three deficiencies in the existing experiments.Firstly,sandy soils are selected in the majority of experiments. Whether the dynamic capillary effect is more significant in sandy materials when compared with clay soils?Nonetheless,none of investigations have confirmed that dynamic capillary pressure has ignorable differences with the static one in clay soils(Diamantopoulos and Durner,2012). Secondly, the length scale of sample column is limited(≤100 cm).In most cases,the length scale is below 20 cm(Table 1).Although various upscaling methods are proposed,it is still difficult to reach the field scale. Lastly, few experiments are conducted on low-permeability reservoir rocks. As shown in Fig. 4, dynamic capillary effect is more significant in lower permeability reservoirs due to their small pore throats.Thus,excellent pressure resistance of experimental apparatus is required to apply higher injection pressure for injecting fluid into these small pore throats.
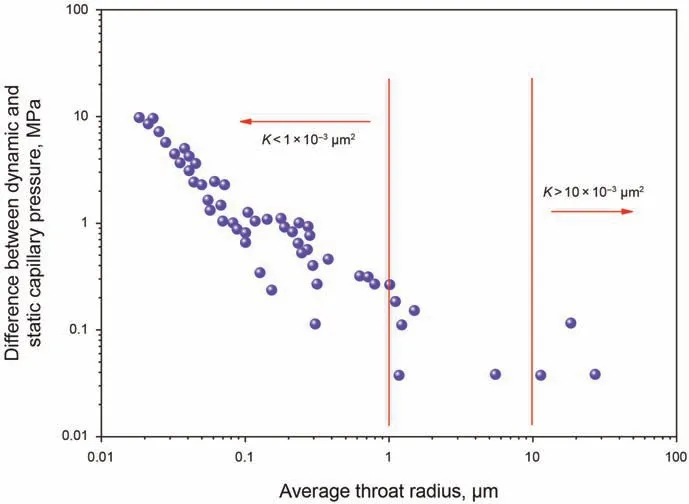
Fig. 4. The difference between dynamic and static capillary pressure with different permeabilities K: high-permeability reservoir, medium-high permeability reservoir,low-permeability reservoir (Zhang et al., 2015).
3. Modeling
3.1. Pore-scale model
Pore-scale models are generally categorized by two types: (i)models that divide the pore space into pore bodies and throats,such as PNMs (Thompson, 2002; Joekar-Niasar et al., 2010; Qin,2015; Xu et al., 2022) and pore-unit assembly models (Mason and Mellor, 1995) and (ii) models that employ fully resolved simulations of flow within the pore geometry (i.e., direct simulation methods), such as LBM (Vogel et al., 2005), smooth particle hydrodynamics (Tartakovsky and Meakin, 2006; Kunz et al., 2016),computational fluid dynamic simulations(Ferrari and Lunati,2012;Rabbani et al., 2017), dissipative particle dynamics method (Groot and Warren, 1997), bundle-of-tubes model (Dahle et al., 2005),and volume of fluid method (Raeini et al., 2014a, 2014b). Among them,PNM,LBM,and pore-unit assembly models have been widely performed to investigate the dynamic effect in two-phase flow.Pore-scale model achieves outstanding advances in highperformance computing. Moreover, the accomplishment of porescale model requires a comprehensive acquaintance of the morphology of pore geometry and the physical processes at the pore-scale.
3.1.1. LBM
LBM simulates the fluid through virtual particles, which can continuously transmit and collide in discrete lattice mesh (Zhang,2011). It includes the color-gradient model (Gunstensen et al.,1991; Ba et al., 2016; Liu et al., 2020), the Shan-Chen model (also called the pseudo-potential model) (Shan and Chen, 1993; Jiang and Xu, 2021; Zheng et al., 2021), the free-energy model (Swift et al., 1996), and the mean-field model (He et al., 1999). Among them,the Shan-Chen model has advantages of simplicity,flexibility,and clear description of the basic microscopic physics of phase segregation, which is a favorable alternative to investigate the dynamic capillary effect in two-phase flow.
The basic idea of the Shan-Chen model is to utilize a pseudopotential that depends on local density and interaction strength to represent the pair-wise microscopic molecular interactions at mesoscopic scale (Huang et al., 2007). Yan et al. (2018) first established a Shan-Chen model to investigate the dynamic effect of twophase flow in two-dimensional (2D) porous media. In their work,the D2Q9 lattice cell was selected, then a package of the circular disk was filled into a 500×500 square lattice domain to simulate the two-phase flow (Fig. 5). This operation was performed to replicate the displacement phenomenon in two-phase flow.
When the simulation initiates, fluids will invade into the pore space under the action of pressure boundary between top and bottom until the equilibrium is reached. Then, Pc, two-phase saturation (Sw, Snw), and interfacial area (anw) of the two-phase meniscus at the end of each time interval are obtained. Subsequently, the static or dynamic Pc-Sw/Snw-anwcan be extracted from equilibrium and non-equilibrium flow conditions. On this basis,they manifested that the variation of Pdcand anwboth increase with larger pressure boundary during a non-equilibrium process.Although this model is relatively simple, it still arouses interest in applying the Shan-Chen model to study the dynamic flow. The deficiency is that the dynamic capillary effect was not quantified by τ.
To fill this knowledge gap,Tang et al.(2018)established a D3Q27 model to investigate the value of τ. Such a choice is based on two considerations. On the one hand, the D3Q19 model is not coincident with the Galilean invariance(Kang and Hassan,2013).On the other hand, the Reynolds stresses will occur in both D3Q19 and D3Q15 models while this problem can be ignored in the D3Q27 model (Kuwata and Suga, 2015).
According to Eq.(3),a dynamic Pc-Swcurve,a static Pc-Swcurve and ∂Sw/∂t are required to calculate the value of τ. To obtain the static Pc-Swcurve, simulations with ultra-low flux rates are needed, which consume considerable computational resources.Therefore, Tang et al. (2018) modified Eq. (3) as follows:
After finishing the simulation,the resulting Pcin each lattice cell is at the micro-scale. When the dynamic capillary effect at the Darcy-scale is discussed, an upscaling method is required. In this aspect,Tang et al.(2019)presented an explicit definition of Pdcat the Darcy-scale based on the energy conservation law:
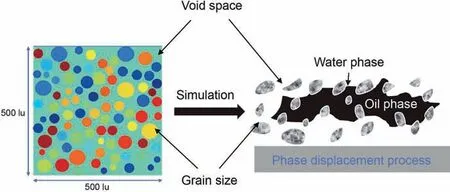
Fig. 5. A package of the circular disk in 500×500 lu2 2D lattice domain (Yan et al.,2018): the various disks represent the soil particles, and the green background denotes the pore space.

where q is the flow rate. The input energy induced by external pressure (Wep) is dispersed on the viscous force (WV), kinetic (Ek),and Pc. Taking contact angle into account, they performed simulation under 105°and 140°, respectively. They found more wetting phase remained under large contact angles. With larger contact angle,dynamic capillary pressure increases and the change rate of saturation decreases, thus leading to a larger τ.
Likewise, Cao et al. (2020) simulated the dynamic two-phase flow in tight sandstone by constructing a D3Q27 model. Tang et al. (2018) applied the machine learning method to extract pore information, while Cao et al. (2020) adopted the U-net model.Comparing with the machine learning method, the U-net model can record the 3D representation parameters of all pores,and take both the gray threshold and topological structure of the pore space into account. Therefore, the U-net model can greatly improve the accuracy of pore structure characterization, which contributes to simulate the two-phase flow more reliably.
When compared with other pore-scale approaches,LBM can be implemented easily for performing parallel computation(Liu et al.,2012). Meanwhile, it could recover the incompressible Navier-Stokes equation when the fluid velocity is much lower than the sound speed (He and Luo, 1997; Dellar, 2003). More importantly,LBM can solve equations corresponding to arbitrary-complex pore geometry without simplification. Thus, it represents an actual entire porous medium.
3.1.2. Pore network model
In 1985,Koplik and Lasseter(1985)established the first dynamic PNM to simulate dynamic flow of the imbibition process. Since then, great attention has been paid to simulate two-phase flow(drainage and imbibition processes) through the dynamic PNM.Generally, the research process can be summarized as four steps(Gielen et al., 2004, 2005; Joekar-Niasar et al., 2010; Joekar-Niasar and Hassanizadeh, 2011):
(i) Establishing the PNMs to simulate porous media. Note that,the construction of network should be based on the connectivity, shape, and aspect ratio of real pores.
(ii) Solving the local-scale variables (Pcand Sw). The local capil
lary pressure picis expressed as:
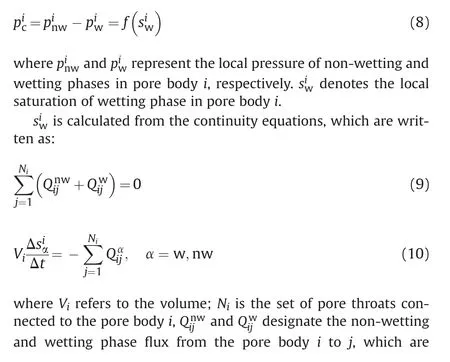
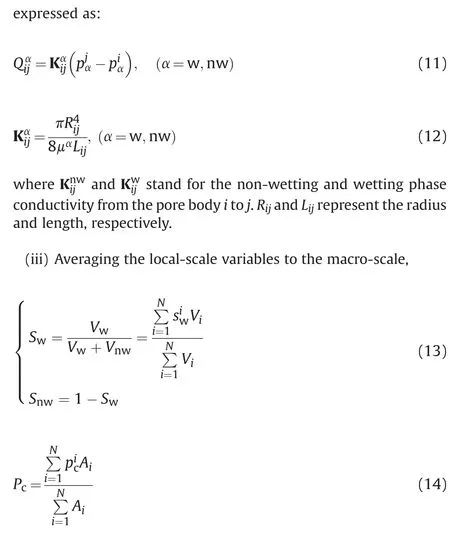
where N is the total number of the pore bodies,Vwand Vnwdenote the volume of wetting and non-wetting phases,Viis the volume of pore body i,Airepresents the interfacial area between the wetting and non-wetting phases in pore body i.
(iv) Calculating the value of τ from Eq. (3).
Table 2 summarizes the studies of the dynamic capillary effect from different PNMs.The PNMs established by Gielen et al.(2005)have poor simulation results and strong instability under the condition of very small capillary numbers. Meanwhile, many physical processes such as snap-off, capillary diffusion, and local countercurrent flow could not be observed in these simulations. To avoid this, Joekar-Niasar et al. (2010) presented three improvement points:a) allocating two separate pressure fields to the two fluids,so the picof each pore body was considered; b) considering the pore-scale flow mechanisms (i.e., snap-off and cooperative pore filling);c)updating saturation by semi-implicit method to enhance the simulation stability at low flow rates. However, their results were only suitable for the drainage process. Subsequently, Joekar-Niasar and Hassanizadeh (2011) discussed the dynamic capillary effect of two-phase flow under both drainage and imbibition processes. Meanwhile, they could simulate a larger pore space by adopting the truncated octahedrons as pore bodies.
PNM has been mainly utilized to investigate the influence of various parameters on two-phase flow. It can easily obtain some variables that are difficult to determine from the experiments. In contrast to LBM, PNM simplifies the pore geometry of real porous media, which obviously reduces computational effort and simulates a much larger domain(Golparvar et al.,2018).Synchronously,this simplification will lead to the omit of pore structure information. Another ubiquitous deficiency of PNM is that the pore geometry of porous medium is assumed to be rigid,regardless of the deformable characteristic of pore geometry and the frequent occurrence of coupled flow in porous media.
3.1.3. Pore-unit assembly model
In the pore-unit assembly model, a pore unit is surrounded by the tetrahedron, whose zeniths are formed by four interfacing spherical particles. The pore geometry of spherical particles is abstracted by regular triangulation. The whole pore space is represented by the assembly of pore units(Mason and Mellor,1995).A large number of researches reveal that the pore-unit assembly model can be applied to the Pc-Swcurve in porous media(Gladkikh and Bryant,2005).Subsequently,some efforts have been devoted to investigate the dynamic capillary effect in two-phase flow. In this regard, Sweijen et al. (2018) simulated dynamic drainage in the packing of spheres by coupling a pore-unit assembly model with the discrete element method. The effectiveness of this model was verified by the quasi-static Pc-Swcurve. In their work, they analyzed the effect of averaging,boundary condition,domain size,and permeability on the dynamic capillary effect.The results were thereby compared with existing experimental results.
Similar to the PNM, the pore-unit assembly model also simplifies the pore geometry.However,the combination of the discrete element method and the pore-unit assembly model can successfully incorporate the deformation and coupling flow (Yuan et al.,2016).
3.2. Pore-scale flow behavior
3.2.1. Capillary valve effect
Porous media always include substantial pores with different sizes. Large pores are connected by small throats, thus forming a sudden geometrical expansion along pore-throat interface. This expansion will impede the movement of invading fluid. At expansion interface, invading fluid will remain stagnant until the interface pressure difference exceeds a threshold value Pt, which is called the “capillary valve effect”.
Due to the capillary valve effect,there are two types of invasion pattern, namely bursting and merging invasion. Bursting invasion occurs when invading fluid advances from a throat to a pore. The threshold value for bursting invasion is written as (Wu et al.,2016a):

3.2.2. Snap-off
During imbibition process,two-phase fluid interfaces at corners will become unstable when local capillary pressure in a pore throat pijcis smaller than a critical value, and thus leading to the occurrence of fluid snap-off. As for square cross-sectional pore throat,Vidales et al. (1998) proposed a criterion:
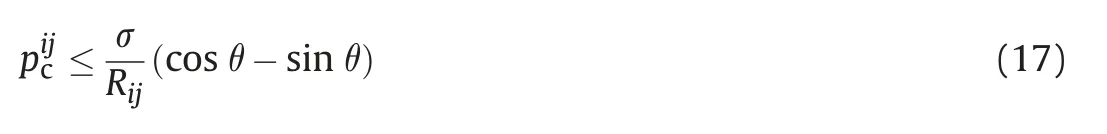
It is always assumed that as soon as snap-off appears, wettingphase fully occupies pore throat, and the nonwetting phase immediately retreats into the two neighboring pore bodies.
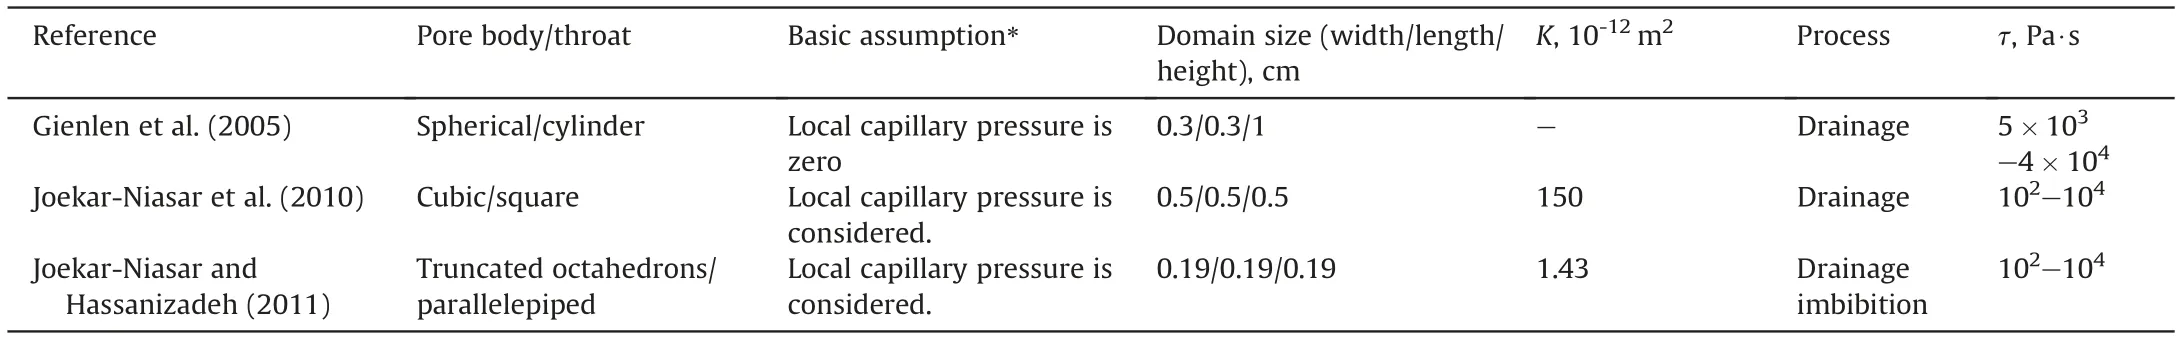
Table 2 The summary of the literature for PNMs.
Both capillary valve effect and snap-off will greatly affect interface shape and interface force, and in turn altering the Pc.Theoretically,these pore-scale flow behavior also have influence on the dynamic capillary effect. In this aspect, Wu et al. (2016b)demonstrated that flow pattern is capillary fingering when bursting invasion is dominated, while it is stable when merging invasion is dominated. Xu et al. (2017) presented a LBM colorgradient model to study the dynamic constant angle, indicating that the difference in threshold pressure is the origin of preferential flow paths due to the capillary valve effect. Hence, qualitatively discussing the effect of capillary valve effect and snap-off on the dynamic capillary effect is proposed to be the focus for future research.
3.3. Macro-scale models
3.3.1. Stauffer model
To describe the dynamic Pc-Swrelationship, Stauffer (1978)replaced the static Pcby dynamic one in the Brooks and Corey(1964) model. Based on experimental observations, the dynamic capillary effect is described as:
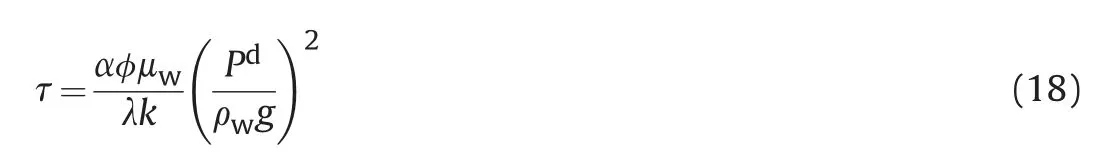
where α is a constant(α=0.1),φ designates the porosity,Pdstands for the entry pressure,λ denotes the pore size distribution index,μwreflects the viscosity of the wetting phase,k represents the intrinsic permeability, g and ρware the gravity constant and the density of wetting phase, respectively. In Eq. (18), τ is defined by the properties of fluids (μw, ρw) and porous media (φ, λ, k, Pd). Since these properties are considered constant,the value of τ in Eq.(18)is also regarded as constant in laboratory.Gielen(2007)stated that Pd/ρwg is defined as a characteristic length scale Lsof the porous medium.Then they found τ varies linearly with μwand Ls.
In Eq.(18),the contribution of non-wetting phase properties on the dynamic capillary effect is neglected, regardless of the significant influence of these properties on two-phase flow(Hassanizadeh and Gray,1993; Das et al., 2007; Joekar-Niasar and Hassanizadeh, 2011; Hou et al., 2014). In addition, no dependence on saturation is included. Subsequently, Joekar-Niasar and Hassanizadeh (2011) modified Eq. (18) by incorporating an effective viscosity μeff:

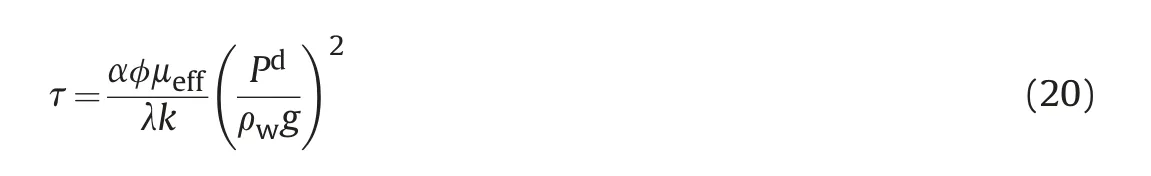
where μnwis the viscosity of non-wetting phase, μeffdepends on the fluid viscosities and spatial fluid distribution, which is linearly weighted by saturation. Eq. (20) is only valid for the case where a piston-like movement is dominated.
3.3.2. Hassanizadeh and Gray model
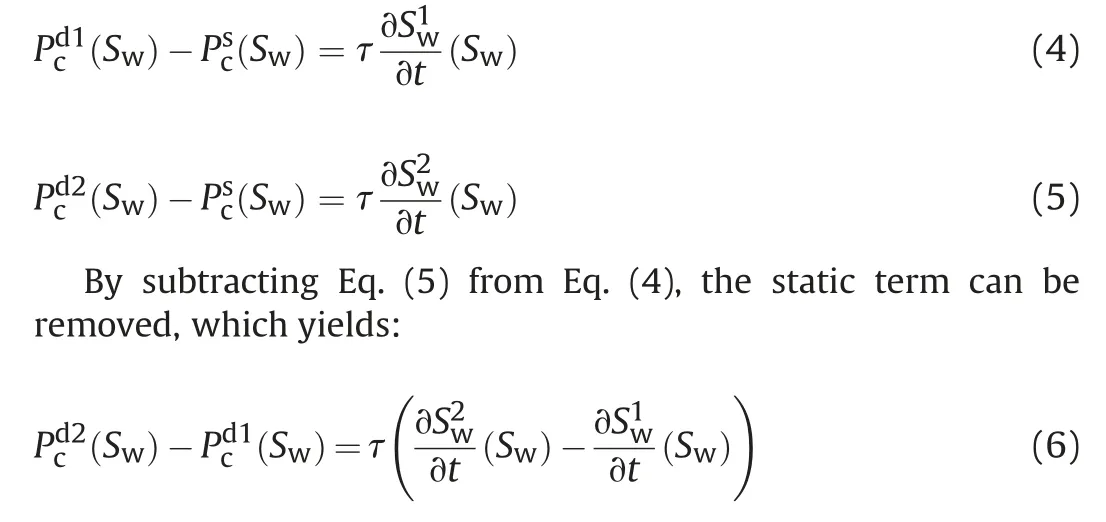
As shown in Eq. (3), Hassanizadeh and Gray (1993) proposed a thermodynamically-based relationship between Pdcand Psc. For a drainage process,the rate of desaturation(∂Sw/∂t)is negative.Thus,the Pscis smaller than Pdc. The opposite is true for the wetting process.The relationship between(Pdc-Psc)and ∂Sw/∂t is a straight line with a slope of τ.When ∂Sw/∂t is zero,Eq.(3)is simplified to Eq.(1).
Eq. (3) has been the subject of several previous studies,computationally using the Darcy-scale models (Manthey et al.,2005; Das et al., 2006) and the pore-scale models (Joekar-Niasar et al., 2010; Joekar-Niasar and Hassanizadeh, 2011) as well as experiments (Oung et al., 2005; Bottero et al., 2006; Camps-Roach et al., 2010). Strictly, dynamic effect includes the dynamic capillary effect and the relative permeability effect, but only the dynamic phenomenon in Pc-Swrelationship is involved in Eq. (3).
3.3.3. Barenblatt model
Taking the relative permeability effect and the dynamic capillary effect both into account, Barenblatt (1971) assumed that dynamic relative permeability (kdr) and Pdccan be expressed by their static counterparts at a certain situation:
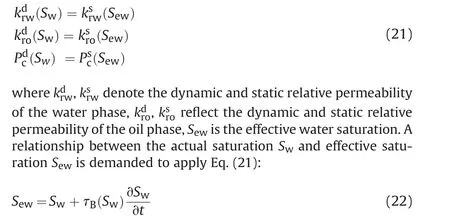
where τBrepresents the relaxation time, which is defined as the time to reach an equilibrium of fluids in porous media.As stated by Barenblatt et al. (2002), dynamic capillary effect is caused by the redistribution processes at the pore-scale.At the equilibrium state,Sewis equal to Sw.
Subsequently, Juanes (2008) found that the relationship between τ and τBis written as:
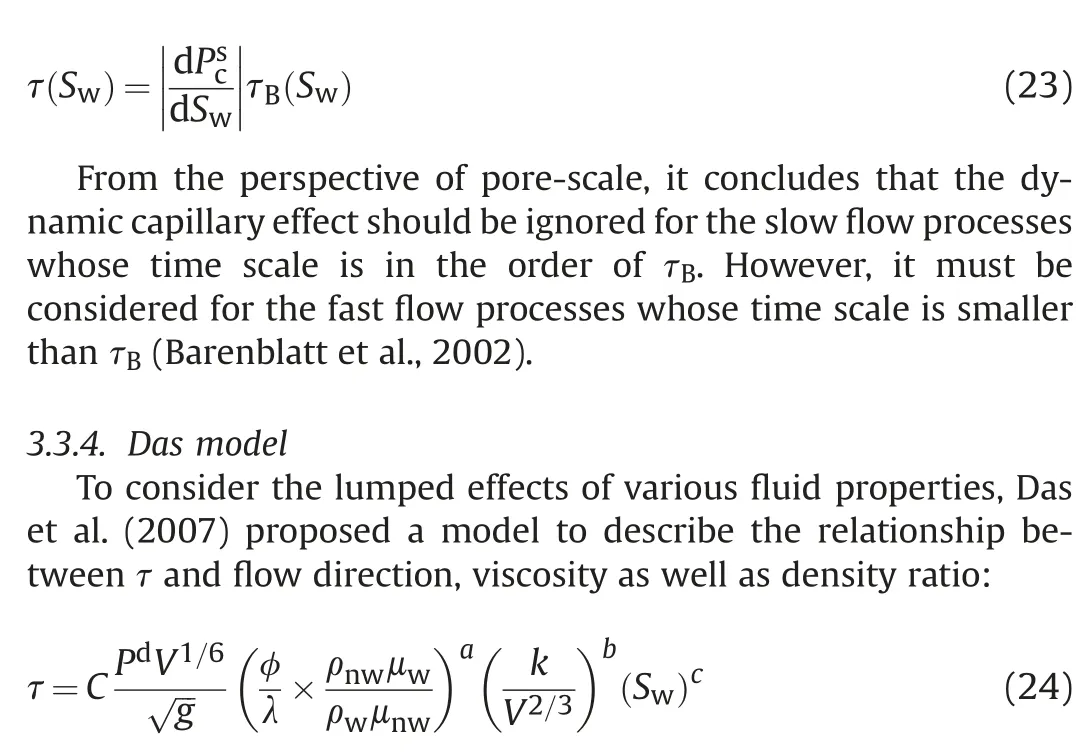
where V is the domain scale, ρnwdenotes the fluid density of the non-wetting phase, C represents a dimensionless constant of proportionality,a =f(k/V2/3),b =f(Sw),and c are the dimensionless coefficients. In Eq. (24), a scaling relationship is found, indicating that τ varies with Swand V. The reliability of Eq. (24) was demonstrated by numerical results,but its applicability on heterogeneous domains needs further studies. Targeting different scenarios, the values of C, a, b, c are different.
3.3.5. Abidoye and Das model
Based on the Buckingham’s G-theorem, Abidoye and Das(2014b) determined sets of dimensionless parameters from chosen variables. Then, two dimensionless groups of variables were demanded to describe the combined effect of various variables on
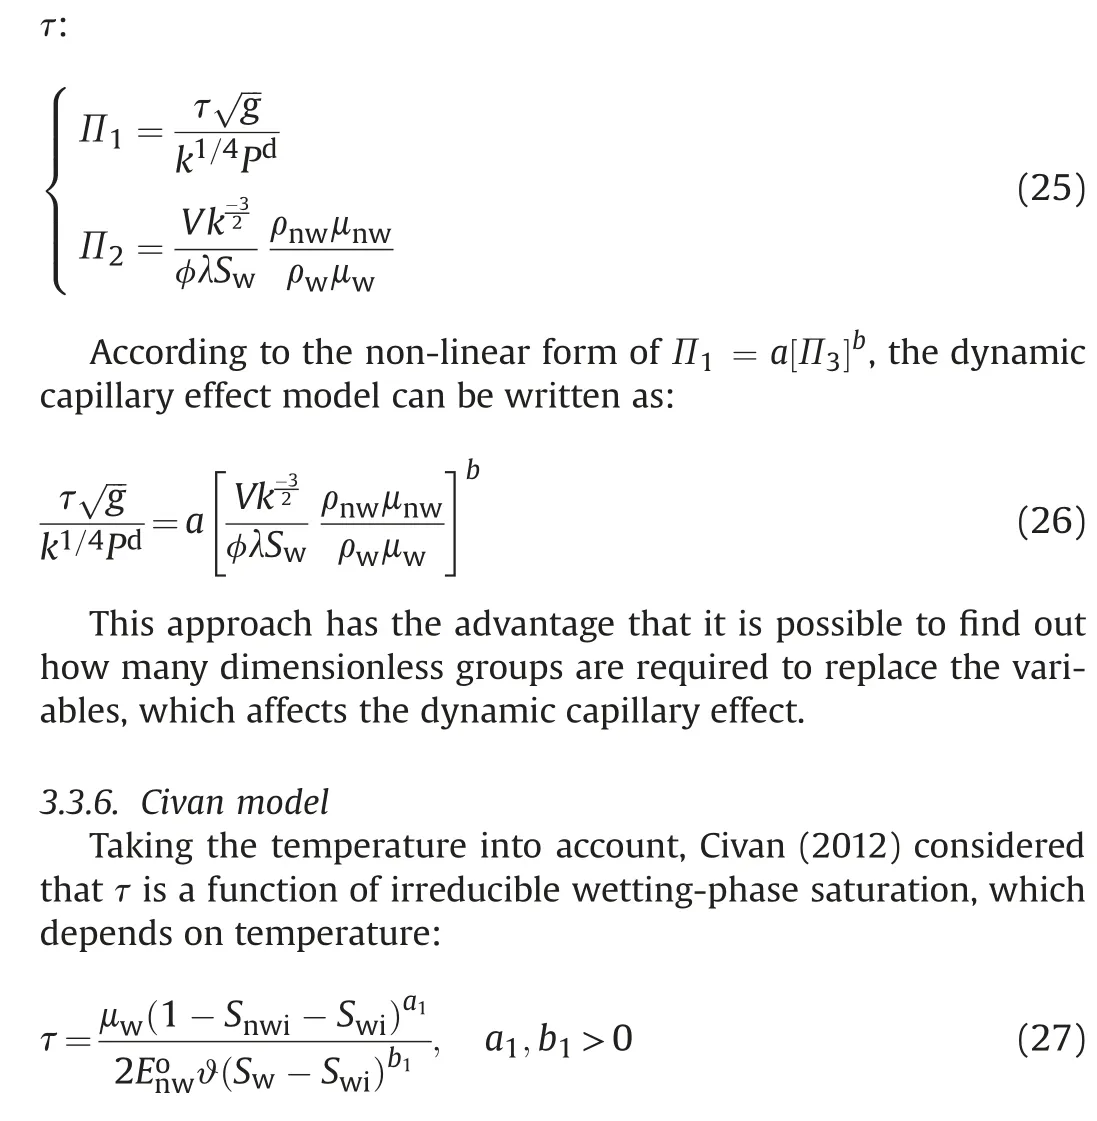
where Swi, Snwiare the irreducible saturation of wetting and nonwetting phases, Eonwdenotes the empirical coefficient; ϑ represents a rate coefficient, a1, b1are the empirical fitting parameters.Among them,a1,b1,Swi,and Snwiare dependent on temperature.As shown in Fig. 6, a linear relationship is found between the scaled parameters and temperature. To be more specific, b1and Swiincrease with an increasing temperature, while a1decreases as temperature increases.
3.3.7. Li model
Considering the effect of fracture,Li et al.(2020b)confirmed the existence of fracture leads to a decrease of pressure imposing area(Fig. 7), thus weakening the dynamic capillary effect. Then, dynamic capillary effect of fractured rocks can be expressed as:
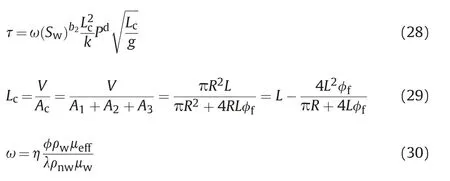
where ω, η, and b2are the fitting parameters, φfis the fracture porosity,Lcmeans the effective pressure imposing length,L denotes the rock length, R signifies the rock radius, Acis the pressure imposing area. Note that, the orientation, aperture, and other properties of fracture also influence the dynamic capillary effect.Thus, further studies are demanded to establish the dynamic capillary coefficient models, which incorporate the lumped effects of various properties of fracture.
3.4. Upscaling from pore- to Darcy-scale
Pcis a pore-scale phenomenon, and refers to the pressure difference across the two-phase fluid interface at the static state:

In a porous medium, it is more difficult to measure Pcat the pore-scale owing to the more complicated internal construction(Ferrari and Lunati,2013).Thus,a macro-scale Pcdefined in Eq.(1)is proposed.In laboratory experiments,the average macro-scale Pcin Eq.(1)is calculated as the pressure difference between the nonwetting phase at the inlet (Pin) and wetting-phase at the outlet(Pout). Therefore,Eq. (1) can be rewritten as:
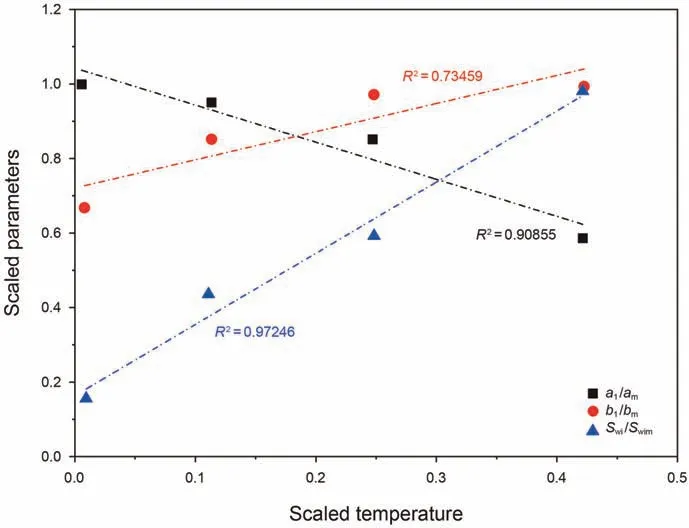
Fig.6. The relationship between temperature and parameters in Eq.(27)(am,bm,Swim are the maximum values of a1, b1, Swi).
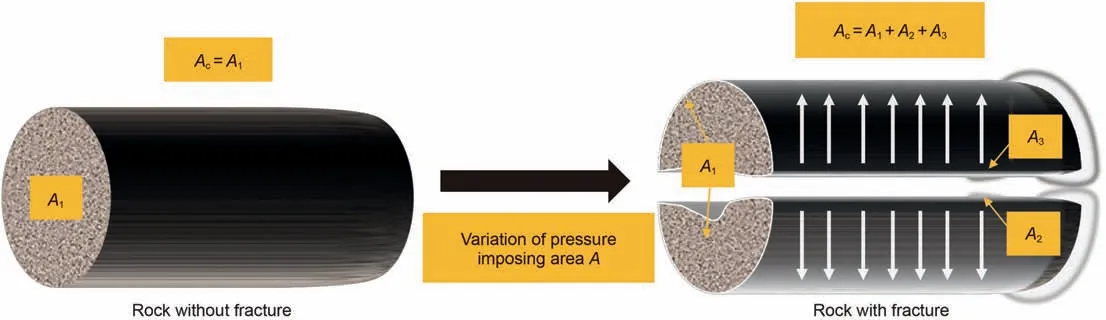
Fig. 7. The variation of pressure imposing area with fracture (Li et al., 2020b).

where ΔPiois the total pressure drop across the porous medium between the inlet and outlet. Conventionally, ΔPiois equal to the pore-scale Pcin Eq. (31) under all conditions. However, considerable studies have demonstrated that this is not the case when the fluid pressures within the pores vary with time and space due to the dynamic capillary effect. Under the dynamic flow,macro-scale Pcincludes the pore-scale Pcand pressure head caused by the viscous effects:

where ΔPinrepresents the pore-scale capillary pressure,Pvisis the pressure head caused by the viscous effects.In fact,pore-scale Pcis the “true capillary forces” in porous media, which should be upscaled to obtain the macro-scale Pc-Swrelationship. In laboratory experiments, it is difficult to measure the true capillary forces without accounting for the viscous pressure head.Fortunately,this difficulty can be overcome through the pore-scale simulations.
4. ANN
ANN is a certainly useful modeling tool to extract desired information from data,which can mimic the labor of the human brain and the ability of the nervous system to perform functions. It mainly consists of various “neurons”, which are divided into interconnected subsets,including input,hidden and output layers,having respective biases, weights, and transfer functions (Mueller and Hemond, 2013). Then, comprehensive neurons constitute a network, which builds the relationships between the inputs and outputs through transfer functions and controls the values of biases and weights. As for two-phase flow system, the corresponding modeling parameters have complicated relevance, however ANN can guarantee the accuracy of relevant functions (Hanspal et al.,2013). Therefore, it is worth considering that the ability of ANN for predicting the dynamic capillary effect.
This ability was first demonstrated by Hanspal et al.(2013).They found that ANN can describe the relationship between the changes in porous media and fluid properties,so it can predict the dynamic capillary effect in two-phase flow accurately and ensure that τ is a function of water saturation. Unfortunately, the dependency of dynamic capillary effect on domain scale and heterogeneity was ignored.To address these issues, Abidoye and Das(2014a) utilized ANN to investigate the effect of domain scale on τ using the published experimental data,the results show that the magnitude of τ increases as domain size increases. Concerning heterogeneous porous media,Das et al.(2015)developed a new ANN approach to quantify the magnitude of τ in heterogeneous porous media with different heterogeneity intensity w.The simulation results indicate that an increase in w leads to a larger τ.
Most of the experimental and computational flow-physicsbased techniques employed to describe and quantify the dynamic capillary effect are very resource-intensive and extremely timeconsuming for complex three-dimensional (3D) fluid flows. Surprisingly,ANN is easily and conveniently to be established,so it can obviously reduce the cost and computational time. Meanwhile,studies have further shown that ANN is capable of offering the physically realistic values of τ, which ensures the accuracy of the application of ANN on dynamic two-phase flow.Note that,ANN has great advantages of studying the dynamic capillary effect in heterogeneous domains where experiments and other numerical models are difficult to solve.
5. Discussion
Accurate representation of the Pc-Swrelationship under dynamic two-phase flow is essential for improving the oil recovery in low-permeability reservoirs.Up to date,impressive advances have been made to account for the dynamic capillary effect. As for laboratory experiment, macro-theoretical model, and PNMs, some future directions are summarized as follows:
(1) Dynamic capillary effect is extremely obvious in lowpermeability reservoirs, especially for ultra-low permeability reservoirs. Due to the presence of the dynamic capillary effect, the oil recovery of these unconventional reservoirs will greatly reduce. Hence, more experiments should be done for low-permeability reservoirs. Lowpermeability reservoirs have the characteristic of small pore throat, hence the required displacement pressure is relatively higher. In this case, the requirements for the filter system are higher. More improved apparatus should be designed to apply the high displacement pressure without destroying the structure of porous media.
(2) Pcat the pore-scale is the pressure difference between the interface between two fluid phases. It represents the “true capillary forces”in the system,which is only related to pore shape and interfacial energy of the two phases. In experiment, final measured Pcat the macro-scale always includes the viscous pressure head.Many studies have demonstrated that macroscopic Pconly agrees well with “true capillary force” at the equilibrium state. However, macro-scale Pccontains the pore-scale Pcat fluid-fluid interface and viscous pressure head at dynamic state.
(3) Inspection of aforementioned macro-models,the value of τ is closely related to the porosity, entry pressure, and permeability, thus it significantly relies on the micro-structure of porous medium. Therefore, an accurate description of microstructure is beneficial to investigate the dynamic capillary effect more exactly. It is reported that fractal geometry is a prominent approach to represent the pore throat structure and analyze the fluid flow of porous media.Therefore,it is feasible to develop a fractal theoretical model to quantify the dynamic capillary effect.
(4) Up to date, none of the researchers have directly compared the simulation results of pore-scale models with experimental results of two-phase flow. Because it is still challenging to monitor pore-scale real measurements in 3D domains.Once this problem is solved,the simulation results of pore-scale models can be closer to the natural condition.As for PNMs, complex quasi-static PNMs with mixed-crosssectional pores and unstructured irregular networks have already been developed, while the network structures of dynamic PNMs are still quite simple. This may lead to a deviation in the study of dynamic capillary effect. Therefore,it is required to develop dynamic PNMs with complex pore topology and geometry.
6. Conclusion
The non-equilibrium flow in porous media frequently occurs in petroleum, chemical,and environmental engineering,which leads to a much more complex relationship between capillary pressure and saturation. Thus, the dynamic capillary effect has been a subject of global interest with huge investment and research. This review systematically summarizes various methods to investigate and quantify the dynamic capillarity effect, including laboratory experiments, the macro-scale models, the pore-scale models as well as the artificial neural networks. The evaluation and future development of each method are discussed. Furthermore, a more accurate and easy operating method is anticipated to depict the dynamic capillary effect of two-phase flow.
Acknowledgments
This study was financially supported by the National Natural Science Foundation of China(No.42102149),and the Fundamental Research Funds for the Central Universities(No.2462021YXZZ005).
杂志排行

Petroleum Science的其它文章
- A fast space-time-domain Gaussian beam migration approach using the dominant frequency approximation
- Predicting gas-bearing distribution using DNN based on multicomponent seismic data: Quality evaluation using structural and fracture factors
- Reflection-based traveltime and waveform inversion with secondorder optimization
- Settling behavior of spherical particles in eccentric annulus filled with viscous inelastic fluid
- Laboratory investigation on hydraulic fracture propagation in sandstone-mudstone-shale layers
- Damage of reservoir rock induced by CO2 injection