Permeability measurement of the fracture-matrix system with 3D embedded discrete fracture model
2022-09-23BaoJiaChengGangXian
Bao Jia , Cheng-Gang Xian ,*
a State Key Laboratory of Petroleum Resources and Prospecting, China University of Petroleum (Beijing), Beijing 102249, China
b Unconventional Petroleum Research Institute, China University of Petroleum (Beijing), Beijing 102249, China
Keywords:Permeability Fracture Pulse-decay Shale Viscosity
ABSTRACT In this work, we performed the pulse-decay experiment on a fractured shale core and applied the 3D embedded discrete fracture model (EDFM) to simulate the experiment process. The irregularly rough fracture surface was depicted in detail using a 3D scanner.Then the fracture surface profile was imported in the discrete fracture network model to simulate the flow process in the fracture-matrix system realistically. History matching was efficiently performed to simultaneously obtain porosity and permeability for the matrix and fracture.Gas properties after applying nanopore confinement were obtained by modifying Sutton's viscosity correlation with sensitivity analysis on the pore diameter ranging from 2 to 50 nm. Nanopore confinement results in low matched permeability due to viscosity reduction in the matrix-only porous media. The fracture-matrix system complicates the interpretation of nanopore confinement impact on flow behavior in shale reservoirs.Different scenarios of the highly fractured and matrix-dominated systems were discussed in detail by constructing the digital twin model.
1. Introduction
Well-developed fracture network is commonly seen in shale reservoirs, and complex fractures are generated during the hydraulic fracturing process(Yan et al.,2011).Insightful investigations into the matrix-fracture properties,e.g.,porosity and permeability,help understand the shale reservoirs to properly design field operations to recover hydrocarbon from the subsurface efficiently.Pulse-decay experiment is a feasible unsteady-state method of measuring the ultra-low permeability of unconventional shale due to the technical challenges faced by the steady-state process(Feng et al., 2016; Sheng et al., 2019). Many pioneering contributions explored the pulse-decay method include work by Brace et al.(1968), Hsieh et al. (1981), Ning (1992), Cui et al. (2009). The double porosity tight cores were also investigated by many researchers, such as the work by many researchers like Ning et al.(1992), Liu et al. (2016), Alnoaimi (2016), Han et al. (2018, 2020),and Zhang et al. (2020). Ning et al. (1992) developed a doubleporosity model and history matching program that considered flow from all the surfaces; in his model, flow flux from all surface and fracture surfaces were considered.Liu et al.(2016)developed a dual-continuum model to interpret pressure-pulse decay experiment, emphasizing the late-time pressure signals; in their model,flow flux from surfaces inside the samples was considered. Zhang et al. (2020) also developed a dual-continuum model for the pressure pulse decay method.The early and late pressure data were used to estimate fracture and matrix permeability,respectively;in their model, flow flux from end faces but not from the fracture surfaces were considered. And also, they discussed the impact of anisotropy on the interpreted results.Han et al.(2020)developed a dual-continuum model for the pressure pulse-decay experiment.Testing parameters' impacts like upstream and downstream volume in the experimental set-up were discussed.
Most of the previous work focused on 1D analytical solutions or numerical modeling of the pulse-decay experiment. Our previous work(Jia et al., 2020) included the tortuous fracture in 2D using a discrete fracture network model. However, when the fracture is irregularly rough in 3 dimensions, building a 3D model becomes necessary to capture the transient flow process in the fractured porous media more precisely.
The gas flow process in the porous media is closely related to several essential flow parameters, such as gas compressibility factor and viscosity. Reliable empirical correlations have been developed to connect these important properties to pressure/temperature and critical pressure/temperature. The dynamic properties will be imported into the numerical simulator, which will evolve as the time step proceeds in response to the pressure and temperature change. Different valid correlations of fluid properties will result in a similar trend as a function of pressure and temperature,but values may not be precisely the same. Therefore,interpreted permeability from pulse-decay experiments will depend on selected empirical property correlations.
In the porous media, fluid molecules may collide with each other and the pore wall surface.The molecule-molecule and poremolecule interactions are insignificant macropores (>50 nm) but maybe not be inconsiderable for nanopores to mesopores(<50 nm). Alternation of fluid properties due to the small pore diameter is caused by the impact of “pore confinement”, or “pore proximity”, as the molecule size is comparable to the pore size. In contrast, fluid properties without the impact of porous media are referred to as the “unconfined” or bulk condition properties.
Many researchers have explored the degree of phase behavior alternation due to pore confinement. For instance, Singh et al.(2009) applied Monte Carlo simulations to study phase behavior change of several pure hydrocarbons. They reported functions of critical temperature and pressure changes due to the nanopore confinement. Ma et al. (2013) summarized the shift of critical properties based on the modifications of the van der Waals equations. Critical properties could be the key input in the empirical correlations for temperature and pressure-dependent fluid properties, like compressibility factor, density, and viscosity. Therefore,alternations of these properties will result in the difference in the pulse-decay experiment interpretation. This kind of proof of concept has not been performed in the open literature to the best of our knowledge.
Based on the discussions above,this work aims to(1)construct a 3D model including the fracture penetrating the shale core to simulate the pulse-decay experiment; (2) investigate different empirical correlations and the impact of nanopore confinement on gas flow parameters in the porous media;(3)explore the nanopore confinement impact on the interpretation of the pulse-decay experiment, as well as the implications for fluid flow process in the fractured shale reservoir.
2. Materials and method
A Wolfcamp core with a longitudinal fracture was applied in this study (Fig. 1). The core was 3.81 cm in diameter and 6.35 cm in length. Fig. 1 shows that parallel bedding along the fracture was obviously observed.
A 3D scanner was applied to capture the roughness of the fracture. Totally 76 triangle-shaped polygons were combined to represent the tortuous surface between the two halves of the core cylinder(Fig.2).An apparent fault-like discontinuity was observed near the middle of the fracture plane. The circle cross-section was approximated as a squared shape for the simplicity of numerical modeling. Upstream and downstream reservoirs were installed before and after the core inlet and outlet, respectively. The numerical model consisting of core and the up and down-stream was constructed to simulate the pulse-decay process. Shapes of the upstream and downstream were approximated as cuboids on the basis of the reservoir volumes. The side surface area of the two reservoirs was made the same as the cross-section of the core cylinder. The matrix of the core was divided into 10 segments to track the flow movement in the model.
Initially, the upstream was filled with higher pressure gas than the downstream and the core sample(matrix and fracture).When the experiment started, gas first traveled through the preferential flow path, the fracture. In contrast, gas slowly penetrated the matrix from the upstream and part of the fracture surface. When gas flow arrived downstream, gas permeated the matrix from three sources: upstream, downstream, and fracture.
First, the direct import of flow properties from REFPROP was applied(Lemmon et al.,2002),which was based on the correlations by Ely and Hanley(1981,1983).Afterward,Sutton's correlation was applied to calculate viscosity again (Sutton, 2007), and the compressibility factor was calculated based on the work by Abou-Kassem et al. (1990). The new set of gas properties was applied to history match the pressure curves to obtain matrix-fracture properties again.

Fig.2. A numerical model consisting of the upstream and downstream reservoirs,with the fractured core component in the middle.
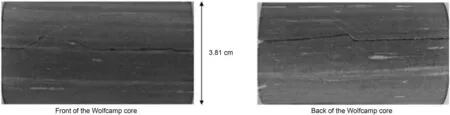
Fig.1. Photos of the front (left) and back (right) of the Wolfcamp shale.
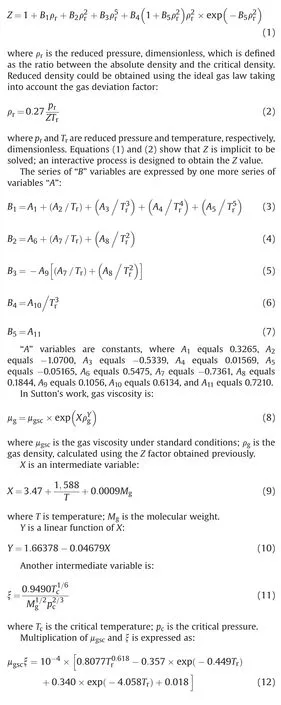
Abou-Kassem et al. (1990) expressed the compressibility factor as:
Viscosity calculation based on Sutton's equation yields an approximate value of 1.50E-2 cP under the prevailing conditions(30°C, 241-586 kPa), which differs from the value by Ely and Hanley (1981,1983) that around 2.00E-2 cP. Therefore, one could deduce that the measured permeability will change as well when the viscosity correlation is changed by the history matching pressure curves of the pulse-decay experiment.
Nanopore confinement on compressibility factor and viscosity alterations is realized by tuning the critical temperature and pressure employed in the equations above. The magnitudes of shifts of the critical temperature and pressure are expressed by ΔTcand Δpc,respectively.
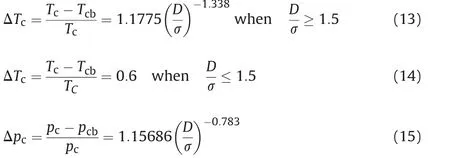
where D is the pore size; σ is the effective molecule diameter,defined as the diameter of the smallest cross-section area of the molecule; Tcband pcbare the critical temperature and pressure under bulk conditions, respectively; Tcand pcare the critical temperature and pressure with nanopore confinement, respectively.
3. Results and discussions
3.1. Surface topology based on the scanning result
The figure below shows the fracture surface generated based on 3D scanner results.Totally 44 points(red dots in Fig.3)were chosen from the 3D scanning results, and the coordinates of these points were obtained to populate into the numerical model.The 44 points were connected with each other using the shapes of triangles.Totally 76 triangle-shaped polygons were constructed to characterize the heaving and dipping topology of the fracture surface;smaller triangles were used close to fault-like discontinuity to describe the heterogeneity in more detail. Surfaces below and above the discontinuity were relatively flat; therefore, fewer triangles were applied. The scanned topology of the fracture surface was linked to the simulation results using the embedded discrete fracture modeling (EDFM) approach. This approach was applied based on non-intrusively inserting the complex discrete fractures,i.e.,the 76 triangle polygons representing the non-planar fractures,to the exiting computing domain, the matrix grids in this work.

Fig. 3. Fracture surface generated from the 3D scanner.
In the EDFM approach,additional fracture cells are added to the original matrix cells, and one fracture cell consists of several fracture segments (Xu et al., 2016). In addition to the connection between matrix segments,non-neighboring connections(NNC)are applied in the EDFM approach.Three kinds of NNC are available in EDFM: (1) between matrix segment and the fracture segment, (2)between fracture segments in the same fracture cell, and (3) between intersecting fractures in different fracture cells. The EDFM approach has been proved with accuracy in many applications of reservoir simulations (Yu and Sepehrnoori, 2018; Tripoppoom et al.,2019).
3.2. History matching of the matrix-fracture system
General pulse-decay experiments are performed without obvious fractures, where the pressure declines and increases monotonically in the upstream and downstream monotonically,respectively. For a core with a long fracture penetrating longitudinally,pressure behavior is different:the upstream and downstream pressures first coverage to a point, indicating the two sides of the core, including the fracture, reach the same pressure. Then the pressure in the system decreases simultaneously except in the matrix.
In the EDFM simulation, four parameters, including matrix and fracture permeability(kmand kf),matrix and fracture porosity(φmand φf)were set as tunable parameters during the history matching process.1000 test runs were performed for each history matching process, and the solution with the least matching error was regarded as optimal. Fracture porosity defined by the EDFM approach is expressed by:
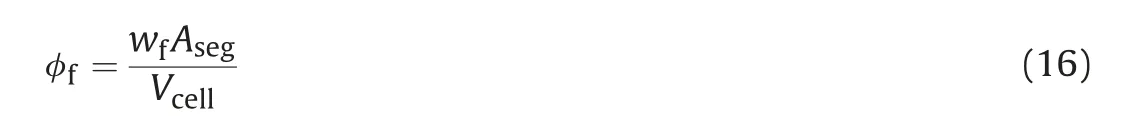
where wfis the fracture width; Asegis the fracture segment area;Vcellis the volume of the cell where the specific fracture segment is located.
Fig.4a shows four stages of the pulse-decay experiment on the fractured core. When the experiment starts, the upstream is filled with high-pressure gas while the downstream and core are filled with low-pressure gas. Fig. 4b shows the period when gas flows preferentially in the fracture while the matrix flow is relatively slow. At this stage, pressure in the downstream begins to be felt.Fig. 4c shows the point when the upstream and downstream pressures become the same. Pressure in the middle of the matrix remains lower than the other parts of the system.Fig.4d shows the scenario of pressure equilibrium in the whole system.
According to the history matching results, the matrix permeability and porosity are 1.00E-02 mD and 5.42%, respectively; the fracture permeability and porosity are 2.06E+02 mD and 0.59%,respectively. The fracture permeability is 4 orders higher than the matrix permeability. Jia et al. (2020) divided the pulse-decay experiment for the fractured core into three periods: fracture dominated, double-porosity, and matrix dominated. A “hump” region, a featured characteristic of a pulse-decay experiment on a fractured core, is formed before the matrix-dominated period.However, the difference between fracture-dominated and doubleporosity periods becomes blurred in this work, and the “hump”region is hardly seen (Fig. 5). The first reason is that the fracture permeability is not high enough by comparison with the matrix permeability, so the matrix flow period is relatively short. The second reason is that the fracture volume is much larger than the matrix pore volume: two horizontal dashed lines were plotted parallel to the x-axis according to the highest and lowest points of the downstream pressure curve to approximately calculate the fracture volume and the matrix pore volume based on Boyle's law(Fig. 5); data required include the initial pressure, final pressure,volume of the reservoirs and core dimensions.The fracture volume is estimated to be 10 times higher than the matrix pore volume.

Fig. 4. Different stages of the pulse-decay experiment on the fractured core:(a)beginning of the experiment;(b)early stage when gas flows preferentially in the fracture;(c)the point when upstream and downstream are connected by the fracture; and (d) the end of the experiment when the system reaches pressure equilibrium.
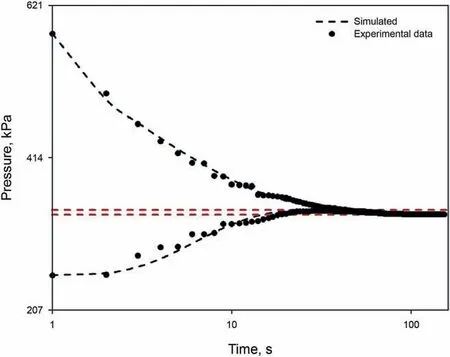
Fig. 5. Experimental pulse-decay pressure curves and simulated results after history matching.
3.3. Sensitivity analysis of the matrix-fracture properties
Fig. 6 performed a sensitivity analysis with increasing and decreasing matrix/fracture porosity and permeability by 50%.Based on the previous discussion, a large difference between the matrix pore volume and fracture volume helps identify the“hump”region.However,Fig.6a shows upstream and downstream pressure curves with fracture porosity changing ±50% only have parallel translations where the equilibrium pressure changes, but the “hump”region does not change much, neither does in Fig. 6c where the matrix porosity changes by 50%. Fig. 7a shows the extended modeling carried out to continuously decrease fracture porosity by 90%.The fracture volume becomes more comparable to the matrix pore volume: the “hump” region, characteristic of the fracture,becomes slightly more recognizable. Fig. 6b shows the pressure curves after tuning the fracture permeability by ±50%. When the fracture permeability increases and decreases,the converging point between the upstream and downstream becomes advanced and delayed, respectively. The “hump” region is more recognizable when the fracture permeability increases by 50%.Fig.7b shows the scenario of constructing high-contrast permeability by decreasing the matrix permeability by 90%.,which means adding one order of magnitude of the permeability contrast between the matrix and fracture. As the pressure propagation in the matrix further slows down, the “hump” region is more clearly to be seen though the converging point does not change much. Therefore, according to Fig.7,reducing the identical ratio in matrix permeability has a more profound impact on increasing the recognizability of characteristics in the pulse-decay pressure curves on a fractured core than in the fracture porosity.

Fig.6. Sensitivity analysis of pressure behavior regarding matrix/fracture properties:(a)changing fracture porosity by 50%;(b)changing fracture permeability by 50%;(c)changing matrix porosity by 50%; and (d) changing matrix permeability by 50%.
3.4. Pore confinement on flow behavior in the matrix-fracture system
Fig.8a shows the relative difference of gas compressibility factor considering nanopore confinement compared with the bulk condition. Deviation of compressibility factor from the bulk condition becomes less in a larger pore and under lower pressure.The highest relative difference is no more than 2.00%under the prevailing flow conditions; for pores with the size of more than 50 nm, the deviation becomes negligible. Fig. 8b shows the relative difference of gas viscosity compared with the bulk condition.μbis the viscosity under bulk condition, μnpis the viscosity with nanopore confinement. Three lines representing different pressures overlap with each other because the viscosity with the maximum pressure gap,i.e., ~345 kPa, only changes 0.05%. For a nanopore with the size of 2 nm,the relative difference of viscosity can be as high as 60%;but,the impact of confinement on viscosity is impaired sharply when the nanopore size increases,that the relative difference is less than 3% for a pore larger than 50 nm.
Based on the understanding of flow parameters as shown above,one could readily imagine that when the matrix viscosity decreases, which is a sign of flow capacity increase, the matrix permeability should decrease as well to decrease for the purpose of history matching the same pressure curves. This kind of proof of concept was realized by constructing a digital twin model pressure curves of a non-fractured core with the correlations by Ely and Hanley (1981, 1983). The model was attributed with the matrix permeability of 1.00E-2 mD, which was previously matched(Fig. 9a). Then Sutton's viscosity correlation in bulk condition and nanopore confinement of 2 and 50 nm were applied to match the upstream and downstream pressure curves generated by the digital twin model (Fig. 9b).
The viscosity from Ely and Hanley (1981, 1983) and Sutton(2007) are 2.00E-2 cP and 1.50E-2 cP, respectively. The viscosity is further lower considering the nanopore confinement. Ely and Hanley's (1981,1983) value was used as the base to calculate the ratio between the digital twin scenario and the other scenarios for both permeability and viscosity.History matching the permeability results show that the permeability ratio is consistent with the viscosity ratio (Table 1), which is consistent with the fundamental Darcy's law that the permeability and viscosity at the numerator and denominator should change with the same proportion to keep the flow flux the same.
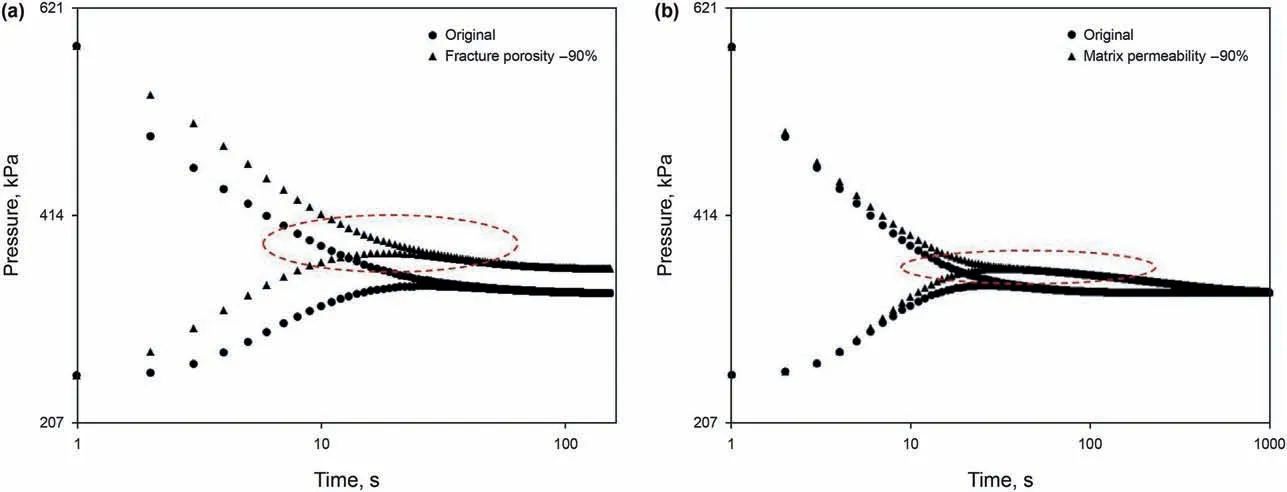
Fig. 7. Pulse decay pressure curves by (a) reducing fracture porosity by 90%; (b) reducing matrix permeability by 90%.
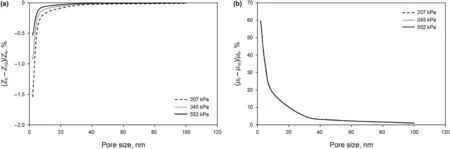
Fig. 8. Relative differences of (a) compressibility factor and (b) viscosity of helium in nanopores with different sizes under varying pressures.

Fig.9. (a)Digital twin model that only contains matrix,the red part represents the upstream;(b)pressure curves generated by the digital twin model and history matched curves using modified compressibility factor and viscosity.
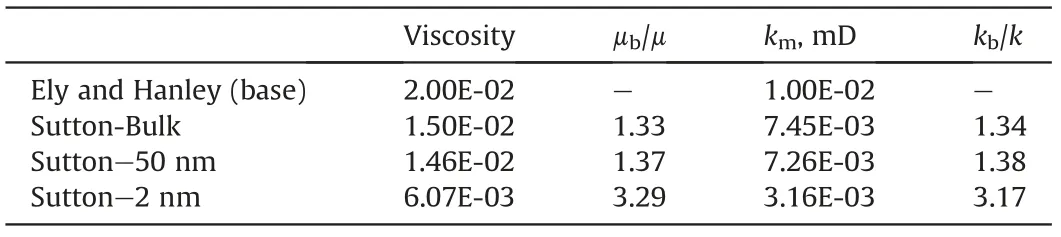
Table 1 History matching results of the matrix-only system.
The viscosity correlation from Ely and Hanley (1981,1983) was first applied to history match the pressure curves on the real fractured core.Table 2 summarizes matrix and fracture properties after history matching. The fracture permeability is four orders of magnitude higher than the matrix permeability. It is worth mentioning that when considering nanopore confinement,deviations of the viscosity and compressibility factor from the bulk condition should be only accounted for in the matrix but not in the fractures and the reservoirs before and after the core where gas remains in the bulk state. Fracture permeability reduces to the same value,147.20 mD,from 206.00 mD as in the base case in all the scenarios that applied Sutton's correlation. However, the matrix permeability does not show a consistent trend compared with the base case.A possible explanation is that the core used in this study is a highly fractured one. The fracture volume is about ten times larger than the matrix pore volume, and the fast fracture flow dominates in the matrix-fracture system.These reasons lead to the fact that the matrix permeability change is not sensitive to the whole pressure propagation. It can be assumed that in a system where the matrix flow process is more dominating, the matrix permeability will depend more on the viscosity in the matrix pore space.
To verify the assumption, the matrix permeability was reduced to one-tenth of the original value to elongate the duration of the matrix-dominated flow period. The simulated pressure curves in the digital twin model served as the source pressure curves to be matched. Pressure curves are present in Fig. 10, and results are summarized in Table 3.
As shown in Table 3, in Sutton's model without nanopore confinement,the viscosity is about~1.50E-02 cP,with the viscosity ratio of 1.33 using the value by Ely and Hanley (1981,1983) as the numerator. History matching results show that both fracture and matrix permeability ratios are close to the viscosity ratio.
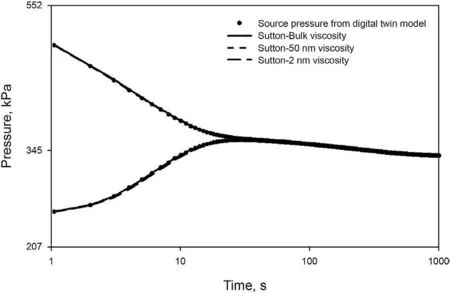
Fig.10. History matched pressure curves based on the pressure data generated by the digital twin model after reducing matrix permeability to one-tenth of the original value. The viscosity and compressibility were modified using different correlations,and nanopore confinement with 2 nm and 50 nm was taken into account.
Considering 50-nm pore confinement, the gas viscosity in the reservoirs and fracture remains the same; but reduces slightly in the matrix, where the viscosity ratio increases slightly to 1.37.History matching results show that the fracture permeability ratio is the same as the bulk viscosity ratio;the matrix permeability ratio also increases but does not at the same pace as the viscosity ratio increases. 2-nm pore confinement reduces gas viscosity significantly to 6.07E-3 cP, and the viscosity ratio increases to 3.29. The matrix permeability change marginally influences fracture permeability that the permeability ratio is 1.40; the matched matrix permeability continuously increases compared with the 50-nmscenario to 1.68, but is still much lower than the viscosity ratio.
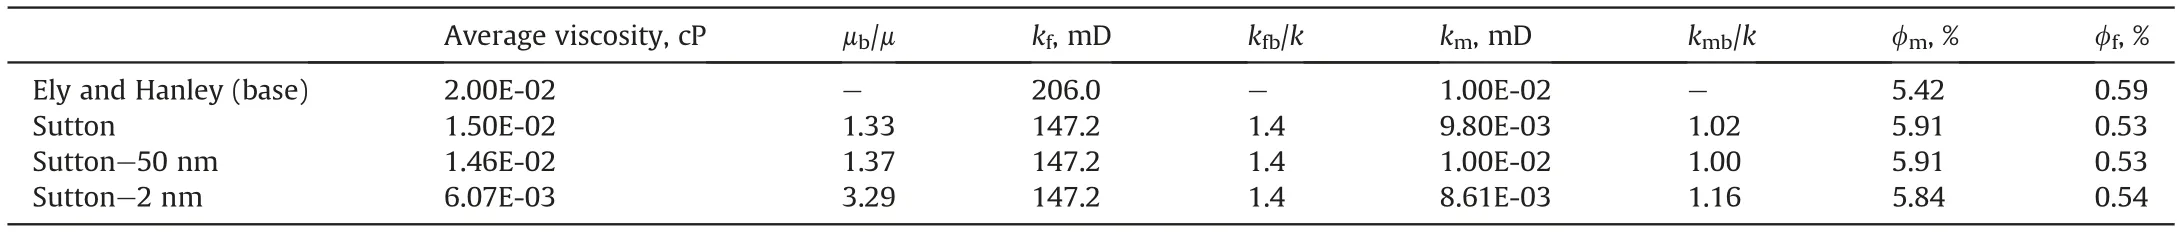
Table 2 History matching results of the fractured core.
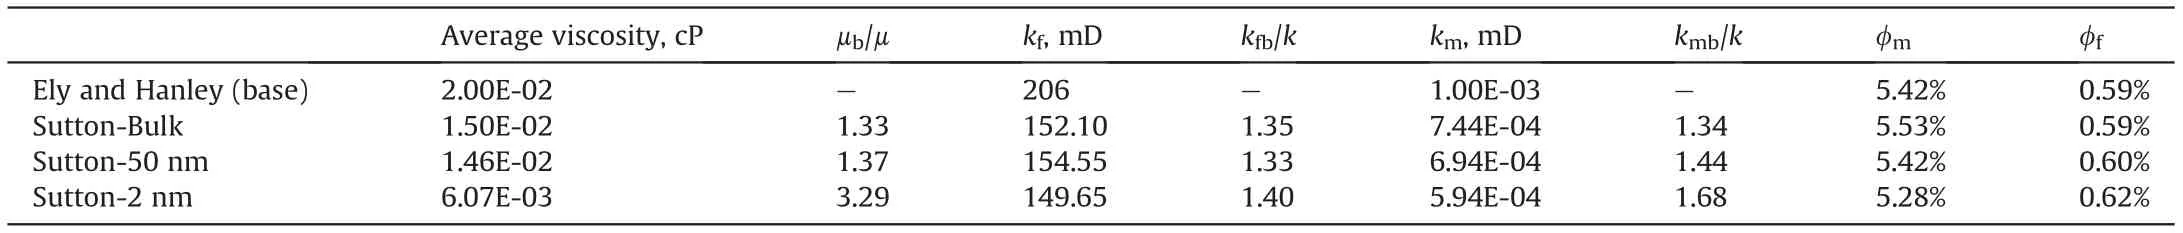
Table 3 History matching results of the digital twin core with the matrix permeability reduced to one-tenth of the original value.
Based on the observations from these series of history matching results,in the fracture-matrix system,fracture flow and matrix flow interact with each other, and the degree of interaction strongly depends on the degree of fracture development. The matched fracture permeability changes proportionally as the viscosity changes in the highly fractured system,but the matrix permeability does not. In a relative matrix flow-dominated system, the dependence of matched matrix permeability on the matrix viscosity grows,but Darcy's law's implication is not strictly followed. These observations from the pulse-decay experiment imply that a direct viscosity alternation using different correlations or caused by nanopore confinement may not have a corresponding proportional change in the flow flux change in the matrix-fracture system of shale reservoirs.
In this work, we did not consider the permeability anisotropy impact, i.e.,the horizontal and vertical permeability are taken as a whole in the modeling process. Generally speaking, kh, the horizontal permeability along the lamination planes should be larger than kv, the vertical permeability perpendicular to the lamination planes. Therefore, khand kvshould be larger and smaller than the simulated integrated permeability values,respectively.The ratio kh/kv,if known,could be used as a tuning parameter during the history matching process in a more grid refined model with a higher vertical-direction resolution. However, if the ratio is unknown,non-unique combinations of khand kvafter history matching could be expected.
This work only considers the major longitudinal fracture along the flow direction.For a future study with a refined model,smaller fractures,such as submicrometer fractures,could be depicted with CT scans accompanied by the relatively large-scale fracture located with a 3D scanner. A more complex fracture network model with intersecting fractures could be constructed to represent a more precisely fluid flow scenario in the pressure pulse-decay experiment.
4. Conclusions
Novelties provided in this work include (a) complex fracture geometry based on the real 3D scanning results were efficiently embedded into the existing computation domain using EDFM for flow calculation; (b) the pressure pulse decay experiment was performed on low-permeability fractured porous media with nonplanar fracture, subsequent history matching was successfully achieved for properties of both matrix and fracture; (c) possible viscosity and compressibility factor alternations due to nanopore confinement were applied for the matrix properties in the pressure pulse decay simulation work.Detailed conclusions are listed below.
(1) A workflow was developed to describe the corrugated fracture surface and integrate the fracture into the numerical model of simulating the pulse-decay experiment.
(2) History matching was performed to match the pressure curves in the pulse-decay experiment. Permeability of the matrix and fracture shows a difference of 4 orders of magnitude in the core investigated.
(3) Pressure curves in this current core do not present a typical characteristic of“double permeability”.A“hump”region,the typical characteristic of the fracture-matrix system, will be more identifiable by further reducing the matrix permeability.
(4) Nanopore confinement causes deviations of gas compressibility factor and viscosity. Gas viscosity is reduced about three times in 2-nm pore compared with the bulk condition.
(5) For matrix-only cores, permeability determined from the pulse-decay experiment strictly follows Darcy's law that changes proportionally as the fluid viscosity changes. However, in the fracture-matrix system, flow in the fracture and matrix interact with each other.Implications from the pulsedecay experiment on the fractured core reveal that,the direct reduction of gas viscosity due to the nanopore confinement may not have a straightforward impact on the flow behavior in the fractured shale reservoirs.
Acknowledgments
This work is supported by the Science Foundation of China University of Petroleum, Beijing (No.00000), the Strategic Cooperation Technology Projects of CNPC and CUPB (ZLZX2020-01), and CNPC Science and Technology Major Project (2021ZZ10-02). The software packages from SimTech and Computer Modelling Group Ltd. are appreciated.
杂志排行

Petroleum Science的其它文章
- A fast space-time-domain Gaussian beam migration approach using the dominant frequency approximation
- Predicting gas-bearing distribution using DNN based on multicomponent seismic data: Quality evaluation using structural and fracture factors
- Reflection-based traveltime and waveform inversion with secondorder optimization
- Determination of dynamic capillary effect on two-phase flow in porous media: A perspective from various methods
- Settling behavior of spherical particles in eccentric annulus filled with viscous inelastic fluid
- Laboratory investigation on hydraulic fracture propagation in sandstone-mudstone-shale layers