Investigation on microscopic invasion characteristics and retention mechanism of fracturing fluid in fractured porous media
2022-09-23QiAnDaChuanJinYaoXueZhangXiaoPuWangXiaoHuanQuGuangLunLei
Qi-An Da , Chuan-Jin Yao ,c,**, Xue Zhang , Xiao-Pu Wang ,c, Xiao-Huan Qu ,Guang-Lun Lei ,c,*
a Key Laboratory of Unconventional Oil & Gas Development (China University of Petroleum (East China)), Ministry of Education, Qingdao, 266580,Shandong, People’s Republic of China
b School of Petroleum Engineering, China University of Petroleum (East China), Qingdao, 266580, Shandong, People’s Republic of China
c Shandong Key Laboratory of Oilfield Chemistry, China University of Petroleum (East China), Qingdao, 266580, Shandong, People’s Republic of China
Keywords:Microfluidic experiment Reservoir damage Fracturing fluid Fracture-matrix zone Retention mechanism
ABSTRACT Reservoir damage caused by guar gum fracturing fluid and slick water seriously affects the subsequent oil and gas production. However,the invasion characteristics and retention mechanisms of fracturing fluids in the fracture-matrix zone are still unclear. In this work, a microscopic model reflecting the characteristics of the fracture-matrix zone was designed. Based on the microfluidic experimental method, the process of fracturing fluid invasion,flowback and retention in the fracture-matrix zone was investigated visually and characterized quantitatively.The factors and mechanisms affecting fracturing fluid retention in the fracture-matrix zone were analyzed and clarified. The results indicated that in the invasion process,the frontal swept range of slick water was larger than that of the guar gum fracturing fluid,and the oil displacement efficiency and damage rate were lower than those of the guar gum fracturing fluid under the same invasion pressure.With the increase in invasion pressure,the damage rate of slick water increased from 61.09% to 82.77%, and that of the guar gum fracturing fluid decreased from 93.45% to 83.36%. Before subsequent oil production, the invaded fracturing fluid was mainly concentrated in the medium-high permeability area of the fracture-matrix zone. The main resistance of slick water was capillary force,while that of the guar fracturing fluid was mainly viscous resistance. The fracturing fluid retention was most serious in the low permeability region and the region near the end of the fracture.The experimental and numerical simulation results showed that increasing the production pressure difference could improve the velocity field distribution of the fracture-matrix zone,increase the flowback swept range and finally reduce the retention rate of the fracture fluid.The retention mechanisms of slick water in the fracture-matrix zone include emulsion retention and flow field retention,while those of the guar gum fracturing fluid include viscous retention and flow field retention.Emulsion retention is caused by capillary force and flow interception effect. Viscous retention is caused by the viscous resistance of polymer, while flow-field retention is caused by uneven distribution of flowback velocity.
1. Introduction
With the development of national economy and the increase in external dependence on energy, unconventional reservoirs have become an important growth point of oil and gas production in China (C. Wang et al., 2017; Yao et al., 2020). However, unconventional reservoirs with small pore throat, poor connectivity, low porosity and low permeability are extremely difficult to develop by conventional water injection (Cai et al., 2021; Sie and Nguyen,2021; Soori et al., 2019; Tian et al., 2020; Xu et al., 2019). The application of hydraulic fracturing technology effectively solves this problem by creating fractures with high conductivity to improve the drainage area of unconventional reservoirs. Volume fracturing technology, which is widely used during the shale oil and gas revolution in North America, has broken through the oil increase boundary of traditional hydraulic fracturing. By crushing the reservoir, large-scale and deep fracture network is formed to expand the contact area between fractures and reservoirs, thus greatly increasing well production(Hu et al.,2017;Song et al.,2018;S. Wang et al., 2017; Zhang et al., 2021). However, large-scale fracture networks provide greater access to oil and gas production while also making it easier for fracturing fluids to enter the reservoir. Current research indicates that under the pressure difference and internal imbibition, fracturing fluid will invade deep reservoirs through the fracture-matrix zone, and if it fails to effectively flow back in time,it will cause reservoir damage(Barati and Liang, 2014; Dai et al., 2018; Kang et al., 2016; Xu et al., 2016;Zhou et al., 2016). The type of reservoir damage caused by fracturing fluid depends on the type of fracturing fluid, reservoir mineral composition and pore throat structure. More than 90% of the fracturing fluids in use are water-based fracturing fluids,among which guar gum fracturing fluids(GG)and slick water(SW)are the most commonly used in unconventional reservoirs (Chitrala et al.,2013; Dongyan et al., 2015). Natural polysaccharide hydroxypropyl guar gum is added into guar gum fracturing fluid as thickener to enhance the ability to carry proppant. However, high viscosity will reduce its flowback efficiency and cause reservoir damage by retaining in the fracture-matrix zone. Only a small amount of polymer(polyacrylamide,hydroxypropyl guar gum,etc.)is added in the slick water as resistance reducer, which can effectively avoid reservoir damage caused by polymer. However, the water phase in slick water is easily trapped by small pores in unconventional reservoirs and clay minerals, thereby reducing the relative permeability of oil phase and eventually causing reservoir damage.
Research on reservoir damage caused by fracturing fluid mainly focuses on matrix,fracture and the effect to subsequent production(Bose et al., 2015; Ma et al., 2017). Some studies showed that the polymer added to the fracturing fluid and generated after gel breaking would be captured and retained by small pores, and the higher the polymer concentration, the more serious the damage(Huang et al., 2020). The research on hydraulic fractures showed that both slick water and guar gum fracturing fluid could cause obvious damage to the conductivity of artificial fractures and natural fractures in reservoirs(Dehghanpour et al.,2013;Singh,2016).The damage degree is positively correlated with the polymer concentration, and negatively correlated with the fracture height and the particle size of proppant. In addition, some researchers reported many methods to reduce the water damage caused by fracturing fluid.Some studies showed that intermittent shut-in and pressurized production measures could intensify the flowback of the water phase near the fracture (Liang et al., 2017). Secondly,higher production pressure difference can also strengthen the flowback effectiveness to a certain extent. In addition, recent research showed that the use of surfactants could reduce the capillary retention of the fracturing fluid, thereby reducing the water phase damage in the fracture-matrix zone (Kim et al., 2016;Tangirala and Sheng, 2019).
According to the current research progress, it is not difficult to find that the current research methods for fracturing fluid damage in the matrix-fracture zone mainly focus on core scale experiment,while the physical model is limited to matrix core or core with artificial fractures,and the research on pore scale is less. Secondly,indirect characterization is usually used to study the characteristics of different fracturing fluid invasion and flowback retention, but there are few visualization and quantitative characterization methods.Therefore,the invasion and retention characteristics and mechanism of water-based fracturing fluids in the matrix-fracture zone of fractured porous media need to be systematically studied by adopting new research methods and physical models.
In order to facilitate the experimental investigation and realize the observation of the invasion and retention process of fracturing fluid in the matrix-fracture zone on the pore scale, microfluidic method was adopted in this study. This approach involves laser or chemical etching of a specific porous media network onto a transparent silicate substrate, followed by precise control of the injected fluid, such as fracturing fluid invasion and flowback pressure differences and flow rate, with the help of high-precision injection pump and custom-made pressure sensor. In addition, the experimental process can be directly observed by the digital microscope to avoid the error caused by indirect characterization.The application of this technique in the field of petroleum engineering greatly facilitates the study of the migration mechanism of multiphase fluid at pore scale (Buchgraber et al., 2012a, 2012b; Cottin et al., 2010; Hammond and Unsal, 2012; Hasham et al., 2018;Song and Kovscek, 2016; Telmadarreie and Trivedi, 2017;Tsakiroglou et al., 2007;Xu et al., 2017; Yoon et al.,2019).
In this work, a microfluidic model reflecting the characteristics of the fracture-matrix zone was designed and prepared, and guar gum fracturing fluid (GG) and slick water (SW) commonly used in oilfields were selected as the invading fracturing fluid. The swept range of invasion frontal edge, oil displacement efficiency and distribution characteristics in different regions of the fracturing fluid under different conditions were studied, and its quantitative characterization was realized. In addition, the distribution of the fracturing fluid under different oil production conditions was studied, and the influencing factors and mechanisms of fracturing fluid retention in the fracture-matrix zone were analyzed and clarified. This work provides an important theoretical and experimental basis for further work to remove reservoir damage induced by hydraulic fracturing.
2. Experimental
2.1. Materials
The materials used in this experiment include oil phase, water phase and dyeing agent. The oil phase used is degassed crude oil from Shengli Oilfield, Shandong, China, which is from an area of a low permeability reservoir. Its dynamic viscosity and specific gravity are 13.56 mPa s and 0.76 respectively at 50°C. Guar gum fracturing fluid and slick water were selected as the water phase,and their formula and kinetic parameters are shown in Table 1.Hydroxypropyl guar gum (HGG) was chosen as thickener for guar gum fracturing fluid and resistance reducer for slick water.Oil red O and methylene blue were used to dye the oil phase and water phase, respectively, for the convenience of observation and statistical data. The above chemical reagents except crude oil were purchased from Sinopharm Chemical Reagent Co., LTD., and were all analytically pure.
2.2. Design and preparation of micromodel
Based on the typical characteristics of the fracture-matrix zone in horizontal wells, a micro-model was designed. The design process is shown in Fig.1,and the etching region is shown in Fig.1a-c,which is composed of a fracture region and a matrix region. The matrix is distributed on both sides of the etching area of the micromodel with the fracture as the central axis, and each side of the matrix is divided into two parts: medium-high permeability zone and low permeability zone. This design can reflect that the density of the fracture network,the conductivity and permeability decrease gradually from the fracture to the matrix zone. The complete micromodel chip is shown in Fig.1d.The particle sizes of the matrix are 200, 100, and 50 μm from large to small, and the corresponding pore throat diameters are 125, 80, and 70 μm,respectively. The porosity of the matrix region is 52.44%. In the micromodel, the fracture width is 500 μm, the length is 8000 μm,and the etching depth of the matrix and fracture regions is 30 μm.The preparation and assembly of micromodels combine standard lithography techniques,wet etching techniques,plasma techniques and vacuum bonding techniques,and the detailed process has been reported in previous research (Salehpour et al., 2021).The initial wettability of the micromodel is water-wet.In fact,in conventional sandstone, tight sandstone, and shale reservoirs, hydraulic fracturing fractures are mainly formed through water-wet inorganic matrix due to its higher brittleness than oil-wet matrix.Subsequent experiments showed that the pores inside the matrix porous media were oil-wet due to oil aging,which was consistent with the actual reservoir conditions.
2.3. Experimental setup and procedures
The schematic of the equipment used for micromodel displacement experiments is shown in Fig.2,which is composed of a fluid injection system, a micromodel holder system, a data acquisition system, and a back pressure control system. The fluid injection system includes a high-precision injection pump(VP-12X,Vindum Engineering, Inc., Lodi, CA), two piston-type containers with heating function(UWG-70-200,Unipac tech.co.,Ltd.,Jiangsu,China)and a rotary vane vacuum pump(2XZ-4,Naxi Tech.Co.,Ltd.,Jiangsu, China). The holder system includes a heat-resistant and pressure-resistant micromodel holder (U-KSY-2, Unipac Tech. Co.,Ltd.,Jiangsu,China),a confining pressure pump,and the upper part of the holder is equipped with a viewing window, as shown in Fig.2.The data acquisition system includes a computer and a highdefinition video microscope (HG-918, Unipac Tech. Co., Ltd.,Jiangsu, China), with a digital magnification of 122.8 times, which can capture 4k 60FPS video. The back pressure control system(UPUMP-100S, Unipac Tech. Co., Ltd., Jiangsu, China) is used to control the outlet pressure of the micromodel to ensure that the injection process is carried out under a certain pressure difference,including a back pressure pump and a buffer piston container.
In order to eliminate the interference of insoluble particles to the observation results in the subsequent experiment,the oil phase and water phase were filtered by a vacuum filtration device and a filter membrane with a pore size of 0.8 μm before experiment. In the experiment, the micromodel and the inner chamber of the holder were vacuumed for 2 h at the same time, then water was injected into the inner chamber of the holder until the confining pressure reached 5 MPa,and the heating temperature was set at 50°C to simulate reservoir conditions.The dyed crude oil was injected into the micromodel by the injection pump until the micromodel was completely saturated with the oil phase, and the fracturing fluid invasion process began after the crude oil was aged in the micromodel for 24 h. According to the different experimental conditions,the Vindum high-precision injection pump was used to inject 5 PV of guar gum fracturing fluid and slick water into the micromodel with different pressure differences(0.1,0.25,0.5 MPa)from the inlet 1 of the micromodel. The injection volume was controlled by the internal flow sensor of the high-precision injection pump. After the fracturing fluid invasion process, in order tostudy the effect of subsequent oil production on recovery of fracturing fluid damage, different oil production pressure (0.1, 0.25,0.5 MPa) was set, and the oil injection volume was 5 PV. The processes of the fracturing fluid invasion and the oil production were observed and recorded by the video microscope. After each experiment, the micromodel was cleaned by alternately injecting more than 100 PV of ultra-pure water and petroleum ether into the micromodel until no obvious residues were observed. After that,the micromodel was re-saturated with crude oil and aged for 24 h for the next experiment. Images obtained in the experiment were analyzed by ImageJ, which is an open source software.

Table 1 Main composition and dynamic parameters of hydraulic fracturing fluid system.
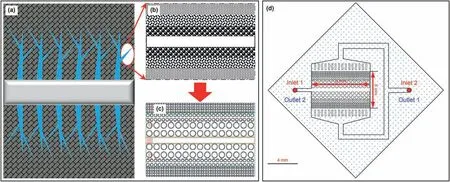
Fig.1. The process of extracting typical features from actual fractured reservoirs to form micromodels.In Fig.1c,regions I,II and III represent low permeability zone,medium-high permeability zone and fracture zone of finite length, respectively. In Fig.1d, inlet 1 and outlet 1 were selected for simulating the fracturing fluid invasion process,and inlet 2 and outlet 2 were selected for simulating the subsequent crude oil production process.
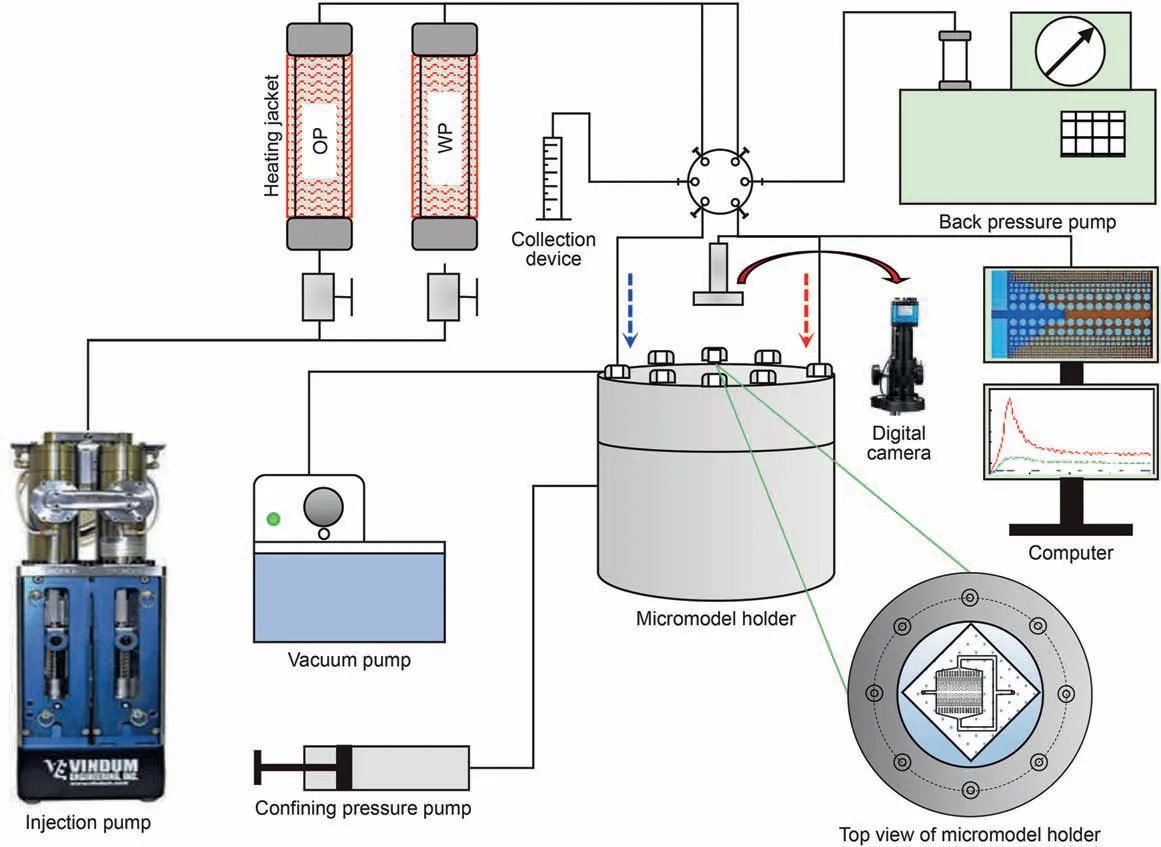
Fig. 2. The equipment used for micromodel displacement experiments. OP in a piston vessel refers to the oil phase and WP refers to the water phase (fracturing fluid). The blue dotted arrow indicates the injection direction in the fracturing fluid invasion stage, and the red dotted arrow indicates the oil phase injection direction in the simulated oil production stage.
3. Results and discussion
3.1. Invasion characteristics of two fracturing fluids in the micromodel
3.1.1. Evolution of the swept range of the frontal edge during invasion process
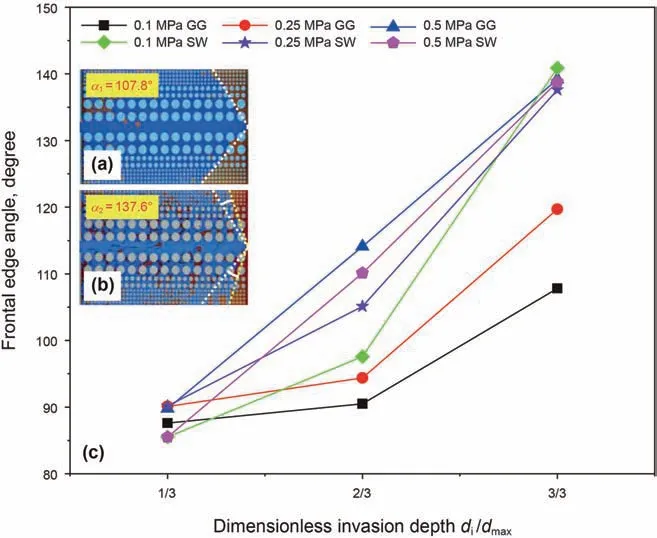
Fig. 3. The frontal edge angle changes with the dimensionless invasion depth under different conditions. di/dmax represents the ratio of the actual invasion depth to the total fracture depth.
The frontal edge angle can reflect the velocity difference in different permeability zones, so it was used to compare the swept range of the frontal edge in invasion processes. It was observed in the experiment that with the same fracture invasion depth, the larger the swept range of the frontal edge was,the larger the frontal edge angle was(Fig.3a and b).The frontal edge angle in the process of fracturing fluid invasion was defined as α, and the size of the frontal edge angle when the fracturing fluid reached the same fracture invasion depth under different conditions is shown in Fig.3c.It can be seen that when the invasion depth was 1/3 of the fracture length, the frontal edge angle of all experimental groups was about 90°, which was caused by the fact that the fracturing fluid flow was not fully developed and the model has axial symmetry.In the process of guar gum fracturing fluid invading into the end of the fracture,the final frontal edge angle at the 0.5,0.25 and 0.1 MPa was 138.2°,119.7°,and 107.8°,respectively,indicating that the swept range of the guar gum fracturing fluid decreased with the decrease in the invasion pressure. For slick water, the frontal edge angles were basically the same under different pressures.When the slick water reached the end of the fracture, the final angles were 138.8°, 137.6°, and 140.9°, respectively, at 0.5, 0.25 and 0.1 MPa,indicating that the invasion pressure had little influence on the swept range of the slick water.In addition,under the same invasion pressure,the final swept range of slick water was always larger than that of the guar gum fracturing fluid. According to the above experimental results,the invasion pressure had a greater influence on the invasion swept range of the guar gum fracturing fluid.With the increase in the invasion pressure,the velocity difference of the guar gum fracturing fluid in different permeability zones decreased and the swept range of the frontal edge increased.However,due to the lower viscosity, the slick water had less flow resistance after entering the fracture, and the pressure had little influence on its flow. The velocity difference in different permeability region was small, resulting in the slick water had a larger frontal edge swept range than guar gum fracturing fluid under the same conditions.
Furthermore, differences between frontal edge angle curves at different invasion pressures can be observed from Fig.3.When the invasion pressure difference is 0.5 MPa, the relationship between the frontal edge angle and the intrusion depth is approximately linear, while the invasion pressure difference is 0.1 and 0.25 MPa,showing a nonlinear change,which is caused by the different forces of the fracturing fluid in different invasion depth intervals. According to Stoke's law,objects in the viscous fluid with low velocity flow(Reynolds number is less than 0.1)will be affected by viscous resistance, and the magnitude of viscous resistance is positively correlated with the viscosity of the fluid and the velocity within the low velocity range. The invasion process of the fracturing fluid conforms to this law. Therefore, the dynamic equation of the fracturing fluid in the invasion process is shown in Eq. (1):
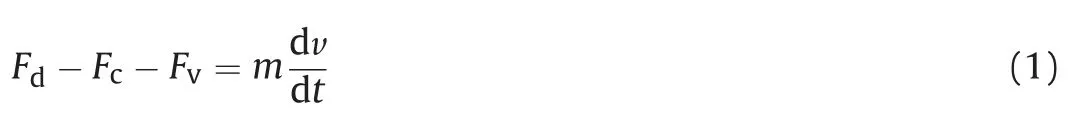
where Fdis the driving force in the invasion process, N; Fcis the capillary resistance of the fracturing fluid in the oil-wet reservoir,N; Fvis the viscous resistance of the fracturing fluid in low-speed invasion, N; v is the flow velocity, m s-1; m is the fluid mass, g;dv/dt is the acceleration, m∙s-2.
When the invasion pressure difference was 0.5 MPa,the driving force (Fd) of the two fracturing fluids was much greater than the capillary resistance (Fc) and viscous resistance (Fv), and the fracturing fluid had a large velocity before reaching 1/3 of the depth of the fracture,thus weakening the influence of the viscous resistance(Fv). In this case, the acceleration (dv/dt) of the fracturing fluid at different invasion depths was basically the same, which made the velocity difference in different regions decrease uniformly with the increase in invasion depth. Therefore, the frontal edge angle increments between 1/3 and 3/3 were basically the same, and the corresponding data points show an approximately linear change.When the invasion pressure difference was less than 0.5 MPa, the driving force decreased, so as the acceleration (dv/dt) of the two fracturing fluids.When the invasion depth was less than 2/3 of the fracture length, the fracturing fluid in the low permeability area was affected by both viscous resistance(Fv)and capillary resistance(Fc), and the velocity increased slowly, which made the velocity difference in different permeability areas decrease slowly, so the increment of frontal edge angle between 1/3 and 2/3 of the fracture length was small. In addition, the high viscosity guar gum fracturing fluid was more affected by the viscous resistance(Fv),so the guar gum fracturing fluid at 0.1 MPa had the smallest increment on the frontal edge angle.When the invasion depth was between 2/3 and 3/3 of the fracture length,the velocity of the fracturing fluid in the low permeability area increased, and the influence of the viscous resistance (Fv) weakened. Then, the velocity difference decreased rapidly, and the increment of the frontal edge angle between 2/3 and 3/3 of the fracture length increased, which resulted in the nonlinear relationship of frontal edge angle with the invasion depth under 0.1 and 0.25 MPa.
3.1.2. Displacement efficiency of frontal edge during invasion process
In addition to the swept range,the oil displacement efficiency of frontal edge also affects the damage rate during fracturing fluid invasion. Because of the complexity of the frontal edge, fractal dimension is used to quantitatively describe the geometric characteristics of the invasion frontal edge of the fracturing fluid. At present, there are many methods of measuring the fractal dimension of the irregular two-dimensional frontal edge. Among them,the box-counting method is widely used to study the characterization of two-dimensional irregular fronts in the displacement process. Therefore, the box-counting method was selected in this paper.The principle is to use a certain number of squares with side length εrto cover the bounded set S in Euclidean space.The number of squares required is Nr,then the fractal dimension of the bounded set S can be defined as:
where εris the smallest pixel size of the graph, the function between log(Nr) and log(1/εr) can be obtained by the least square method using Nrand the corresponding εrin Eq.(2),and its slope is the fractal dimension DS.
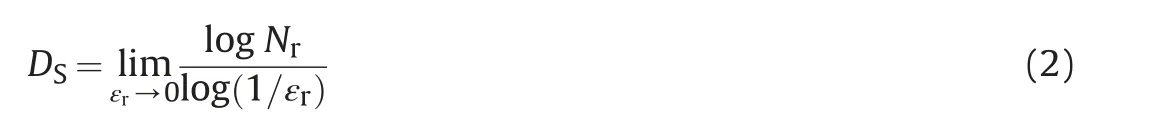
The frontal edge images of the two fracturing fluids with the same pixel size in the invasion process were respectively captured and binarization processing was carried out by imageJ through the process shown in Fig. 4. The principle of image binarization has been reported in previous study (Wang et al., 2021). After that,Fractal Dimension and Lacunarity plug-in were used to obtain the value of DS.The theoretical value range of the fractal dimension for two-dimensional Euclidean space is 1 ≤D ≤2. According to previous studies, the more stable the two-phase interface, the higher the displacement efficiency, and the corresponding fractal dimension was closer to the theoretical value 2 (Zhang and Liu, 1998).Therefore, the displacement efficiency E was defined based on the fractal dimension to quantitatively characterize the displacement efficiency of the two fracturing fluids in the swept area during the invasion process, as shown in Eq. (3).
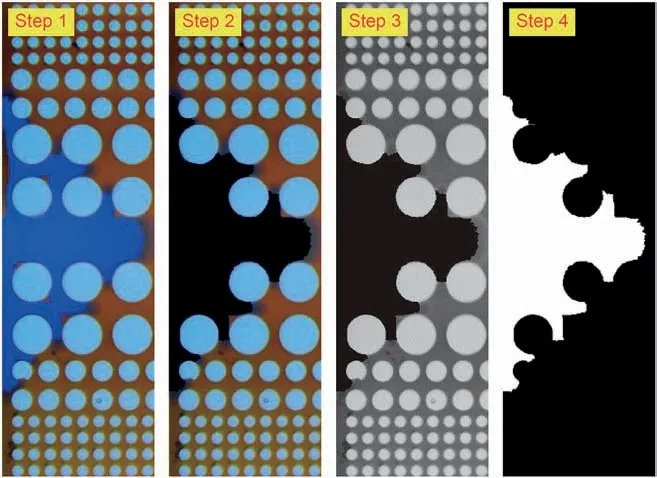
Fig. 4. The image processing flow before calculating the fractal dimension of the invasion frontal edge. Step 1: Intercept diagram of the two-phase frontal edge of a certain pixel size;Step 2:Strengthen the range of two-phase edge;Step 3:Convert the image to 8-bit image; Step 4: Binarize the 8-bit image.
where Dsis the fractal dimension obtained using the box counting method; Dmaxis the maximum fractal dimension of twodimensional Euclidean space, Dmax= 2.
The displacement efficiency E of two types of fracturing fluids in the swept region under different conditions is shown in Fig.5.The results showed that the guar gum fracturing fluid had a higher displacement efficiency than slick water under the same invasion pressure,which was caused by the different invasion pattern of two kinds of fracturing fluids. As shown in Fig. 6, the guar gum fracturing fluid with high viscosity was continuous phase in the invasion process,and its flow direction in the fracture-matrix zone was perpendicular to the frontal edge, presenting a linear piston displacement, so there was less remaining oil phase in the swept area.On the other hand,when the slick water with lower viscosity invaded into the fracture-matrix zone, it would form an emulsion because of shear force and flow in a discontinuous phase with random direction. So, there was more remaining oil phase in the swept area of slick water. For the same fracturing fluid, the displacement efficiency decreased with the increase in invasion pressure, which was caused by the flow instability after the increase in pressure. In addition, as the invasion depth increased,more fracturing fluid entered the fracture-matrix zone,resulting in the increase in displacement efficiency for both two kinds of fracturing fluids.
3.1.3. Damage rate of fracturing fluid after invasion process
Combined with the observation in the experimental process,when the fracturing fluid injection volume was 10 PV,the output oil production of the micro model could be ignored, and the invasion process can be considered to be completed. The damage rate was defined as D, which was determined by the ratio of the pore area occupied by the fracturing fluid to the total pore area,as shown in Eq.(4).The fracture fluid damage rate under different conditions is shown in Fig. 7.

Fig. 5. Displacement efficiency of guar gum fracturing fluid and slick water in the invasion process under different conditions.
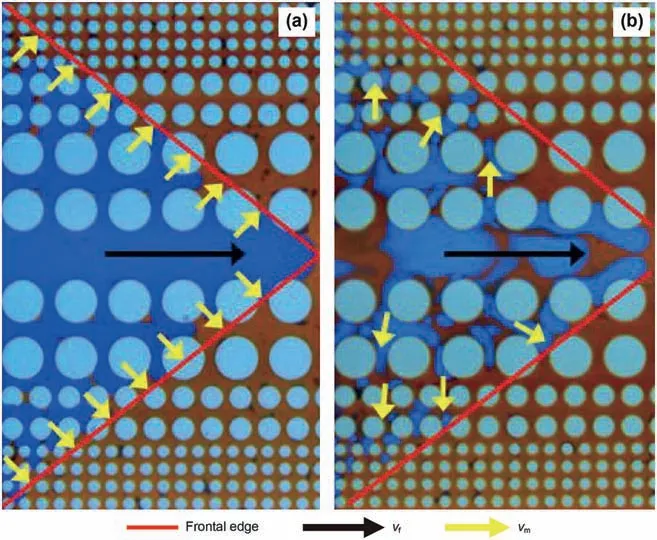
Fig.6. Different invasion patterns of the two fracturing fluids:(a)Guar gum fracturing fluid; (b) Slick water. vf is the velocity in the fracture, vm is the velocity in the matrix.
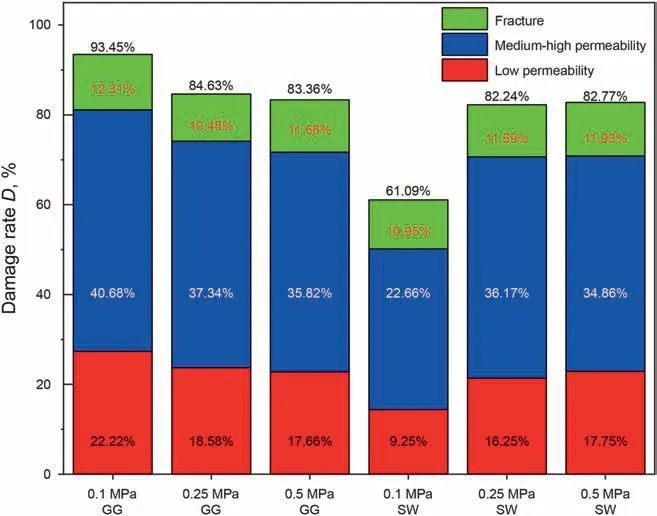
Fig.7. Damage rate of the two fracturing fluids in different zones after fracturing fluid invasion.

where D is the damage rate of the fracturing fluid after the invasion process;Swis the pore area occupied by the water-phase fracturing fluid; and Stis the total pore area.
Some results can be seen from Fig.7,firstly,with the increase in invasion pressure, the damage rate of slick water increased from 61.09%to 82.77%,indicating that higher pressure would strengthen the invasion ability of slick water, which could displace more oil phase in the medium and high permeability area and at the same time overcame capillary resistance to invade the low permeability area, which would further aggravate the damage in the fracturematrix zone. Secondly, the damage rate of the guar gum fracturing fluid decreased from 93.45% to 83.36% with the increase in invasion pressure,which was caused by the interface instability and the decrease in oil displacement efficiency in the swept area under higher pressure. Thirdly, the damage rate of the fracturing fluid in the medium-high permeability area was the highest in each group.The guar gum fracturing fluid had the highest damage rate,reaching 93.45%,at invasion pressure of 0.1 MPa.In addition,in all experimental groups, the damage rate of the guar gum fracturing fluid was always higher than that of slick water at the same pressure, and the difference decreased from 32.36% to 0.59% as the pressure increased.
3.2. Effects of subsequent oil production on fracturing fluid damage
3.2.1. Damage recovery rate of fracturing fluid under different
production conditions
In order to study the recovery effect of subsequent oil production process on the damage of the two fracturing fluids, the pressure difference between the reservoir and the matrix-fracture zone is defined as ΔP.The production process of the fracture-matrix zone was simulated under different ΔP.From the oil-inject inlet(inlet 2),the oil phase was injected at a certain pressure until the oil saturation remained unchanged. It could be considered that the fracturing fluid still remained in the micro-model was difficult to flow back through the oil production process. In order to facilitate comparative analysis, the damage recovery rate of the fracturing fluid after normalized treatment is defined, as shown in Eq. (5).
where RDis the normalized fracture fluid damage recovery rate,%;Sois the oil saturation after the production process; Soiis the oil saturation after the intrusion process.RDunder different conditions is shown in Fig. (8).
It can be seen from Fig.8 that RDincreased with the increase in ΔP for both two fracturing fluids.The average damage recovery rate of slick water at 0.1,0.25,and 0.5 MPa was 51.56%,which was higher than that of the guar gum fracturing fluid(34.37%).In addition,the damage recovery rate of slick water increased from 19.18% to 82.98% when ΔP increased from 0.1 to 0.5 MPa, while the damage recovery rate of the guar gum fracturing fluid only increased from 25.72% to 39.07%, indicating that the increase in the pressure difference between the reservoir and the matrix-fracture zone had a more significant effect on reducing the damage caused by slick water.
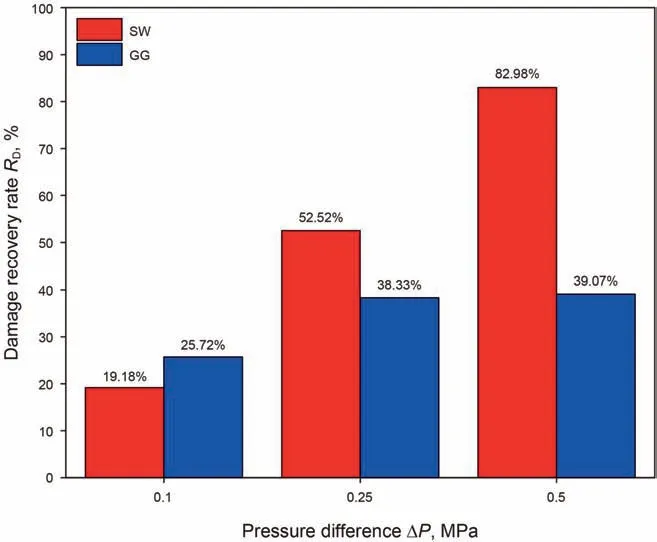
Fig. 8. Damage recovery rates of GG and SW under different ΔP.
The reason for the above results is that the two fracturing fluids have different main resistances when they flow back out of the matrix-fracture zone. The main resistance of slick water in the flowback process is capillary force. When ΔP is less than the average capillary resistance, the flowback volume of slick water is very small. Conversely, when ΔP is high enough to overcome the capillary resistance,the slick water will be easy to flowback due to its low viscosity.In addition,it was observed in the experiment that slick water basically did not change the wettability of the porous media particle surface,that was,it still maintained the oil-wet after being saturated with oil,which made the surface of most particles in porous media have a thin oil film (Fig. 9a), which will further reduce the flowback resistance of slick water, and reduce the reservoir damage caused by invasion to a greater extent. The guar gum fracturing fluid had a higher viscosity than slick water, and was more affected by the viscous resistance during the flowback process.At the same time,a considerable amount of guar gum was adsorbed on the surface of particles in porous media (Fig. 9b),which made the oil is more difficult to wash and peel it off.Therefore, the recovery rate of the guar gum fracturing fluid was lower.
3.2.2. Distribution and retention characteristics of fracturing fluid after production process
Fig.10 shows the final retention and distribution of slick water and guar gum fracturing fluid in the micromodel under different ΔP.The retention volume in regions with different permeability and fracture depth was calculated,and the retention ratio is defined as ηr, as shown in Eq. (6).
where Sfis the area occupied by the fracturing fluid; Siis the total pore area of the corresponding region.
Fig.11 shows the retention ratio of the two fracturing fluids in zones with different permeability. For the low permeability zone,with the increase in ΔP, the retention ratio of slick water decreased from 58.65% to 28.67%, while the retention ratio of guar gum fracturing fluid was 31.77%,corresponding to ΔP of 0.25 MPa.In addition,except for the experimental group of guar fracturing fluid at 0.25 MPa, the retention ratio in the low permeability area of the other experimental groups was the largest. Secondly, in the medium-high permeability zones and fracture zones, the retention ratio of the two fracturing fluids decreased with the increase in ΔP.For slick water,the retention ratio in the medium-high permeability zones decreased by 22.13%, and the retention ratio of fracture zone decreased by 29.86%. The flowback capacity of the guar fracturing fluid in these zones was lower than that of the slick water,which was 15.68% and 17.2%, respectively. The above results showed that the flowback capacity of different permeability regions in the fracturematrix zone was different. In most cases, the increase in ΔP was beneficial to reduce retention ratio of the fracturing fluid in all zones.For the guar gum fracturing fluid, when ΔP was too high, lowviscosity oil would easily form fingering in the low permeability area,and quickly enter the medium-high permeability and fracture areas to form preferential passage,which would reduce the flowback efficiency in the low permeability area.In addition,it is worth noting that Fig. 7 shows that the fracturing fluid damage rate in the low permeability area accounts for a low proportion of the total damage rate, but the above experimental results show that the low permeability area was affected mostly by the fracturing fluid retention damage after a long period of oil production.Therefore,in the field production process,ΔP should be adjusted by appropriately adjusting the production pressure difference to achieve the effect of reducing the fracturing fluid retention rate.
Taking the entrance of the fracture as the origin and the end as the endpoint,the micromodel was divided into three regions with different depths.Fig.12 shows the retention rate of fracturing fluid at different depths.The results show that the retention rate of the fracturing fluid increased with the increase in the depth,that was,the closer to the fracture end, the greater the retention rate of the fracturing fluid. The retention rate of slick water increased by 18.93%on average,while the retention rate of guar gum fracturing fluid increased by 28.41%on average.In addition,with the increase in ΔP,the retention rate of the fracturing fluid decreased more near the fracture entrance, and retention rate of slick water decreased more rapidly than that of the guar gum fracturing fluid. With the increase in ΔP, the retention rates of slick water in the front 1/3,middle 1/3 and end 1/3 of fractures decreased by 28.86%, 29.06%and 16.72%,respectively,while the retention rates of the guar gum fracturing fluids were 19.03%, 22.75% and 9.41%, respectively. The above results show that the flowback capacity of the fracturing fluid at different fracture depths in the fracture-matrix zone is different. Under the same ΔP,the fracturing fluid remaining closer to the fracture entrance is easier to flow back. In addition, the increase in ΔP could strengthen the flowback of the fracturing fluid at the end of the fracture to a certain extent.
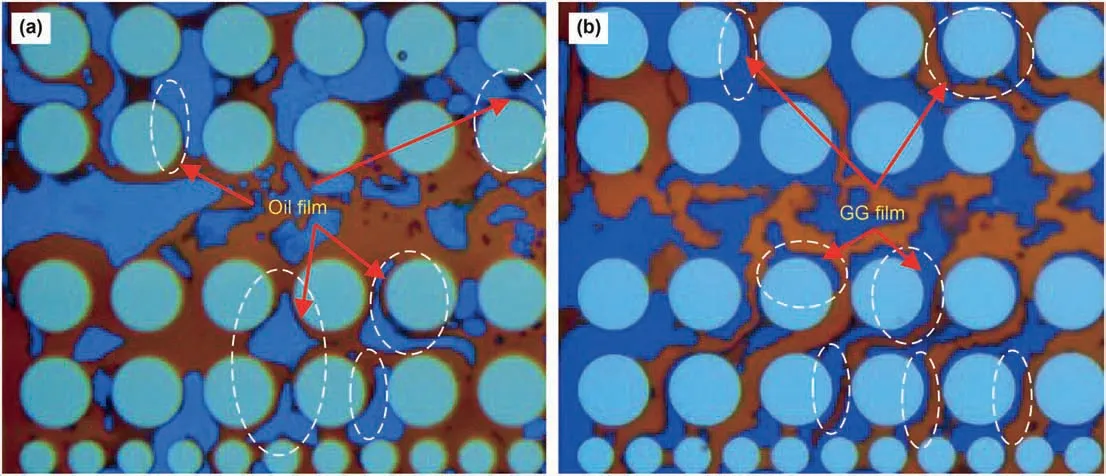
Fig. 9. The adhesion state of the two fracturing fluids on the surface of particles in porous media: (a)Slick water with oil film on the surface of particles; (b) Guar gum fracturing fluid with guar gum attached to the surface of particles.
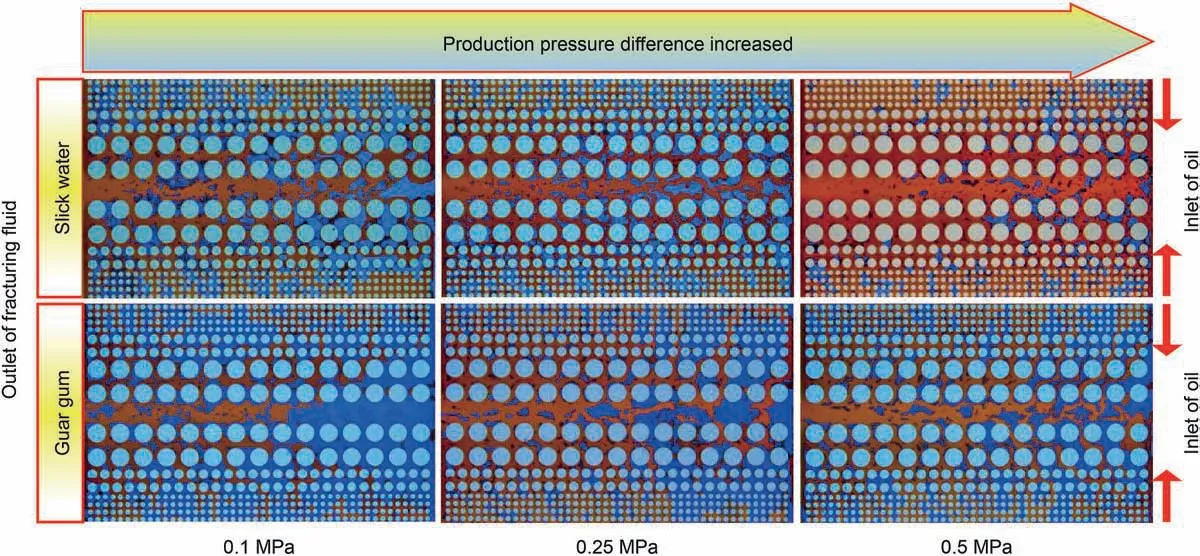
Fig.10. The distribution and retention of fracturing fluid at different ΔP after production.
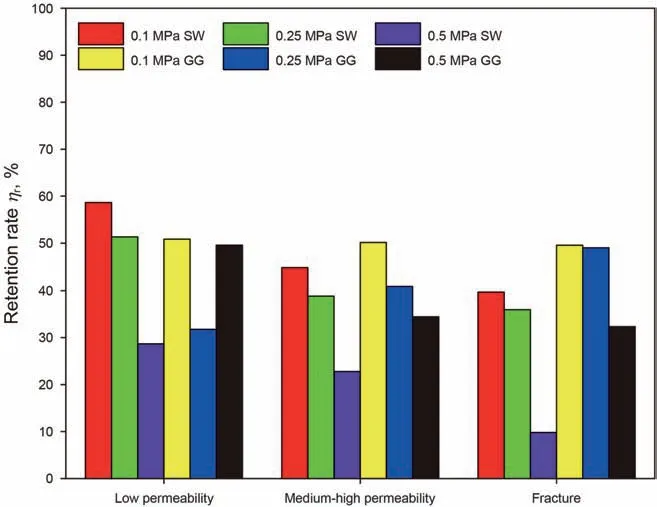
Fig.11. Fracturing fluid retention rate in zones with different permeability.
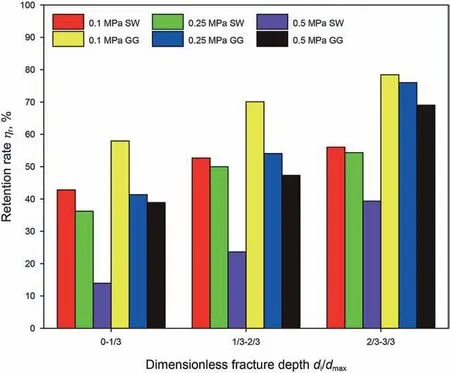
Fig.12. Fracturing fluid retention rate in zones with different dimensionless fracture depths.
Fig. 13 shows a comparison between the micromodel after production and the multiphase flow simulation results in porous media,all parameters in the numerical simulation were the same as those in the guar gum fracturing fluid experiment. The velocity distribution field in porous media was obtained by solving the N-S equation of the geometric structure in the micromodel using Comsol. Taking the results at 0.25 MPa as an example, it could be seen that the formation damage caused by fracturing fluid retention after production was most common at the end of fracture and low permeability zones with low flow rate(Fig.13,I II,III),and the greater the effective flow rate, the lower the fracturing fluid retention rate (Fig. 13, IV). Through comparison of numerical simulation models, it shows that the reason for the increase in fracturing fluid flowback rate with the increase of ΔP is that the swept area of flowback in the micromodel become larger,and more retained fracturing fluid can flow back effectively.
3.3. The retention mechanism of fracturing fluid in matrix-fracture zone
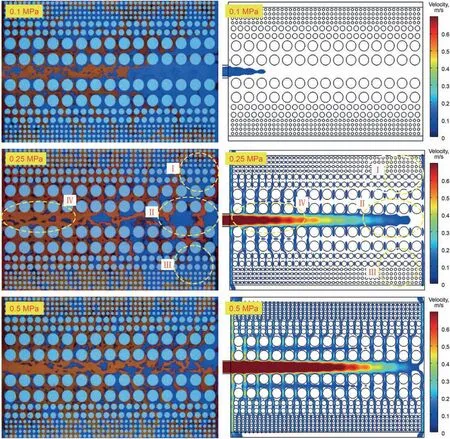
Fig.13. The retention of guar gum fracturing fluid in the micromodel and the numerical simulation velocity distribution field under corresponding conditions. The velocity below 0.07 m/s is not displayed in the numerical simulation.
Through the analysis of the distribution morphology and characteristics of fracturing fluid remained in the porous media,we find that the guar gum fracturing fluid and slick water have three retention mechanisms, namely emulsion retention, viscous retention and flow field retention, respectively. According to the experimental observation, due to the lower viscosity of slick water, the velocity is higher in its invasion process,and it is easier to form oilin-water emulsion after mixing with the oil phase in the porous media.Therefore,the emulsion retention mainly occurs in the slick water invasion. Similarly, viscous retention mainly occurs during the invasion of the guar fracturing fluid with higher viscosity,while flow field retention occurs in both two types of fracturing fluids.The following images are not scaled,and the particle size ratios are the same as in the actual micromodel.
3.3.1. Damage mechanism of emulsion retention
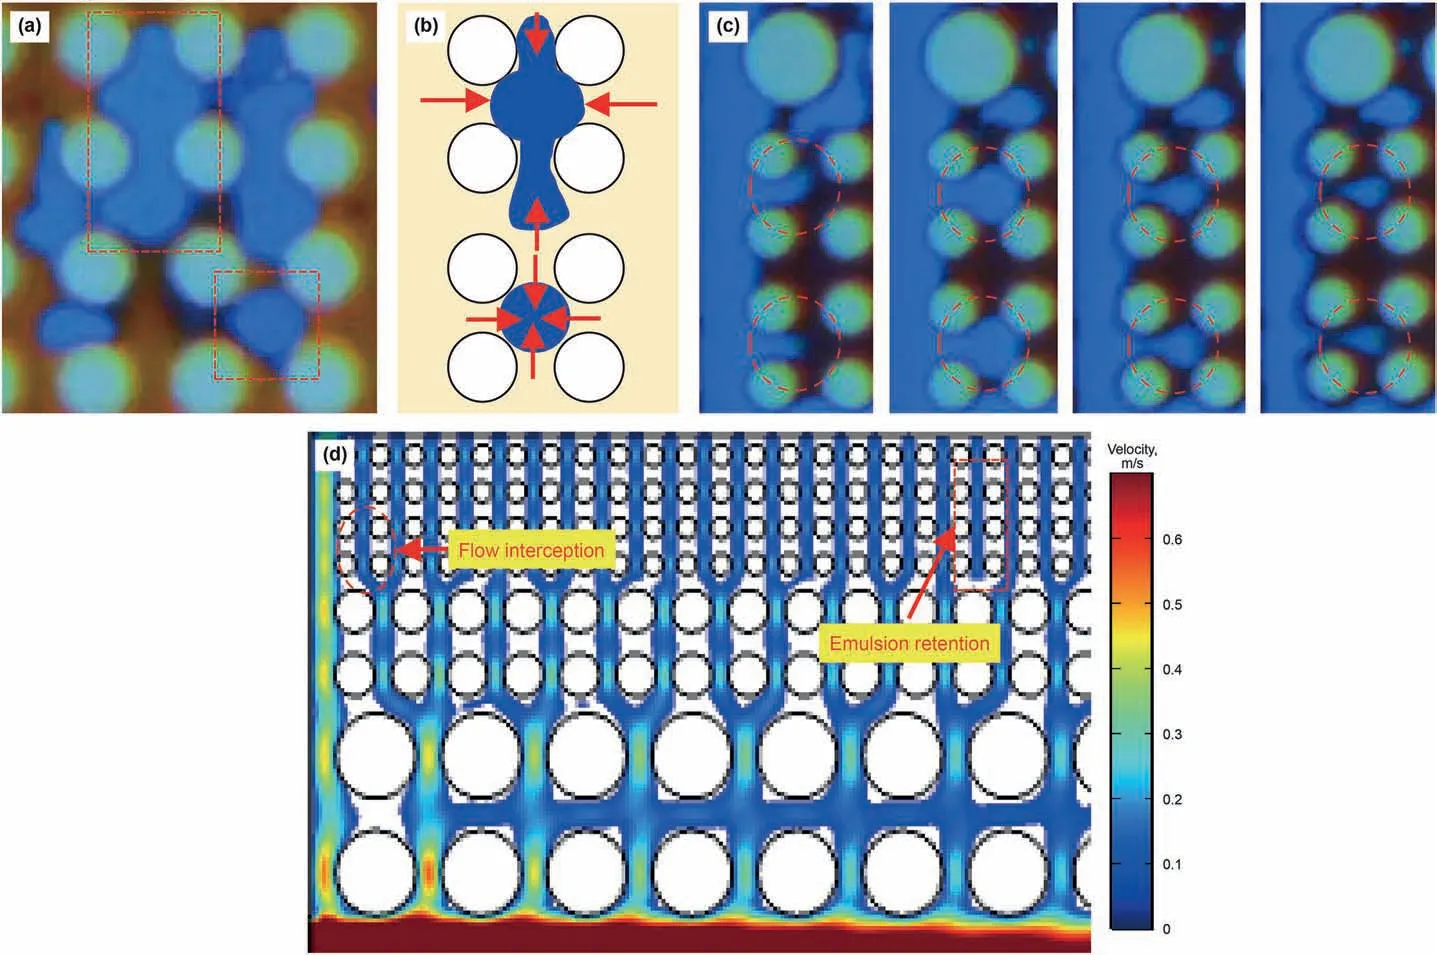
Fig.14. Mechanism of emulsion retention in slick water:(a)Droplet retention and slug retention;(b)Force analysis,red arrow represents capillary force;(c)Emulsion retention due to flow interception effect; (d) The position of emulsion retention in the flowback velocity distribution.
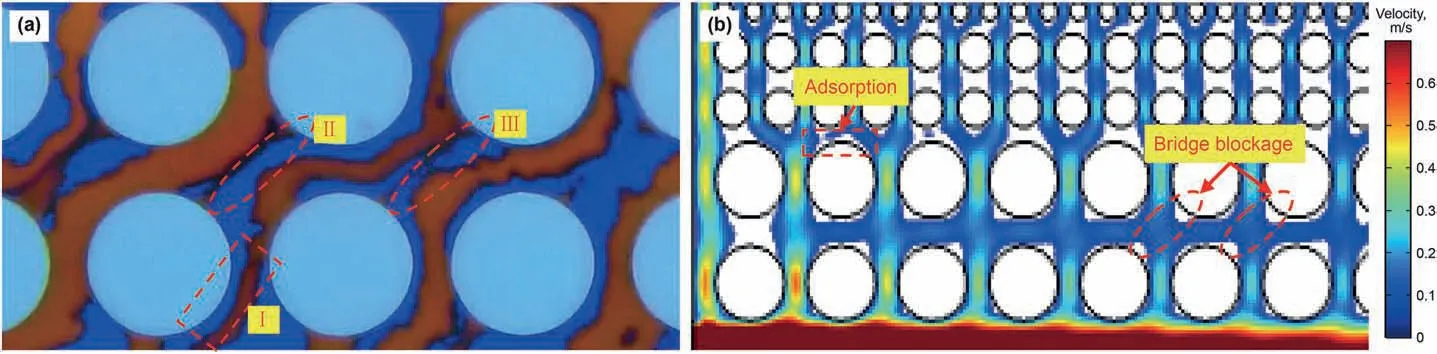
Fig.15. Bridge blockage and adsorption retention of guar gum fracturing fluid: (a)Viscous retention observed in experiments; (b) Distribution of viscous retention in the velocity field.
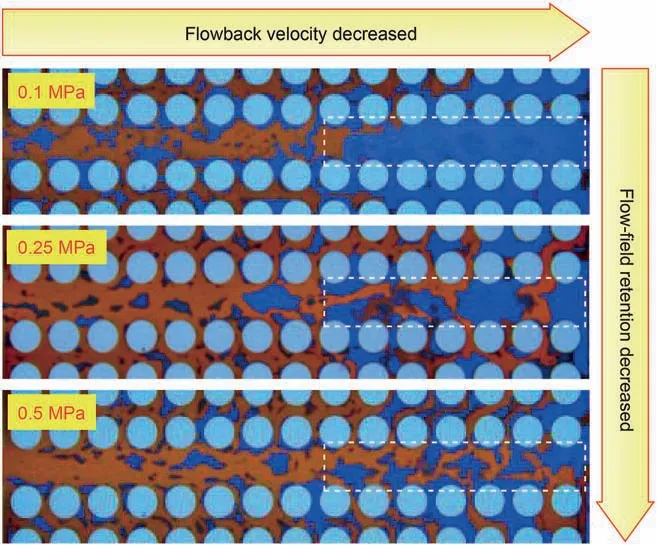
Fig. 16. The relationship between distribution of flowback velocity and flow-field retention of fracturing fluid.
Fig. 14a shows the water phase retention caused by capillary force in a typical oil-wet porous medium, which mostly occurs in low permeability zones.The slick water existed mainly in the form of drops and slugs. The force analysis and flowback velocity distribution are shown in Fig. 14b and d, respectively. It can be observed that when ΔP could not overcome the capillary force,the slick water will remain in the seepage channel surrounded by low flowback velocity area, which is the fundamental reason why this part of slick water remains in the low permeability zone.It is worth noting that the emulsion retention due to the flow interception mechanism was also observed, as shown in Fig.14c, which mainly occurred in the junction area between low permeability zone and the high permeability channel. Fig. 14d shows where it usually occurs. Under the high production pressure difference, part of the slick water entered the pores of the low permeability zone from the high permeability channel to balance with the capillary force in it.With the increase in the flow velocity and the thickening of the oil film on the surface of the porous medium in the low permeability zone, the connecting part of the slick water slug between the particles gradually became thinner,and finally broke.The broken part stayed in the pores in the form of drops. At the same time, due to the capillary force around it, this part of the slick water would be difficult to flow back.
3.3.2. Damage mechanism dominated by viscous resistance
Fig.15a shows the viscous retention of the guar gum fracturing fluid in the high permeability zone, and Fig.15b shows the distribution of viscous retention in the velocity field.It can be seen that there are two forms of viscous retention. The first kind is the adsorption of the guar fracturing fluid in the low velocity area near the particle surface (Fig. 15, I), which will reduce the size of the throat. The other kind is the bridge blockage formed between the adjacent particles (Fig.15, II, III). The bridge blockage is generally formed in the diagonal direction of the two particles,as can be seen from Fig.15b,the flowback velocity in this direction is slower,thus making stable adsorption of the polymer guar gum easier. The reduction in the oil phase flow area caused by adsorption will reduce the oil production under same pressure difference.Previous research showed that the adsorption in reservoir can be divided into chemical adsorption and physical adsorption. Hydroxypropyl guar gum is mainly physically adsorbed on the surface of reservoir particles by van der Waals force, and the adsorption effect was related to the type of reservoir minerals.Normally,montmorillonite and quartz minerals were more likely to be adsorbed(Selem et al.,2021).
3.3.3. Damage mechanism dominated by velocity distribution of flowback
The fracturing fluid retention formed by the flow rate distribution of flowback mainly exist at the end of the main fracture, as shown in Fig.16. The oil flow back along the dominant channel in the subsequent production process, so that the fracturing fluid in the low-velocity zone is hard to be displaced,and finally this part of fracturing fluid will remain in the fractures.
4. Conclusions
In this work, a microfluidic model reflecting the characteristics of fracture-matrix zone was designed and prepared, the invasion,flowback and retention processes of the guar gum and slick water fracturing fluids under different conditions were studied, and the following conclusions were obtained:
(1) The analysis of the frontal edge angle during the fracturing fluid invasion shows that the invasion pressure difference mainly affected the swept range of the frontal edge during the invasion process. With the increase in the invasion pressure difference, the difference of the invasion velocity between the guar gum fracturing fluid and slick water in different permeability regions decreased, and the swept range of the frontal edge increased.Under the same pressure difference and fracture invasion depth, the swept range of frontal edge of slick water was larger than that of the guar gum fracturing fluid.
(2) The analysis of the invasion frontal edge shows that the guar gum fracturing fluid presented linear piston invasion, while slick water presented emulsion random invasion due to its lower viscosity under shear force. As a result, the guar gum fracturing fluid always had a higher oil displacement efficiency than slick water in the range affected by the frontal edge under the same pressure difference.In addition,the oil displacement efficiency of both fracturing fluids increases with increasing invasion depth.
(3) The results of fracturing fluid distribution in the micromodel after the invasion process show that the invaded fracturing fluid was mainly concentrated in the medium-high permeability area of the fracture-matrix zone before the subsequent oil production.With the increase in invasion pressure difference, the damage rate of slick water increased from 61.09% to 82.77%, and the damage rate of the guar gum fracturing fluid decreased from 93.45% to 83.36% due to the increase in interface instability.In addition,the damage rate of the guar fracturing fluid was higher than that of slick water under the same invasion pressure difference.
(4) After the subsequent oil production process, the average damage recovery rate of slick water was 51.56%, which was higher than that of the guar gum fracturing fluid (34.37%).The increase in pressure difference between reservoir and fracture-matrix zone had more obvious effect on reducing the damage caused by slick water. The main flowback resistance of slick water in porous media was capillary force,while that of the guar fracturing fluid was viscous resistance.
(5) The retention rate of the fracturing fluid in low permeability area and the area close to the fracture end was the largest.The experimental and numerical simulation results showed that increasing ΔP could improve the flow velocity distribution of the fracture-matrix zone,which would increase the sweep area of flowback and finally reduce the fracturing fluid retention rate.
(6) The retention damage mechanisms of fracturing fluids in the fracture-matrix zone mainly include: emulsion retention caused by capillary force and flow interception effect,viscous retention caused by viscous resistance, and flow-field retention caused by uneven distribution of flowback velocity.
Acknowledgements
This research was supported by the National Natural Science Foundation of China (No. 51874330, 51974341), the Fundamental Research Funds for the Central Universities(No.20CX06070A),the Opening Fund of Shandong Key Laboratory of Oilfield Chemistry and the Fundamental Research Funds for the Central Universities(No.19CX05006A).
杂志排行

Petroleum Science的其它文章
- A fast space-time-domain Gaussian beam migration approach using the dominant frequency approximation
- Predicting gas-bearing distribution using DNN based on multicomponent seismic data: Quality evaluation using structural and fracture factors
- Reflection-based traveltime and waveform inversion with secondorder optimization
- Determination of dynamic capillary effect on two-phase flow in porous media: A perspective from various methods
- Settling behavior of spherical particles in eccentric annulus filled with viscous inelastic fluid
- Laboratory investigation on hydraulic fracture propagation in sandstone-mudstone-shale layers