Organic geochemistry and petrology of source rocks from the Banqiao Sag, Bohai Bay Basin, China: Implications for petroleum exploration
2022-09-23XiangBaiLiuGuangDiLiuWenYaJiangZeZhangSongNaWang
Xiang-Bai Liu , Guang-Di Liu ,*, Wen-Ya Jiang , Ze-Zhang Song , Na Wang
aState KeyLaboratory of PetroleumResources andProspecting,China UniversityofPetroleum, Beijing,102249,China
bCollege ofGeosciences, China University of Petroleum,Beijing,102249,China
cExploration and Development Research Institute,Dagang Oilfield Company, PetroChina,Tianjin,300280,China
Keywords:Lacustrine source rocks Petrology Biomarkers Depositional environment Banqiao Sag
ABSTRACT The organic geochemistry and petrology of source rocks determine the hydrocarbon generation potential of the Banqiao Sag. In this study, organic geochemistry and petrology were used to determine the abundance of organic matter(OM),OM type,OM maturity,and sedimentary environments of the source rocks, collected from Cenozoic Shahejie Formation, Banqiao Sag, Bohai Bay Basin, China. Vitrinite and liptinite are the main maceral composition of the source rocks,and range from 18%to 81%and from 2%to 82% on a mineral matter free (MMF) basis, respectively. The values of vitrinite reflectance (Ro) (0.36%-1.20%) and the Tmax values (397-486 °C) show that the thermal maturity range from low mature to peak-maturity.The abundance of OM varies between 0.22%and 4.37%,suggesting that the source rocks of the Shahejie (Es) Formation are mainly fair to good source rocks. The Rock-Eval pyrolysis results show that the source rocks have good petroleum generation potential. The amount of free hydrocarbons (S1)and hydrocarbons generated from pyrolysis(S2)range within 0.01-3.70 mg/g,and 0.04-29.17 mg/g.The hydrogen index (HI) varies between 18.18 and 741.13 mg HC/g TOC, with most of the samples appearing to be mainly Type II kerogen,and thereby exhibiting the ability to generate both oil and gas.The ratios of Pr/Ph, the cross plot of Pr/nC17-Ph/nC18, the cross plot of C29/C27-Pr/Ph, and ternary of dibenzothiophene, dibenzofuran, and fluorene, indicate that the Shahejie Formation deposited in suboxic and weak reducing environments. The main biological source is from advanced plants. The maceral composition and rock pyrolysis data indicate the kerogen type is a humic type or mixed sapropelic-humic type. The source rocks of the Shahejie(Es)Formation occur in the oil window,and the abundant organic richness,humic kerogen demonstrate that these rocks are effective oil and gas source rocks. The mudstone rocks in the Shahejie Formation are the main source of oil and gas and represent the main exploration target for the Banqiao Sag.This study enhances the great prospect of oil and gas production in the Banqiao Sag.©2022 The Authors.Publishing services by Elsevier B.V.on behalf of KeAi Communications Co.Ltd.This is an open access article under the CC BY-NC-ND license(http://creativecommons.org/licenses/by-nc-nd/4.0/).
1. Introduction
Banqiao Sag is a secondary structural unit in the north-central Huanghua Depression of the Bohai Bay Basin hinterland. The sag is in half-graben shape, which is faulted in the west part and overlapped in the east part with an individual area of about 540 km2.Banqiao Sag is one of the most petroliferous sags and has been discovered significant proven oil reserves and undiscovered resources. More importantly, several oil and gas reservoirs have been discovered in Banqiao Sag in the past 60 years. Although the level of exploration has improved in recent years, exploration has become more complicated, and whether can we find more resources have become the main factor restricting the exploration and development of oil and gas in this sag. The organic geochemistry and petrology of source rocks determine the hydrocarbon potential of a basin(Ding et al.,2015,2016a,2016b;Gao et al.,2016,2017; Luo et al., 2016; Chen et al., 2020). In contrast, previous studies showed the characterisation of OM and the depositional environment of Banqiao Sag was limited and unknown.Most of the previous studies of Banqiao Sag were mostly based on pyrolysis methods (Chen and Wang, 2010), without research on biomarkers and petrology of source rocks. Biomarker distributions have been used effectively to characterize the environmental conditions and source input of organic matter during the deposition(Brassell et al.,1978; Damst′e et al.,1995; Hughes et al.,1995; Peters et al., 2005;Bechtel et al., 2012). The distribution and the organic geochemical characteristics of the source rocks are essential to determine the direction of petroleum exploration (Ding et al., 2015; Zhao et al.,2015). We have done a lot of research in organic geochemistry and petrology on the Cenozoic Shahejie Formation source rocks to investigate the origin and type of the OM,thermal maturity,oil/gas proneness and depositional environments of the source rocks in the Banqiao Sag. Through the above research, high precision and accuracy in oil and gas resource prediction and evaluation will be possible.
2. Geological setting
Banqiao Sag is a secondary structural unit in north-central Huanghua Depression, a secondary tectonic unit in Mesozoic-Cenozoic expanding areas of the Bohai Bay Basin hinterland. The Cangxian uplift bounds it to the northwest; the Beidagang buried hill to the southeast(Fig.1).It extends from the Lvjuhe region into the Qikou Sag on the east and is a significant oil source sag in Huanghua Depression. The sag is in half-graben shape, which is faulted in the west part and overlapped in the east part with an individual area of about 540 km2.Banqiao Sag is a typical Cenozoic continental facies basin, which has experienced three stages: the initial stage of rifting,the development of rifting and the decline of rifting (Cheng et al.,1999;Zhang et al.,2009; Sun et al.,2012; Ren et al.,2014; Song et al., 2015; Liu et al., 2017; Yang et al.,2019).
The sequences of the Banqiao Sag comprise the Neogene Minghuazhen (Nm), Guantao (Ng) formations, and the Paleogene Dongying (Ed), Shahejie (Es) formations (Guo et al., 2011) (Fig. 2).The Es Formation can be further divided into three members Es3,Es2,and Es1,which are the primary hydrocarbon source rocks in the Banqiao Sag. Exploration in recent years has proven that the reservoir in Banqiao Sag is mainly distributed in Cenozoic formations, in which the reserves of Es1and Es2account for more than 80% (Li et al., 2004). Favorable oil and gas source conditions have laid an important foundation for oil and gas exploration in this area.Seven oil-bearing series, including Es, Ed, Ng, Nm formations, and lower Paleozoic Ordovician,have been found in the Banqiao Sag,as well as some oil fields and petroliferous structures. According to statistics,81.79 million tons of accumulated proven oil reserves and 51.981 billion cubic meters of natural gas have been found (Liu et al., 2017).
3. Samples and experiment
All mudstone samples of the Shahejie Formation(Es),collected from drill core in the Banqiao Sag, were processed and in preparation for the total organic carbon (TOC) measurements and pyrolysis analysis. Moreover, 25 samples were selected for gas chromatography-mass spectrometry (GC-MS) analysis, 38 samples were used for vitrinite reflectance (Ro) measurements, 19 samples were selected for petrological analyses, and 20 samples were measured for the carbon isotope of organic matter.
The samples were pulverised to 100 mesh to prepare for the TOC measurement and Rock-Eval pyrolysis firstly. During the TOC testing,dilute hydrochloric acid was used to remove the inorganic carbon in the crushed samples. After that, the samples were repeatedly rinsed with distilled water until the solvent was neutral.Lastly, the samples were dried in an oven at 60-80°C to prepare measurement using a LECO CS-230 analyzer. A Rock-Eval instrument is used to perform the pyrolysis analysis,which provides the parameters of Tmax,S1and S2,and the results are listed in Table S1(in Supplementary materials).
Soxhlet extraction method was used to extract OM from mudstones and chloroform/methanol (87:13) were employed for 72 h.Silica gel and alumina column chromatography was conducted to separate the isolated extractable organic matter into saturated hydrocarbons, aromatic hydrocarbons, nonhydrocarbon, and asphaltene.The saturated and aromatic fractions were analyzed by an Agilent 7890-5975c instrument.An HP-5MS fused silica column was equipped and ultrahigh purity He was used as the carrier gas at a flow rate of 1 mL/min.For analysis of the saturate fractions,the GC oven temperature was initially held at 50°C for 1 min, then programmed to 120°C at 20°C/min,and to 250°C at 4°C/min,and to 310°C at 3°C/min, and held at 310°C for 30 min. 290°C was the temperature of the injector.The tricyclic terpanes and hopanes(m/z = 191), and steranes (m/z = 217) were monitored by the data acquisition system,which has selected ion monitoring capabilities.In order to calculate the relative abundances of triterpanes and steranes, the peak areas in the m/z 191 and m/z 217 fragmentograms were measured respectively. The results are listed in Tables S2 and S3 (in Supplementary materials).
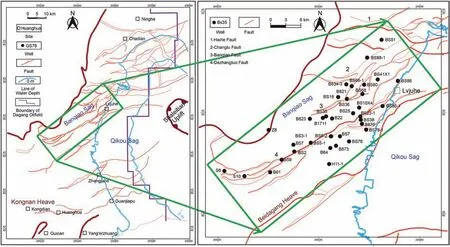
Fig.1. Geologic map of Banqiao Sag, Bohai Bay Basin. The distribution of the samples in this study were marked by the green box.
The characteristics of maceral composition were analyzed on a Leica microscope,equipped with the reflected fluorescent light and white light.The polished samples'random vitrinite reflectance(Ro)was measured by a Leica MPV Compact II reflected-light microscope with the oil immersion method. The vertical incident light was projected onto the samples and the intensity of the reflected light was measured.Compare the intensity with the reflection light intensity under the same conditions (humidity 35%, temperature 20°C), on the premise of the reflection light intensity was measured on standard material with known reflectivity.The results are listed in Table 1 and S4(Table S4 is in Supplementary materials).The carbon isotopic ratios were measured by a DELTA plus XL C003 based on the standard (GB/T18340.2-2010). Before the measurement,samples were treated with HCl and HF to remove carbonates and silicates. The results are listed in Table 2.
4. Results and discussion
4.1. Organic petrology
Maceral compositions data of the 19 studied samples are shown in Table 1. Vitrinite and lipitinite particles derived from higher plants are dominant and present as collinite,telinite,vitrodetrinite and exodetrinite. Under fluorescent light, exodetrinites display intense yellow and orange fluorescence.Vitrinites are mainly in the form of thin strips and debris (Fig. 3).
The percentages of vitrinite and liptinite within 18-81 vol%and 2-82 vol%, with an average of 58 vol% and 38 vol% on a mineral matter free (MMF) basis. The percentages of vitrinite are 18-65 vol% in Es1with an average of 47 vol%, 32-81 vol% in Es3with an average of 62 vol%. The percentages of liptinite are 35-82 vol% in Es1with an average of 52 vol%, 2-68 vol% in Es3with an average of 32 vol%. Small amounts of inertinite contents have been observed in several samples, and only in sample BS38,exceed liptinite contents (Table 1). The Roin the samples from burial depth less than 3000 m are low, ranging from 0.36% to 0.45%. The Rovalues are 0.36%-1.20% in Es1with an average of 0.82%, 0.52%-1.15% in Es3, with an average of 0.76%, as listed in Table S4. Generally, Rohas a positive correlation (the fitting coefficient R2reaching 0.9082) with burial depth, and Roincreases with an increase in burial depth (Fig. 4). When the buried depth reaches about 2900 m,the organic matter reaches the low mature stage (Ro= 0.5%).
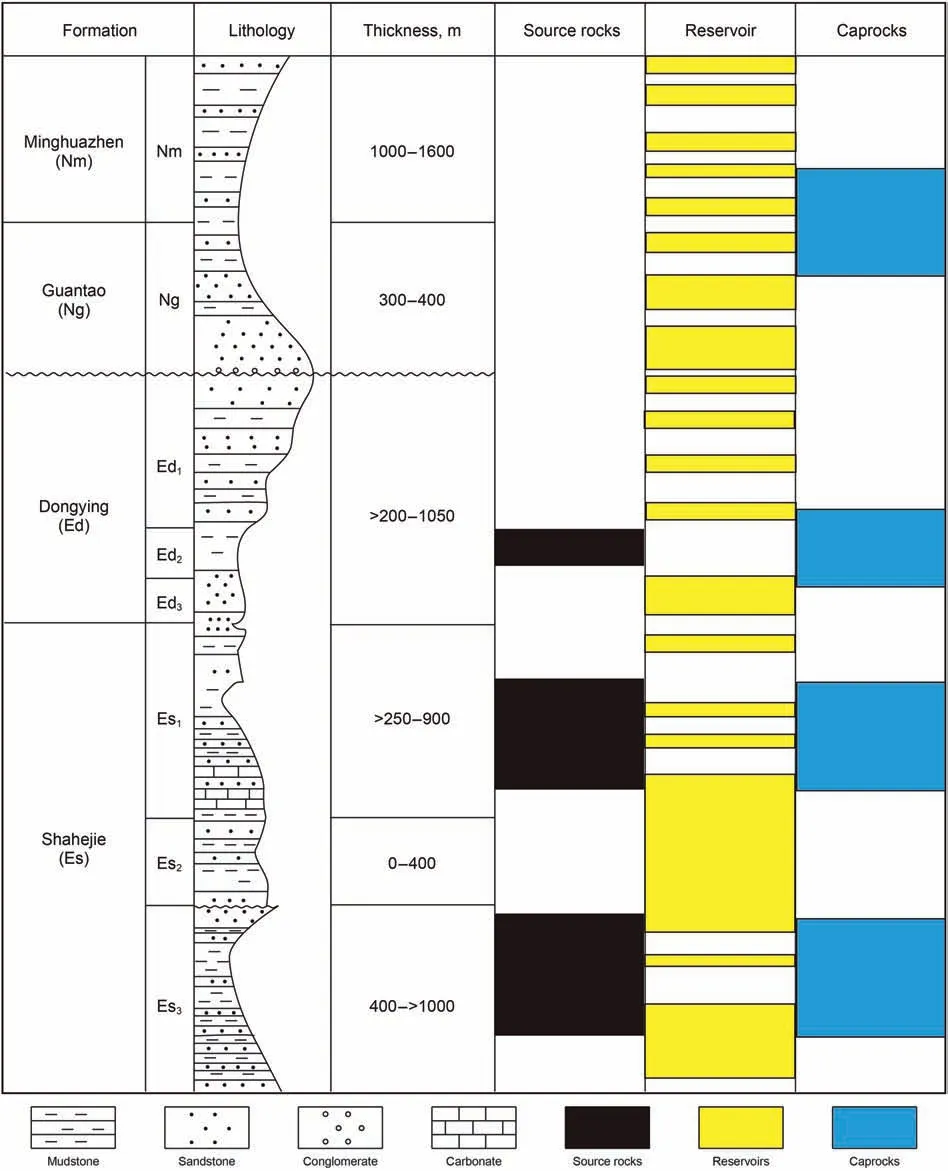
Fig. 2. Generalised stratigraphy and primary possible source rocks, major reservoir intervals, caprocks in the Banqiao Sag.
4.2. Organic geochemistry
4.2.1. TOC and rock pyrolysis
The organic matter abundance of source rocks is evaluated by TOC commonly,and the fundamental to hydrocarbon generation in source rocks is the OM (Mulier, 2002; Kao et al., 2004). Besides,hydrocarbon generation potential (S1+S2), bitumen content, and total hydrocarbon(HC)are used in evaluating the OM abundance of source rock(Tissot and Welte,1978;Hunt,1979;Huang et al.,1984;Cheng et al., 1995). In the Banqiao Sag, the TOC contents of mudstone samples show a wide range of 0.22%-4.37%(average=1.30%).The results of 127 samples show that TOC in Es1is a little higher than that of Es3,except for those with TOC less than 0.4.The average value of TOC contents of Es1is 1.47%,while the Es3with TOC contents averaging 1.21%.In detail,the TOC ranges within 0.3%-1.0%are more than 50%(53.09%)in Es3,while that in Es1are only 46.88%.By comparison,the TOC content of Es1exceeding 2.0%is flat for that of Es3(Fig. 5).
Rock-Eval pyrolysis method is often used to classify OM types and evaluate the generating potentials of hydrocarbon.The studied samples have hydrogen index (S2/TOC) of 18.18-741.13 mg HC/g TOC in the Banqiao Sag, which shows the source rocks’ kerogen composition are in type I to type III in Shahejie Formation,and type II1,II2are the main type.The amount of S1is lower in Es1than that in Es3.In contrast,the S2of the kerogen and S1+S2are higher in Es1than that in Es3, ranging from 0.01 to 3.70 mg HC/g rock,0.04-29.17 mg HC/g rock, and from 0.13 to 29.75 mg HC/g rock,respectively.In detail,the S1,S2,(S1+S2)range within 0.01-0.92 mg/g,0.14-29.17 mg/g,0.16-29.75 mg/g with an average of 0.21 mg/g,6.37 mg/g, 6.58 mg/g in the Es1mudstone samples and within 0.04-1.98 mg/g, 0.04-16.31 mg/g, 0.13-16.93 mg/g with an average of 0.48 mg/g, 3.10 mg/g, 3.58 mg/g in the Es3mudstone samples, respectively (Table S1). The TOC and S2are positively correlated, and the fitting coefficient R2is 0.9564 in the Es1and 0.8473 in the Es3mudstones(Fig.6,kerogen classification standard from Wang et al., 2015). The slope of the line, which denotes the hydrogen index(HI=S2/TOC×100),of the Es1mudstone samples(776 mg/g) is steeper than that of the Es3mudstone samples(477 mg/g),indicating the OM in the Es1mudstone samples is more oil-prone. The TOC versus (S1+ S2) plot showing that the mudstones are mainly fair-good source rocks (Fig. 7, maturation scale from Lu et al., 2008).
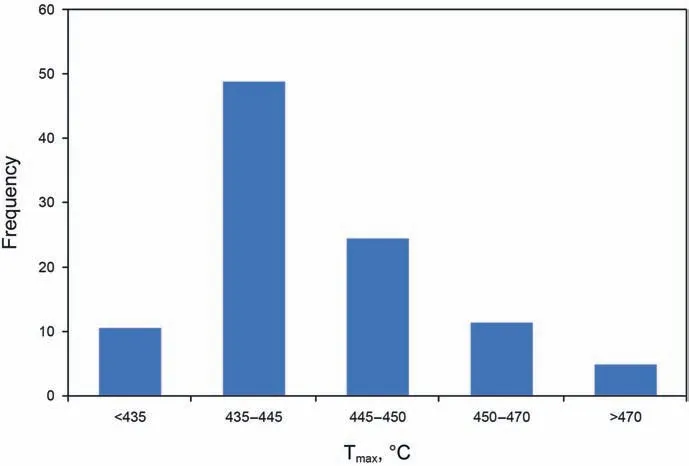
The studied samples have Tmaxvalues in the range of 397-486°C,indicating the low to high maturity OM of source rocks(Table S1).
4.2.2. Carbon isotopic composition of organic matter
The δ13Corg(‰)values show a wide range of-27.7‰to-21.6‰(average = -24.5‰), and have some variation in different formations. In detail, the δ13Corgvalues in the Es1mudstones range from -27.7‰ to -24.3‰, with an average of -26.0‰. The δ13Corgvalues in the Es2and Es3mudstones are similar, ranging from -24.9‰ to -22.4‰ (average = -23.4‰), and from -25.1‰to-21.6‰(average= -23.9‰), respectively(Table 2).
4.2.3. Aliphatic hydrocarbons
The mudstones extracts from Shahejie Formation(Es)contain a full range of C12-C40n-alkanes, pristane, phytane, isoprenoids(Fig. 8). Most of the n-alkane patterns are dominated by short(C15-C20) to middle (C21-C23) chain n-alkanes, and only severalsamples are dominated by long (C25, C27) chain n-alkanes(Table S2). The distribution of n-alkane in the Es1and Es3samples follows unimodal distribution with a maximum at C15-C23(Fig.8).
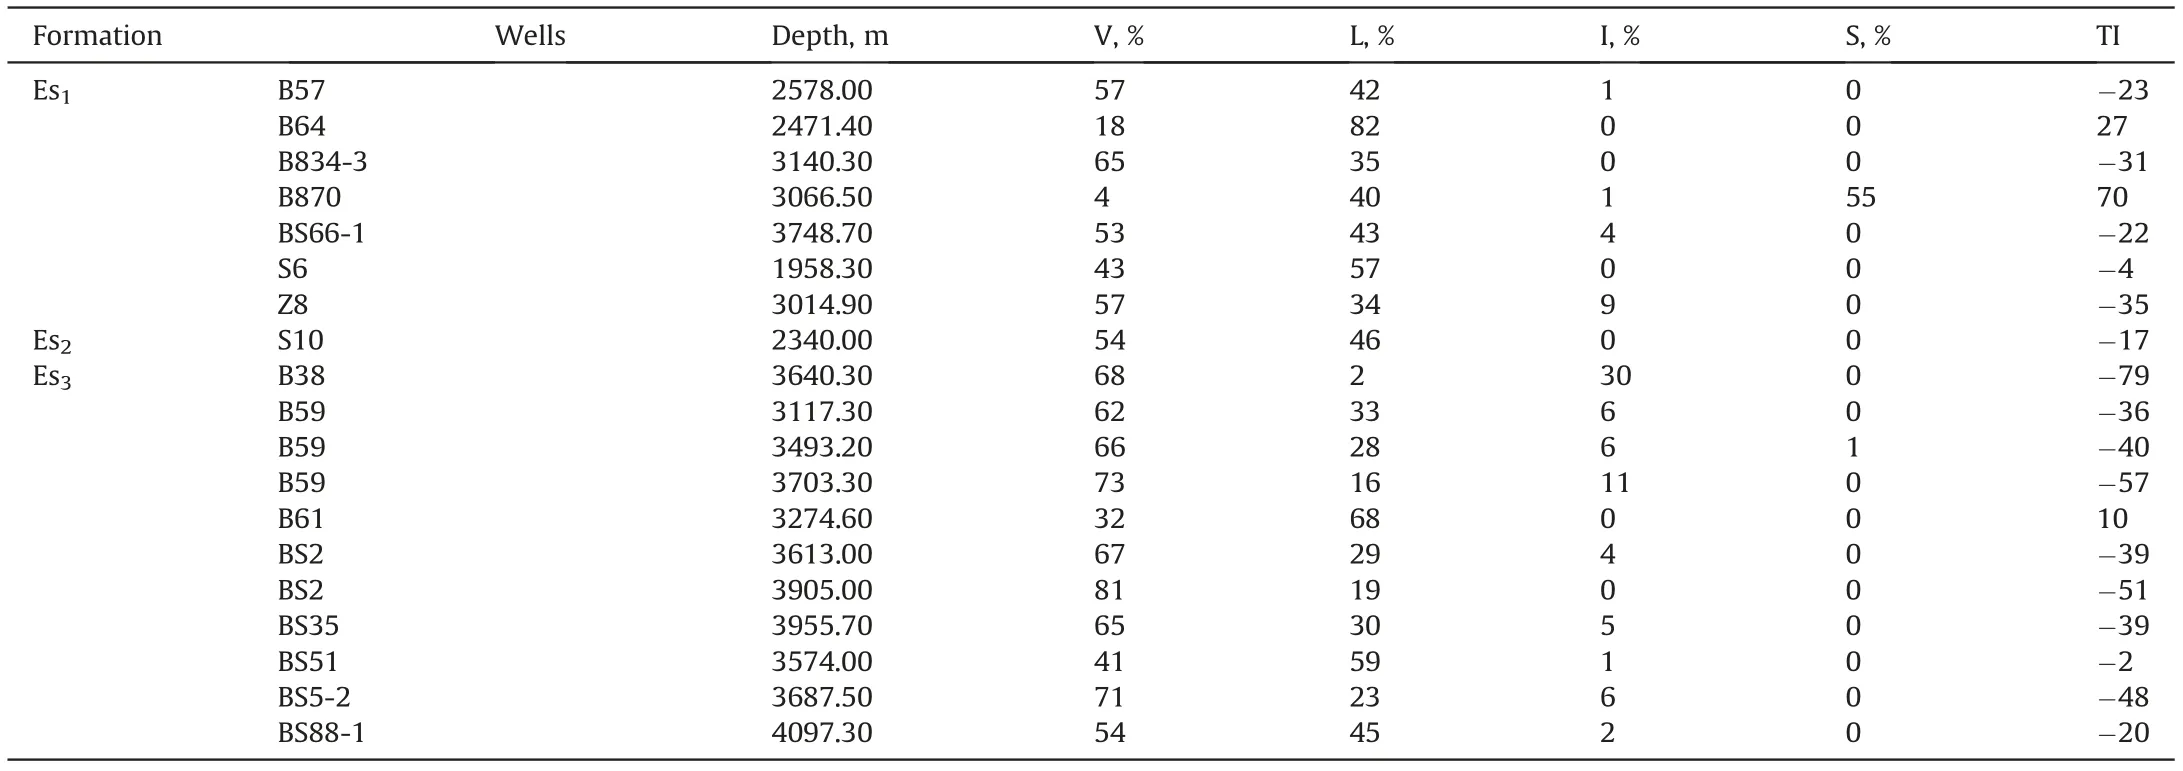
Table 1 Maceral compositions of the Shahejie Formation mudstones.

Table 2The carbon isotopic ratios of the organic matter in Shahejie Formation mudstones.
Low molecular weight (LMW) homologues (
There are a large amount of acyclic isoprenoids(Fig.8),and the concentrations of pristane (Pr) is higher than phytane (Ph), as the ratio of Pr/Ph(between 0.16 and 5.56, average=1.80)reveals.The ratio of Pr/nC17and Ph/nC18occur from 0.27 to 3.15 and 0.14 to 5.41,respectively(Table 1).

Fig.3. Photographs of the maceral compositions in the Shahejie Formation:(a)(c)features of vitrinite and inertinite under reflected light,mudstone,S6;(b)(d)same field as(a)(c),but in a fluorescence mode; (e)(g) features of vitrinite and inertinite under reflected light, mudstone, B59; (f)(h) same field as (e)(g), but in a fluorescence mode.
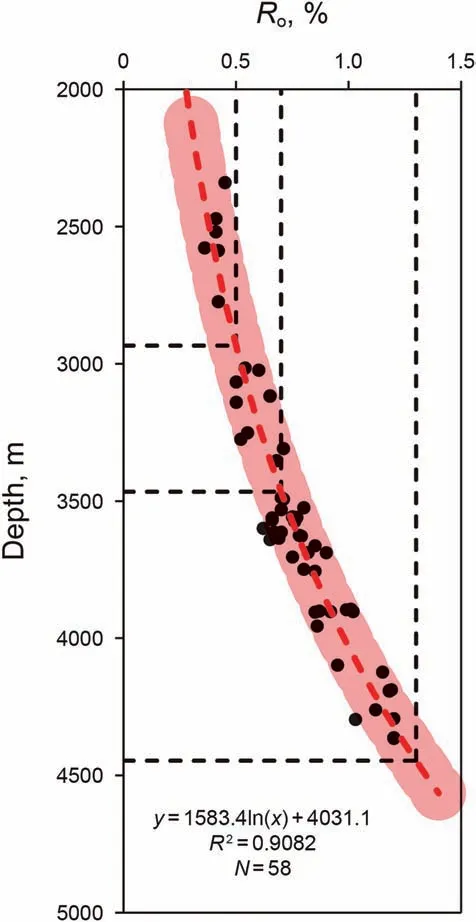
Fig. 4. Vitrinite reflectance (Ro) versus depth of Banqiao Sag, Bohai Bay Basin.N = number of samples.
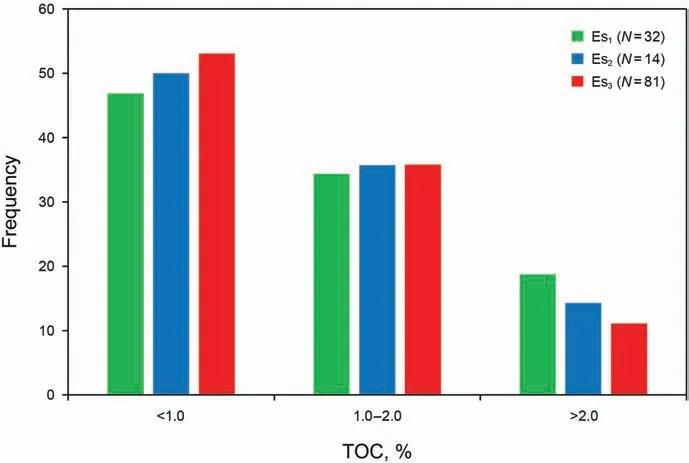
Fig.5. Histograms of TOC in the mudstones of the Shahejie Formation.N=number of samples.
All samples contain Ts,Tm,C29,and C30hopanes and moretanes,C30diahopane, gammacerane, and C31-C35homohopanes (Fig. 8).The C29αβ/(αβ+βα)and C30αβ/(αβ+βα)hopane ratios range from 0.46 to 0.90 (average = 0.78) and 0.71 to 0.92 (average = 0.87),respectively. The C3122S/(22S + 22R) and C3222S/(22S + 22R)homohopane ratios range from 0.35 to 0.62 (average = 0.56) and 0.07 to 0.63 (average = 0.46), respectively. The low Ts/(Ts + Tm)ratios(0.05-0.89)and C29Ts/(C29Ts+C29αβ hopane)(0.05-0.38)and low to high Gammacerane index (Gammacerane/C30αβ hopane) (1.99-79.11, average = 17.25) has been determined in these samples. There is a wide distribution of C29ααα 20S/(20S + 20R) and C29αββ/(αββ+ααα) ratios in these samples,ranging from 0.04 to 0.73 and from 0.16 to 0.60, respectively(Table S3).

Fig.6. TOC versus S2 plot showing the kerogen types of the mudstones.N=number of samples.
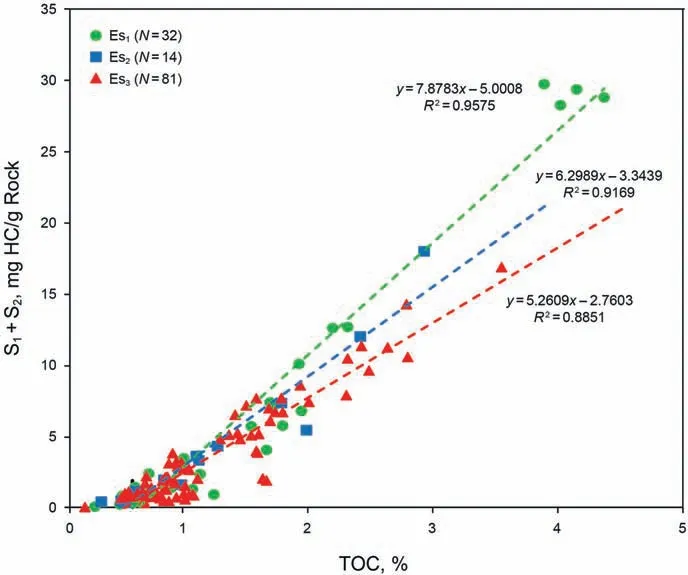
Fig. 7. TOC versus (S1 + S2) plot showing that the mudstones are mainly fair-good source rocks. N = number of samples.
4.2.4. Aromatic hydrocarbons
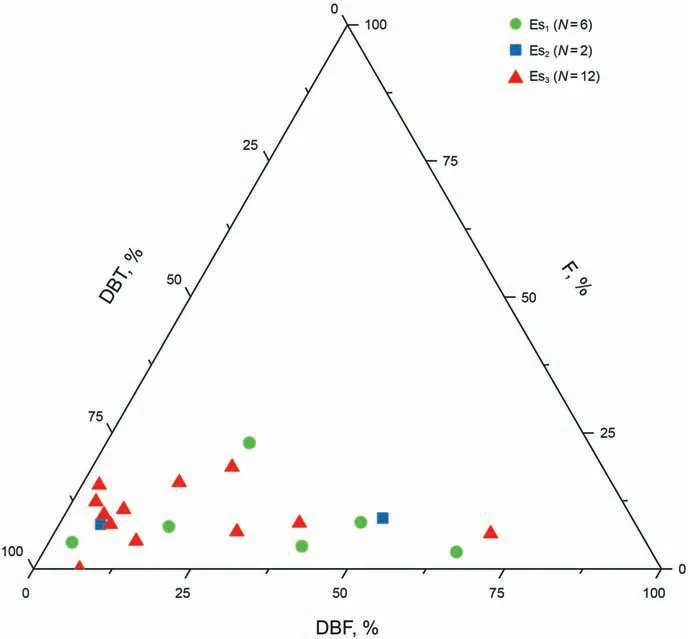
In mudstone samples, abundant alkylnaphthalenes, alkylphe nanthrenes, dibenzothiophenes (DBT), dibenzofuran (DBF), and fluorene (F) were detected. DBT/phenanthrene (DBT/P) was believed to be related to redox conditions,and the ratio is very low in the samples,ranging from 0.01 to 0.05. The ternary plot of DBT,DBF,and F,which had been proposed by Lin et al.(1987),shows the paleoenvironment of sediments.There is a wide distribution of DBT range from 23.95%to 92.65%,as DBT/(DBT+F+DBF)ratio reveals.F/(DBT+F+DBF)and DBF/(DBT+F+DBF)ratios are ranging from 0 to 23.13% and from 2.78% to 69.59%, respectively.
5. Discussion
5.1. Organic matter (OM) type and thermal maturity

Fig.8. The total ion fragmentograms(TIC)(left),m/z=217(middle)and m/z=191(right)ion fragmentograms for some mudstones in Shahejie Formation of Banqiao Sag,Bohai Bay Basin.In the TIC fragmentograms,Pr=pristane,Ph=phytane; in the m/z=191 fragmentograms,Ts=18α(H)-22,29,30-Trisnorneohopane,Tm=17α(H)-22,29,30-Trisnorhopane,C29Ts = 18α(H)-30-Norneohopane; Gam = Gammacerane; in the m/z = 217 fragmentograms, C27, C28, C29 = C27, C28 and C29 ααα 20R steranes.
What's generation of source rocks is determined by the OM type(Tissot and Welte, 1978), which can be evaluated by the organic type index (TI) and the Rock-Eval pyrolysis hydrogen index(HI = 100 × S2/TOC, mg HC/g TOC) (Espitali′e,1986; Peters,1986).
Vitrinite and liptinite are the main maceral composition of the source rocks, mainly as collinite, telinite, vitrodetrinite and exodetrinite, suggesting that the main biological source is terrestrial plant tissues.The organic type index(TI)formula can be calculated to determine the OM type as following:
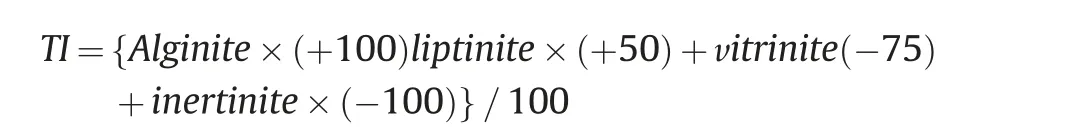
According to TI > 80, 40-80, 0-40, < 0, kerogens are divided into types I,II1,II2,and III.From most of the negative TI values,it can be seen that most of the samples are humic (type III), which is prone to gas generation,except two TI values of the samples belong to 0-40.
According to the wide variation in hydrogen indices,the studied samples show wide variations in kerogen types(Fig.9).The source rocks in Es3are mainly mixed type II and III kerogen,indicated by relatively low hydrogen index.
While in Es1,kerogen distributed from type I to type III,and this means the source of OM was a mixture of bacterial, algal, and higher plants,and higher plants making significant contributions in some part of the Banqiao Sag.
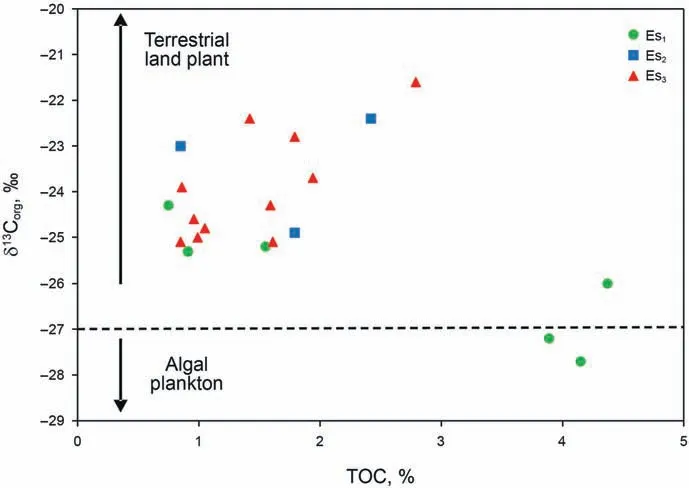
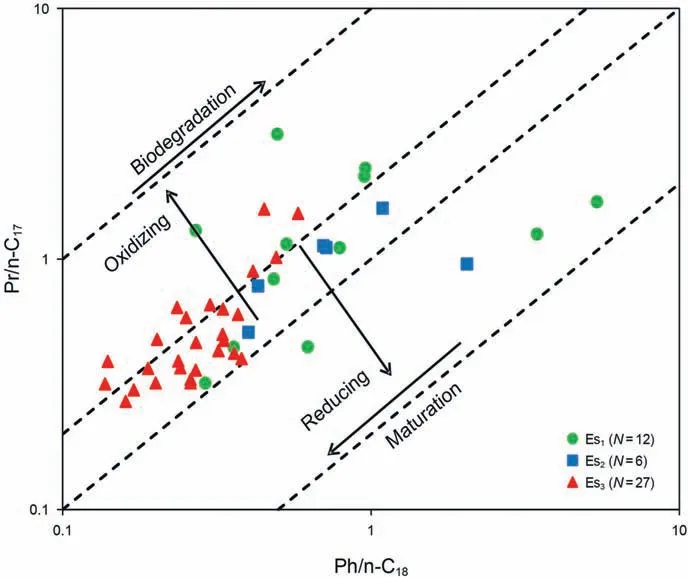
Through the n-alkane distribution patterns of saturated hydrocarbons, we determine the relative contribution of terrigenous versus aquatic OM to the sediments.The characteristic biomarkers of terrestrial higher plants are the long-chain n-alkanes (>nC21),whereas the algae and microorganisms are the short-chain n-alkanes ( Fig. 9. The OM type classification diagram of HI-Tmax. N = number of samples. The thermal maturity of OM can be determined by the Tmaxvalues. According to the Tmaxvalues < 435°C, 435-445°C,445-450°C, 450-470°C, > 470°C, the OM are regarded to be immature, early, peak, late, or post mature, respectively. Based on this,the distribution of Tmaxvalues in most of the studied samples suggest a thermal maturity of early to late mature(Table S1,Fig.10). The low Rosamples from the Shahejie Formation(~0.41%-1.20%,lower than 1.30%) indicate that OM are mature and still in the oil window (Table S4). This is consistent with the conclusion drawn from Tmaxvalues. The C31and C3222S/(22S+22R)homohopane ratios are mostly close to the equilibrium values (0.57-0.62) (Table S3), indicating most of the samples are close to or exceeded the early mature stage.Similarly, the C29and C30αβ/(αβ +βα) hopane ratios (Table 1) are also close to the equilibrium value (around 0.9). On this basic, the OM have a slightly higher thermal maturity, but still suggestive of reaching the early oil generation window.In summary,the thermal maturity of mudstone samples,determined by αβ/(αβ+βα)hopane ratios and 22S/(22S+22R)homohopane,is consistent with the Roand Tmaxvalues. When the OM reach peak oil generation and during early oil generation, the C29αββ/(αββ+ααα) and C29ααα 20S/(20S + 20R)sterane ratios are commonly stated as 0.67-0.71 and 0.52-0.55,respectively. The low to high C29αββ/(αββ+ααα) and C29ααα 20S/(20S + 20R) sterane ratios (0.16-0.60, 0.04-0.73), indicating the OM have low to high thermal maturity. More than half of the mudstones are characterised by >1.0%TOC, and the OM are mainly type II1and II2, and a low thermal maturity(Ro<1.3%),indicating that these rocks in Es Formation are effective oil and gas source rocks. Exploration indicates that the Banqiao Sag is rich in oil and gas and still has great potential for oil and gas discovery. Carbon isotopes are mainly affected by sedimentary environment and the source of organic matter, minimally affected by maturity and transportation (Schoell, 1984; Zhang and Huang,2005). The contribution of vegetable matter is often considered as an important factor leading to the enrichment of δ13C in organic matter(Golyshev et al.,1991; Hofmann et al., 2000). The little difference in the distribution of δ13Corgbetween Es1and Es3formations (Fig. 11). Most of the samples have δ13Corgvalues higher than -27‰, except two of them in Es1formation lower than -27.7‰. The distribution of δ13Corgshow there are no apparent differences in the OM source among Shahejie Formation in Banqiao Sag. Higher aquatic plants accumulated and the contribution of terrestrial organic debris to sediments was significant in Es Formation. The biological sources of organic matter are qualitatively analyzed based on the relative abundances of steranes, which are useful indicators to give an indication of source differences(Seifert and Moldowan, 1978; Huang and Meinschein, 1979). Huang and Meinschein(1979) proposed that C27sterols are mainly derived from algae,while C29sterols are more typically associated with land plants. The low content of C28sterols is typical of limnic environments indicated by Volkman (1986). The distributions of the steranes and diasteranes(C27-C29) can be seen from Fig. 8. Fig.10. Histograms of Tmax in mudstones of the Shahejie Formation. Fig.11. Crossplot of the TOC versus carbon isotopic composition. There is a low contribution of aquatic algal-bacterial OM and significant terrigenous OM input, because the samples have a higher proportion of C29(21.16%-63.71%) compared to C27(18.84%-62.92%) and C28(10.91%-42.10%) steranes (Table S2), as indicated by regular steranes ternary diagram(Fig.12). On the whole, there are no apparent differences in the OM source among Shahejie Formation in Banqiao Sag.The proportional C29sterane abundance in Es1is relatively higher than Es3, which shows little more land plant input in Es1. There is still plenty of planktic plant and bacterial in the source rocks from Es Formation(Fig.12). High C3122R homohopane/C30hopane (C31R/C30> 0.25) and C29/C30hopane(>1.0)are generally indicative of carbonate or marl source rocks, but lower values are indicative of lacustrine source rocks. The studied samples of Es Formation in Banqiao Sag mainly display low ratios of C31R/C30(~0.05-0.31) and C29/C30hopane values (~0.06-1.36), indicating a lacustrine depositional environment (Table S3). Fig.12. Ternary diagram of regular steranes (C27, C28, and C29). Fig.13. Crossplot of the TRS versus TOC. The redox conditions and sulfate concentration are commonly considered influencing the amount of total reduced sulfur (TRS)(Berner and Raiswell,1984; Rao et al.,1994). The dissolved sulfate concentrations in lacustrine sediments are much lower than that in marine sediments (Berner and Raiswell, 1984), so the TRS can be used to indicate the redox conditions (Leventhal, 1983, 1995;Sampei et al.,1997; Mulier, 2002; Kao et al., 2004). The TRS lower than 0.2% is during oxidizing deposition, and over 0.4% is in an anoxic environment as well as ranging 0.2%-0.4% during suboxic deposition (Chen,1987). The TRS values in mudstone samples from Es1and Es3indicate a suboxic and anoxic environment, while most of the TRS values of mudstone samples from Es2formation are lower than 0.2%, indicating oxidizing depositional environment (Fig.13). Fig.14. Crossplot of Pr/n-C17 versus Ph/n-C18. Fig.15. Crossplot of C29/C27 regular steranes versus Pr/Ph. The Pr/Ph ratios were commonly used to evaluate the depositional environments and organic matter source (Powell and McKirdy, 1973; Didyk et al., 1978; Ten Haven et al., 1987; Hunt,1996; Li et al., 1999; Harris et al., 2004; Hao et al., 2009). It is generally accepted that high Pr/Ph values (>3.0) suggest oxic environments and OM input of terrigenous. In contrast, low Pr/Ph values (<0.6) are commonly considered an argument for reducing and a highly saline depositional setting. The values of Pr/Ph show an extensive range (0.16-5.56) in the Shahejie Formation. The Shahejie Formation deposited in anoxic conditions, indicated by the low values in most of the samples(<3).Oxidizing and reducing environments are defined by Peters et al.(1999)through the plot of Pr/n-C17versus Ph/n-C18(Fig.14).This plot supports mainly suboxic and weak reducing environments during the Es Formation deposited. Fig.16. Ternary diagram of F, DBT, and DBF. The cross plot of Pr/Ph versus C29/C27regular steranes can indicate the OM type and redox conditions of the sedimentary environment(Adegoke et al.,2014).The ratio of Pr/Ph between 0.16 and 5.56 and C29/C27regular steranes ratio are in the range of 0.34-2.89, indicating terrigenous organic matter and certain amount of bacteria preserved under suboxic to anoxic conditions(Fig. 15). Besides, the redox conditions of the sedimentary environment,suggested from several samples in Es1,are nearly anoxic.The range of Pr/nC17and Ph/nC18ratios is more considerable in Es1than in Es3. This would also be explained by the proportion of terrigenous OM and oxygen content in Es1being higher than that in Es3(Fig.14). The source rock extracts deposited under anoxic saline environments usually have low Pr/Ph ratios and high gammacerane index values, this means gammacerane can be an indicator of a salinity-stratified water column. The wide range of gammacerane index(1.99%-79.11%)and Pr/Ph ratios(0.16-5.56)indicate there is a great change of the sedimentary environment in Es Formation on time scale. Due to the F, DBT, and DBF having similar molecular structure,they were derived from the same precursor. The relative component of F, DBT, and DBF is usually used to judge the primary depositional environment. The dominant DBF indicates oxic environment whereas abundant DBT was generally related to anoxic environments.According to Fig.16,it can be concluded that most of the samples deposited in a reducing environment, which is also reflected in the cross polt of Pr/n-C17versus Ph/n-C18. Organic petrographic and geochemical results indicate that the Cenozoic Shahejie Formation mudstones in the Banqiao Sag,Bohai Bay Basin, China, generally have excellent oil and gas generation potential. The Cenozoic Shahejie Formation mudstones contain abundant OM with TOC values up to 4.37%.The analysis of maceral composition and biomarker indicate that the OM of the mudstones from Es Formation are type II and III kerogen. This conclusion is supported by its broad distribution of HI values,ranging from 18.18 to 741.13 mg HC/g TOC. The cross plot of Pr/n-C17versus Ph/n-C18indicate that the source rocks from Es Formation were deposited in a suboxic and weak reducing environment.In terms of hydrocarbon generation, the values of Tmax, Ro, and biomarker maturity ratio indicate that the studied samples are at low to high mature stages.Abundant OM, type II and III kerogen, and moderate thermal maturity in most of the studied samples imply that they are effective oil and gas source rocks,and prove the potential for oil and gas exploration in the Banqiao Sag, Bohai Bay Basin is very good.This has been proven by the Cenozoic oil and gas found in the Banqiao area. These conclusions enhance the great prospect of oil and gas production in the Banqiao Sag. Acknowledgements This work was financially supported by the National Key Research and Development Program of China (Grant No.2017YFC0603106). We appreciate the Petrochina Dagang Oilfield Company for providing background geologic data, samples and permission to publish this work.We also extend our appreciation to the editors and reviewers for their valuable and constructive comments and suggestions. Appendix A. Supplementary data Supplementary data to this article can be found online at https://doi.org/10.1016/j.petsci.2022.07.002.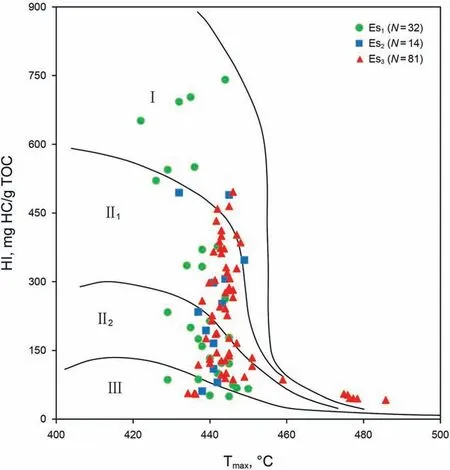
5.2. Source input and depositional environments


6. Conclusion
杂志排行
Petroleum Science的其它文章
- A fast space-time-domain Gaussian beam migration approach using the dominant frequency approximation
- Predicting gas-bearing distribution using DNN based on multicomponent seismic data: Quality evaluation using structural and fracture factors
- Reflection-based traveltime and waveform inversion with secondorder optimization
- Determination of dynamic capillary effect on two-phase flow in porous media: A perspective from various methods
- Settling behavior of spherical particles in eccentric annulus filled with viscous inelastic fluid
- Laboratory investigation on hydraulic fracture propagation in sandstone-mudstone-shale layers