Control of different occurrence types of organic matter on hydrocarbon generation in mudstones
2022-09-23PengYnDuJinGongCiQingLiuXueJunZhngJunWng
Peng-Yn Du , Jin-Gong Ci ,*, Qing Liu , Xue-Jun Zhng , Jun Wng
a State Key Laboratory of Marine Geology, Tongji University, Shanghai, 200092, China
b Exploration and Development Research Institute of Shengli Oilfield Company, SINOPEC, Dongying, Shandong 257001, China
Keywords:Soluble organic matter Mineral-bound organic matter Particulate organic matter Hydrocarbon precursor Rock-Eval VI pyrolysis
ABSTRACT Organic matter (OM) is preserved as different occurrences in mudstones, which can affect the hydrocarbon generation process.However,little research has focused on hydrocarbon generation as a function of different occurrences of OM.This study collected a suite of mudstones in the Dongying Sag,Bohai Bay Basin, and conducted Rock-Eval VI pyrolysis after Soxhlet extraction and Na2S2O8 oxidation, aiming to quantify the OM with different occurrences and figure out the contributions of each occurrence of OM to the hydrocarbon generation. There are three types of occurrences of OM: soluble organic matter (SOM),mineral-bound organic matter(MOM),and particulate organic matter(POM).MOM is the most abundant among the three occurrence types of OM.SOM and MOM are the main hydrocarbon precursors,and their hydrocarbon contributions alternate with different kerogen types and layers. Additionally, MOMcontributed hydrocarbons are numerous at shallow depths; SOM-contributed hydrocarbons mainly occur at deep depths; and POM-contributed hydrocarbons change little with depth. These results demonstrate that MOM should be the main hydrocarbon precursor in shallow formations and that SOM is the main hydrocarbon contributor at deep depths.
1. Introduction
Different types of occurrences of OM in source rocks have received much attention in the areas of petroleum generation and the global carbon cycle (Berthonneau et al., 2016; Cai et al., 2007;Jarvie et al.,2007;Kennedy and Wagner,2011;Rahman et al.,2017).Learning the characteristics of different types of occurrences of OM would be significantly useful for further understanding hydrocarbon generation mechanisms in source rocks.
Various studies have focused on OM classification in source rocks according to the OM occurrence (Kennedy et al., 2002; Zhu et al., 2016), and the physicochemical interactions between OM and clay minerals (Cai et al., 2020; Keil and Maye, 2014; Lützow et al., 2006; Zhu et al., 2020). Soluble and insoluble OM (Durand,1980; Tissot and Welte, 1984), OM combined with minerals and not combined with minerals(Keil and Mayer,2014),and structured and amorphous OM (Sebag et al., 2006; Tyson,1995) demonstrate the diversity of OM.The OM combined with minerals have various bonding mechanisms with mineral surfaces, such as ligand exchange (Kaiser et al., 2007; Kleber et al., 2007), ion exchange(Mikutta et al.,2007,2009),cation bridging(Li et al.,2015;Lützow et al.,2006),etc.Soluble OM is generally in a free state or physically adsorbed in source rocks(Tissot and Welte,1984).As the OM with different occurrences have different structures and hydrocarbon generation mechanisms,they may contribute different volumes of hydrocarbons to source rocks(Kennedy et al.,2014;Rahman et al.,2018;Tissot and Welte,1984;Yuan et al.,2013).However,there are currently few studies on the specific differences in hydrocarbon contributions of the OM with different occurrences.
Previous studies have employed many methods to separate different occurrences of OM. Soxhlet extraction (Tissot and Welte,1984), density fractionation (Arnarson and Keil, 2001), and size fractionation (Carter et al., 2003) are always used to separate soluble OM. The OM combined with minerals can be removed by oxidizing agents such as H2O2, NaClO, and Na2S2O8(Eusterhues et al., 2003; Kiem et al., 2002; Meier and Menegatti, 1997;Mikutta et al., 2005), among which Na2S2O8is considered to be more efficient(Helfrich et al.,2007;Lützow et al.,2007).However,quantifying OM with different types of occurrences in source rocks is still a difficult problem.
This work collected a suite of mudstones in the Dongying Sag in the depth range of 1850-5000 m. Soxhlet extraction and Na2S2O8oxidation were used to sequentially remove OM with different occurrences from the mudstones, respectively. Subsequently, the quantification of OM with different occurrences was realized by conducting Rock-Eval VI pyrolysis on raw, Soxhlet extracted, and Na2S2O8oxidized mudstones. Correspondingly, the hydrocarbon generation potential and behavior of OM with different occurrences were investigated in the whole depth profile.
2. Materials and methods
2.1. Materials


2.2. Methods
The samples were crushed into powder,screened to a 100-mesh(< 0.15 mm), and then dried for 24 h at 60°C. The dried samples were stored in a desiccator for further experiments.
2.2.1. Soxhlet extraction

Fig.1. Location map and development of strata in the Dongying Sag(modified by Zeng et al.(2018)).(a)Study area and structural units of the Dongying Sag in the Bohai Bay Basin,China (the gray dot denotes the Dongying Sag). (b) Development of Paleogene deposits in the Dongying Sag (the gray shading indicates the research strata).
First, approximately 10 g of sample powder was wrapped with filter paper and weighed, and then refluxed with a mixture of CH2Cl2:CH3OH at a ratio of 9:1 (vol:vol) in a Soxhlet extractor to remove the soluble OM (Cai et al., 2021). Then, the extraction was conducted at 48°C for 72 h.Last,the extraction residues were dried at 60°C for 24 h and weighed.The analytical balance was a Mettler Toledo ME104, its resolution was 0.0001 g, and the maximum permission error(MPE) was 0.0002 g.
2.2.2. Na2S2O8oxidation
The Soxhlet extraction residues were then subjected to Na2S2O8oxidation, which could oxidize the OM combined with minerals without damage to the mineral structure (Kiem et al., 2002;Menegatti et al., 1999). The oxidizing solvent was a mixture of Na2S2O8:NaHCO3at a mass ratio of 1:1.1(g:g).The mass ratio of the sample to Na2S2O8is approximately 1:40 (g:g) (Meier and Menegatti,1997; Mikutta et al., 2005). First, approximately 2 g of Soxhlet extraction residue was weighed and dispersed in oxidizing solvent diluted with deionized water to a total volume of 1000 mL with a pH of 7-8.5(Cai et al.,2021).Then,the oxidation treatment was performed in a water bath at 80°C for 48 h.Next,the oxidation residues were washed with deionized water several times to remove sulfate ions.Last,the washed residues were dried at 60°C for 48 h and weighed.
2.2.3. Rock-Eval VI pyrolysis
Rock-Eval VI pyrolysis(Vinci Technologies,France)experiments were conducted in the Experimental Research Center of the Wuxi Petroleum Geology Institute, China Petroleum & Chemical Corporation(SINOPEC).The sample was heated at 300°C in helium flow for 2.5 min,then heated from 300°C to 650°C with a heating rate of 25°C/min, and the hydrocarbon released was detected by a hydrogen flame ionization detector. CO2released during pyrolysis was detected by a thermal conductivity detector. Pyrolysis was conducted on all of the raw, extracted and oxidized samples to obtain the pyrolysis parameters of total organic carbon (TOC)content, free hydrocarbons (S1), pyrolysis hydrocarbons (S2), the hydrogen index (HI = S2/TOC), and the temperature of the maximum S2 peak(Tmax) (Behar et al., 2001; Carrie et al., 2012).
3. Results
The TOC contents of the raw samples first increased and then decreased with depth(Fig.2a).The TOC contents of approximately 45%of the samples were in the range of 2%-4%,approximately 14%of the samples had TOC contents higher than 4%,31%of the samples had TOC contents in the range of 1%-2%, and only approximately 10%of the samples had TOC contents less than 1%(Fig.2b).The S1 and S2 of the raw samples all increased in shallow formations and then decreased with depth;the S1 values were 0-8 mg/g,and the S2 values were 0-110 mg/g(Fig.2c and d).The kerogen types in the raw samples in each layer were mainly types I and II (Fig. 2e).
The TOC contents of the extracted samples had a similar evolutionary trend to that of the raw samples (Fig. 2a), but approximately 53% of the TOC contents of the extracted samples were in the 1%-2% range, approximately 27% were in the 2%-4%range,10%were less than 1%and 10%were larger than 4%(Fig.2b).S1 values of the extracted samples were mostly less than 0.1 mg/g(Fig. 2c). S2 values of the extracted samples had a similar trend to the S2 values of the raw samples, and the TOC values of the extracted samples were slightly lower(Fig.2d).The kerogen types of the extracted samples were mainly I and II,while some samples in Echange to type III (Fig. 2f).
After the subsequent Na2S2O8oxidation,the TOC contents of the oxidized samples generally changed little with depth(Fig.2a),and the TOC values of approximately 76% oxidized samples were less than 1%, approximately 14% were in the 1%-2% range, 7% were in the 2%-4% range, and only 3% were higher than 4% (Fig. 2b). S1 values of the oxidized samples were nearly 0 mg/g(Fig.2c),and S2 values were less than 2 mg/g (Fig. 2d). The kerogen types of the oxidized samples mostly changed to types II and III (Fig. 2g).
4. Discussion
4.1. Definition of OM with different occurrences
The sequential treatment results show that OM in mudstones is mostly removed by Soxhlet extraction and Na2S2O8oxidation(Fig.2a and b).As Soxhlet extraction is a physical action that has no influence on the structure of organic matters, the organic matter that is dissolved in this process is physically adsorbed in mudstones and is defined as soluble organic matter (SOM) (Tissot and Welte,1984). Na2S2O8oxidation is a chemical reaction that can yield SO4-radicals that react with OM (Mikutta et al., 2005; Zhu et al.,2016). As Na2S2O8oxidation was treated sequentially after Soxhlet extraction,the OM removed in this process is bonding to the clay mineral interlayer or mineral surface(Helfrich et al.,2007;Lützow et al., 2007). This kind of OM is mainly an amorphous component(Cai et al., 2007, 2020; Zhu et al., 2020) and is defined as mineralbound organic matter (MOM) in this paper (Fig. 3). Thus, SOM and MOM could be progressively removed by the two sequential treatments. There is also a small amount of OM in the Na2S2O8oxidized sample(Fig.2a).As this kind of OM is mainly clumpy flocs or macromolecule polymers that can barely be physically or chemically removed(Cambardella and Elliott,1992;Keil and Mayer,2014; Lopez-Sangil and Rovira, 2013), it is defined as particulate organic matter(POM) in this work (Fig. 3).
4.2. Quantification of OM with different occurrences
The contents of SOM,MOM and POM can be represented by the TOC difference between the raw, extracted and oxidized samples.The hydrocarbons generated from SOM, MOM and POM can be calculated based on S1 and S2 of the raw, extracted and oxidized samples. As the denominators of TOC, S1 and S2 of the raw,extracted and oxidized samples are different, these parameters need to be calculated with the same denominator, and then the abundances and hydrocarbon parameters of SOM, MOM and POM can be calculated.
The quantification process mainly involves two steps: first, the sample weights of the raw,extracted and oxidized samples are used to calculate the conversion factors(fe,fo),which can convert TOC,S1 and S2 of the raw,extracted,and oxidized samples to have the same denominator; second, the difference between the converted TOC,S1 and S2 of the raw,extracted,and oxidized samples is calculated to obtain the abundances and hydrocarbon contents of SOM and MOM.The calculation equations for the two steps are shown by Eq.(1)-Eq. (5) in Fig. 4.
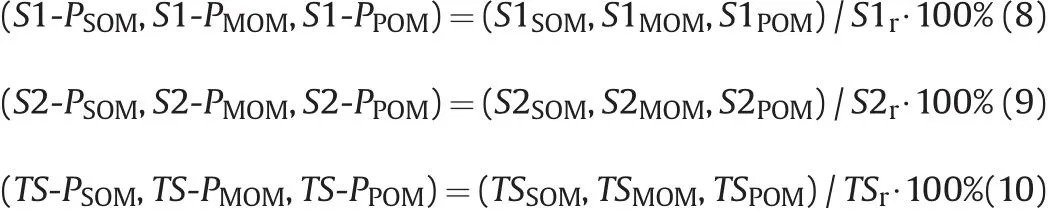
The sum of S1 and S2 can be used to represent the total hydrocarbons (TS) generated from each OM with different occurrences(Eq. (6)):

The relative contents of TOC,S1,S2,and TS(represented by TOCP, S1-P, S2-P, and TS-P, respectively) of SOM, MOM and POM represent the relative abundances and hydrocarbon contributions of OM with the three occurrence types. The calculation equations are shown below(Eq. (7)-Eq.(10)):

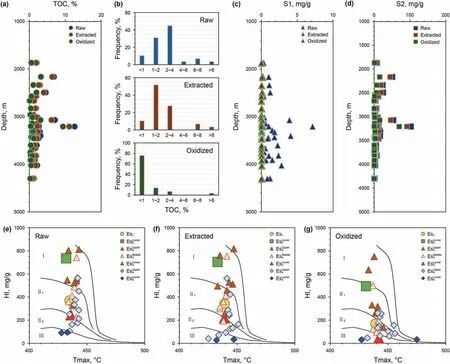
Fig. 2. OM and hydrocarbon characteristics of the raw samples (Raw), Soxhlet extracted samples (Extracted) and Na2S2O8 oxidized samples (Oxidized): (a) variation of TOC with increasing depth,(b)frequency distribution of TOC,(c)variation of S1 with increasing depth,(d)variation of S2 with increasing depth,and(e,f,g)kerogen types determined by HI vs Tmax in the raw, extracted and oxidized samples. The data are given in Table S1 in the Supplementary Data.
The quantification results are shown in Table S2 in the Supplementary Data.
4.3. Comparison of the abundances and hydrocarbon contributions of SOM, MOM, and POM
4.3.1. Relative abundances of SOM, MOM, and POM
The relative abundances of SOM, MOM, and POM are approximately 17.62%, 54.41%, and 27.97% on average, respectively,revealing that MOM accounts for the largest OM abundance in the source rocks (Fig. 5a).
For samples with different kerogen types,the relative content of each occurrence type of OM would also be different.For example,in samples with type I kerogen, most of the SOM content is in the range of 0-25%, and the POM and MOM contents are in the 25%-40% and 40%-75% ranges, respectively (Fig. 5d). In samples with type II1and II2kerogen,the SOM content is mainly in the range of 0-25%, the POM content is in the 0-50% range and the MOM content is in the 35%-85% (Fig. 5d). In samples with type III kerogen, it is evident that the MOM content is the largest, with a range of 50%-80% (Fig. 5d). The average abundance of different occurrences of OM shows that TOC-PMOM>TOC-PPOM>TOC-PSOMin samples with kerogen I and II, and TOC-PMOM> TOC-PSOM> TOCPPOMin samples with kerogen III (Fig. 5b). These characteristics indicate that MOM contributes the largest amount of OM, regardless of the type of kerogen in mudstones.

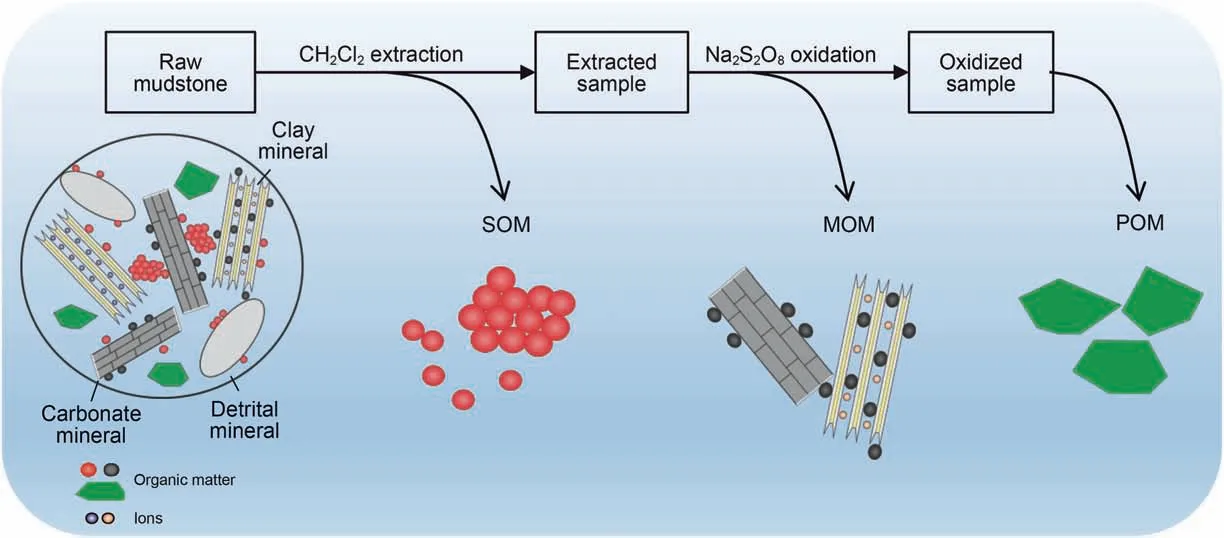
Fig. 3. Schematic of OM with different occurrences in mudstones (modified from Cai et al. (2020), Keil and Mayer (2014), and Zhu et al. (2016)).

Fig.4. Calculation process of the abundance and hydrocarbon content of SOM,MOM,and POM(Mr,Me:mass of the raw and extracted samples in the Soxhlet extraction experiment;Me’,Mo’:mass of the extracted and oxidized samples in the Na2S2O8 oxidation experiment;Mo:mass of the oxidized samples if all the extracted samples(mass of Me)were used in the Na2S2O8 oxidation experiment;(TOCr,S1r,and S2r),(TOCe,S1e,and S2e),(TOCo,S1o,and S2o):TOC,S1,and S2 of the raw,extracted,and oxidized samples,respectively;(TOCSOM,S1SOM,and S2SOM),(TOCMOM,S1MOM,and S2MOM),(TOCPOM,S1POM,and S2POM):abundance,free hydrocarbons and pyrolysis hydrocarbons of SOM,MOM,and POM,respectively;fe,fo:conversion factor of TOC, S1, and S2 of the extracted and oxidized samples).

4.3.2. Relative hydrocarbon contents produced by SOM, MOM, and POM

Fig.5. Characteristics of the abundance of SOM,MOM,and POM in mudstones:(a)average contents of SOM,MOM,and POM in mudstone samples;(b,c)average content of SOM,MOM, and POM in mudstones with different types of kerogen and different layers; (d, e) abundance distribution of SOM, MOM, and POM in mudstones with different types of kerogen and different layers.
The hydrocarbon quantification results show that the average S1-P of SOM is approximately 92.28%,which is much larger than the S1-P of MOM and POM, which are 5.01% and 2.71%, respectively(Fig.6a).SOM contributes more than 90%S1 on average to samples with each type of kerogen(Fig.6b)and contributes more than 87%S1 to samples in each layer (Fig. 6c). This reveals that SOM is the main contributor of S1,regardless of the type of kerogen or layer of the mudstones.


The abundances and hydrocarbon characteristics of different occurrence types of OM reveal that SOM and MOM are the main contributors to hydrocarbon generation, S1 is mainly generated from SOM and S2 is mostly generated from MOM. Although the relative abundance of POM is mostly larger than that of SOM,POM still produces the fewest hydrocarbons. Moreover, the total hydrocarbon content of SOM and MOM alternately changes in mudstones with different kerogen types and different layers. In general, the hydrocarbon contributions of OM with the three occurrences in mudstones have great differences.
4.4. Evolutionary differences of the hydrocarbons generated from SOM, MOM, and POM

Fig.6. Characteristics of the relative hydrocarbon contents generated by SOM,MOM,and POM.(a)Average contents of S1-P,S2-P,and TS-P of the total mudstone samples;(b,d,f)distribution and average contents of S1-P, S2-P, and TS-P in mudstones with different types of kerogens; (c, e, g) distribution and average contents of S1-P, S2-P, and TS-P in mudstones of different layers.
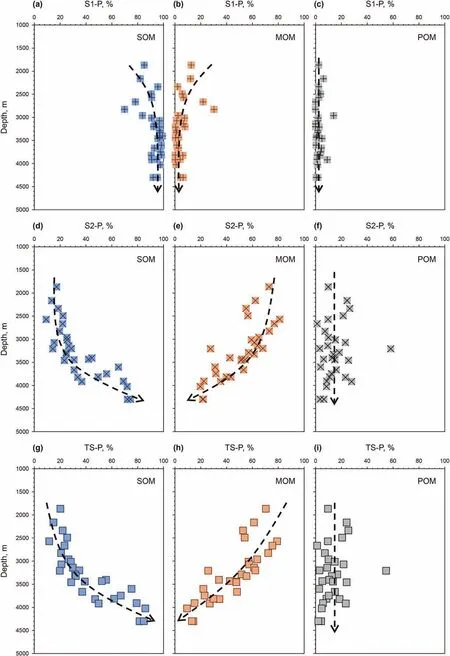
Fig. 7. Evolution of S1, S2, and TS of (a, d, g) SOM, (b, e, h) MOM, and (c, f, i) POM.
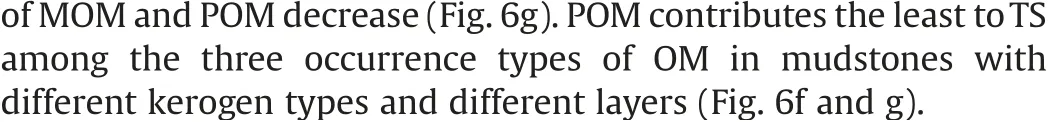
In the whole depth profile, S1 is mostly generated from SOM,while little is generated from MOM and POM(Fig.7a,b,c),which is consistent with the trend of the average S1-P content of OM with the three occurrence types mentioned above.S2-P of SOM increases and S2-P of MOM decreases with depth(Fig.7d and e).S2-P of most POM is less than 30% and has no evident change throughout the whole depth(Fig.7f).In addition,at depths less than 3500 m,the S2 content contributed by SOM is less than 30%,and MOM contributes more than 50% of S2. At depths deeper than 3500 m, SOMcontributed S2 increases, even to 80%, and MOM-contributed S2 decreases to 20%.These characteristics suggest that MOM plays the main role in S2 generation at shallow depths,and SOM makes the greatest contribution to S2 generation at deep depths. The evolutionary trend of TS-P is completely similar to that of S2-P(Fig.7g,h,i),which implies that MOM and SOM would be the main precursors of the total hydrocarbons in shallow and deep depths,respectively,and that POM contributes fewer hydrocarbons at the whole depth.
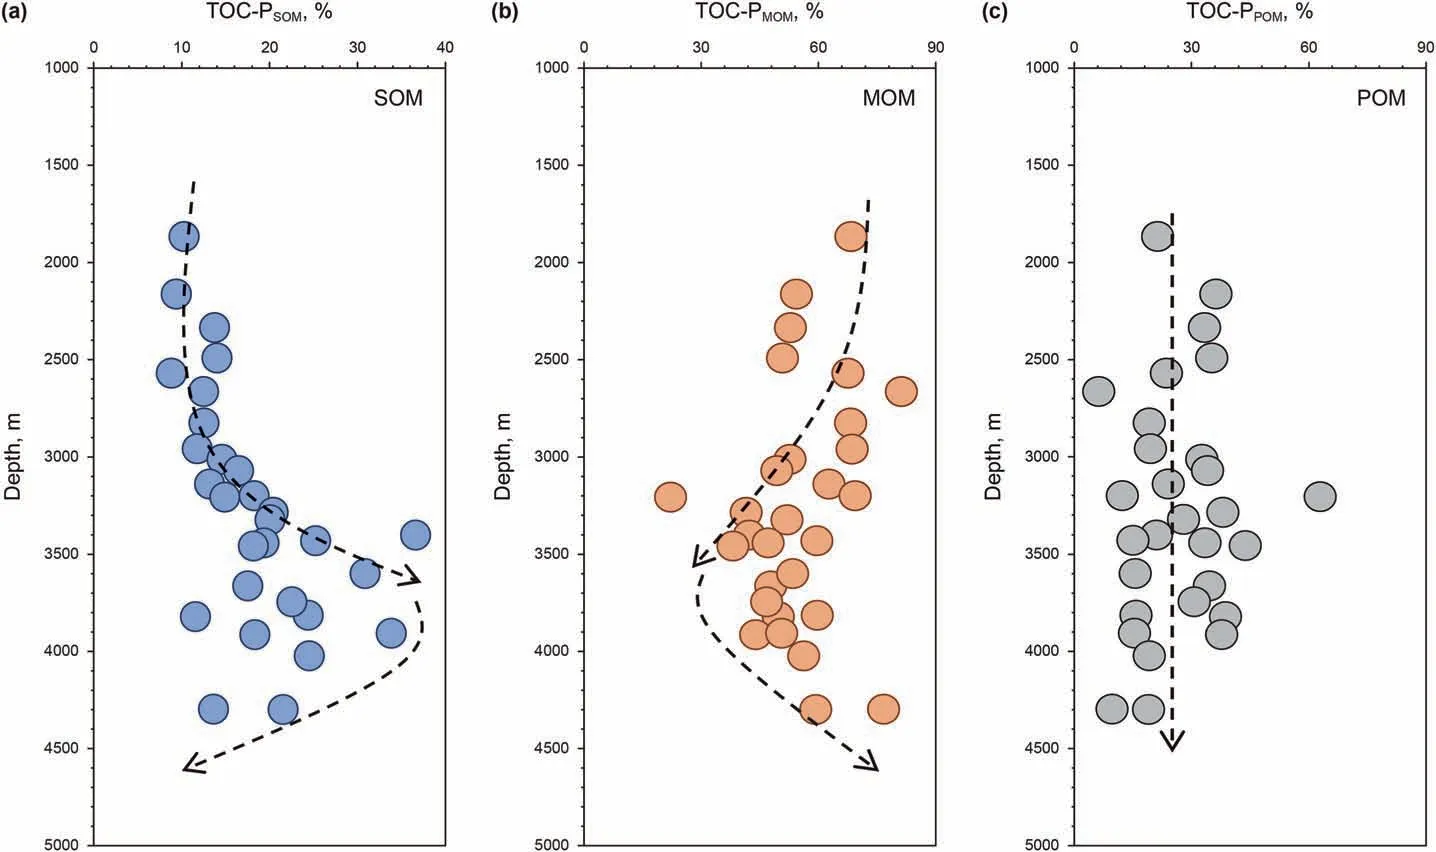
Fig. 8. Evolution of the relative abundance of (a) SOM, (b) MOM, and (c) POM.
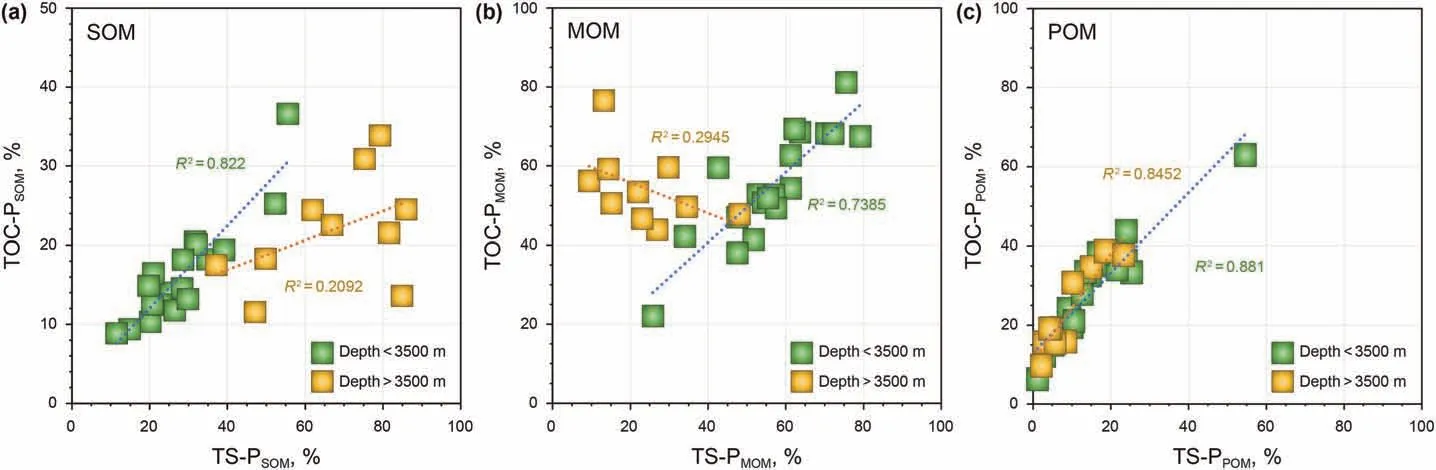
Fig. 9. Correlations of the relative abundance of OM and the relative hydrocarbon contents of OM with the three occurrence types: (a) SOM, (b) MOM, and (c) POM.
The abundance of each occurrence type of OM would be an important factor affecting the differences in hydrocarbon evolution.At depths less than 3500 m, the relative content of SOM increases and MOM decreases, which coincides with the evolution of SOMcontributed and MOM-contributed hydrocarbons (Fig. 7g and h and Fig.8a and b).TOC-P and TS-P also show a positive correlation for SOM and MOM, respectively (Fig. 9a and b). At depths deeper than 3500 m, the relative content of SOM decreases and MOM increases, which evolves oppositely to the TS-P of SOM and MOM(Fig. 7g and h and Fig. 8a and b), and the correlation of TOC-P and TS-P is poor for SOM and MOM(Fig.9a and b).This reveals that the abundance of SOM and MOM would be an important factor influencing the hydrocarbon content at shallow depths, while there must be other important factors that mainly influence the hydrocarbon content contributed by SOM and MOM in deep depths. As the TOC-P and TS-P of POM have the same evolutionary trend(Figs. 7i and 8c) and the two parameters have high correlations in both shallow and deep depths (Fig. 9c), the abundance of POM would also be an important factor in its hydrocarbon content.
5. Conclusions
This work quantified OM with the three types of occurrences,namely, SOM, MOM, and POM, in mudstones by using Soxhlet extraction and Na2S2O8oxidation sequentially and conducting Rock-Eval VI pyrolysis on the raw,extracted,and oxidized samples,respectively.

MOM-contributed hydrocarbons are numerous at shallow depths and decrease to nearly zero at greater depths; the trend for SOMcontributed hydrocarbons is in the other direction, with these hydrocarbons occurring at great depths;POM-contributed hydrocarbons show little change throughout the entire depth range. This demonstrates that MOM should be the main hydrocarbon precursor in shallow formations and that SOM is the main hydrocarbon contributor at deep depths.Moreover,the abundance of each occurrence type of OM is related to the local stratigraphy, and burial evolution plays a considerable role in thetransformationof each hydrocarbonprecursor.
Acknowledgement
This work was financially supported by the National Natural Science Foundation of China (Grant Nos. 41672115 and 41972126),and the National Science and Technology Major Project of China(Grant No.2016ZX05006001-003).
Appendix A. Supplementary data
Supplementary Data to this article can be found online at https://doi.org/10.1016/j.petsci.2022.02.006.
杂志排行
Petroleum Science的其它文章
- A fast space-time-domain Gaussian beam migration approach using the dominant frequency approximation
- Predicting gas-bearing distribution using DNN based on multicomponent seismic data: Quality evaluation using structural and fracture factors
- Reflection-based traveltime and waveform inversion with secondorder optimization
- Determination of dynamic capillary effect on two-phase flow in porous media: A perspective from various methods
- Settling behavior of spherical particles in eccentric annulus filled with viscous inelastic fluid
- Laboratory investigation on hydraulic fracture propagation in sandstone-mudstone-shale layers