Pore-based architecture and representative element volume evaluation in artificial sand packs and natural rock cores
2022-09-23PengFeiLvYuLiuFengLiuWenZheYngHnToLiuBoZhngYongChenSong
Peng-Fei Lv , Yu Liu , Feng Liu , Wen-Zhe Yng , Hn-To Liu , Bo Zhng ,Yong-Chen Song
a School of Energy and Power Engineering, North University of China, Taiyuan, Shanxi, 030051, China
b Key Laboratory of Ocean Energy Utilization and Energy Conservation of Ministry of Education,Dalian University of Technology,Dalian,Liaoning,116024,China
c Tianjin Refrigeration Technology Key Laboratory, Tianjin University of Commerce, Tianjin, 300134, China
d School of Chemical and Biological Engineering, Taiyuan University of Science and Technology, Taiyuan, Shanxi, 030024, China
Keywords:Pore structure REV Sand pack Rock core Pore network modelling
ABSTRACT The phenomenon of multiphase flow in porous media is confronted in various fields of science and industrial applications. Owing to the complicated porous structure, the flow mechanisms are still not completely resolved.A critical and fundamental question is the variation of pore structure and REV sizes among different types of porous media. In this study, a total of 22 porous samples were employed to systematically evaluate the pore-based architecture and REV sizes based on X-ray CT image analysis and pore network modelling. It is found that the irregular grain shapes give rise to large specific areas,narrow and thin throats in identical sand packs. The packs with more types of sands, or composited by the sands with larger difference in diameter,have larger specific area,smaller tortuosity and pore spaces.Based on the REV measurement through porosity solely,the REV sizes of sand packs are generally in the order of magnitude of 10-2 mL, while it is at least one order of magnitude smaller in rock cores. Our result indicates that the combination of porosity and Euler number is an effective indicator to get the REV sizes of porous samples.
1. Introduction
Transport in porous media is the central issue in many natural and industrial applications including CO2geological storage (Li et al., 2021), enhanced oil recovery (Fang et al., 2020; Fattahi Mehraban et al., 2020; Rezk et al., 2019), groundwater and contaminant migration (Schout et al., 2020), fuel cells (Xu et al.,2017), etc. However, the fluid flow mechanism inside porous media is complicated by the physical and geological properties of the fluid and porous matrix (Fan et al., 2019), among which the porebased architecture of porous media is one of the most fundamental factors (Cui et al., 2019; Ju et al., 2020; Liu et al., 2016). In order to upscale the flow performance effectively, a valid investigating scale, larger than the volume of representative elementary volumes (REV), should be selected (Al-Raoush and Papadopoulos,2010). Therefore, an advanced understanding of the geometrical characteristics and REV of porous media is of importance to accurately predict the fluid migration in field scales.
The porous space of a porous matrix can be quantified by several parameters such as pore sizes, throat radius, shape factors, porethroat ratios, and coordination number. These geometric factors significantly influence the evolution of fluid interface and petrophysical characteristics, which finally lead to different invasion patterns (Blunt, 2017; Chang et al., 2019). An intuitive way to determine these critical factors is using the digital images captured by X-ray CT machine.In many fields,the porosity and permeability of porous media are properties of key interest (Alhammadi et al.,2020; Armstrong et al., 2018). Various empirical or semiempirical functions between macro permeability and pore structure parameters have been set up by researchers based on experimental and simulation methods (Pape et al., 2000; Rumpf and Gupte, 1971). However, it has been reported that most of them cannot estimate permeability accurately for heterogeneous,anisotropy or low porosity systems. Also, they cannot be transferred from one to another rock type (Armstrong et al., 2018;Mostaghimi et al., 2013). In essence, the permeability of reservoir rocks is subject to the combined effects of multiple inherent properties of porous media (Li et al., 2019; Wang et al., 2017).Among all properties,the effect of pore-distribution heterogeneity,which can be evaluated by the specific surface area,tortuosity,and connectedness of pore space,was identified as the main reason for the failure of permeability estimation (Backeberg et al., 2017; Cai et al., 2019; Lucas et al., 2021; Slotte et al., 2020; Zakirov and Khramchenkov, 2020). Grain shape effects were also found to impact permeability variation(Katagiri et al.,2020).Different grain shapes lead to distinct permeability-porosity compaction trends(Torskaya et al., 2013). Thus, in order to establish valid and applicable models, it is essential and fundamental to comprehensively find the pore structure and connection characteristics, and the relations among structure parameters in different types of porous media. However, there is still little study which systematically addressed the relationship between porous skeleton and pore morphology (Liu et al., 2017). How the properties of porous structure vary and their interdependencies still remain unclear in different types of porous media.In recent years,Euler characteristic was introduced for geometric characterization of porous media. It provides a single value to quantify the bulk geometry of porous surfaces instead of quantities of specific local parameters.This may potentially provide a convenient framework for modelling and theoretical developments for different types of porous media(Armstrong et al., 2018).
Generally, the investigating porous volume should be larger than REV to ensure it can accurately reflect the overall microstructure and fluid percolation behavior in Darcy or field scale.The size of REV should be large enough and the macroscopic variables are not independent of the volume size any more.At REV scale,the local heterogeneity can be averaged and the next level of heterogeneity at a larger scale has not been reached.
Though the REV determination based on porosity and permeability analysis has been extensively investigated (Hilfer and Lemmer, 2015; Zhang et al., 2000), the results are inconsistent.The difference in definition strategies lead to different REV sizes(Rozenbaum and du Roscoat, 2014). Moreover, the REVs of important petrophysical properties such as permeability are not clearly understood(Armstrong et al.,2014).According to the studies from Martin Blunt’s research group in Imperial College London,the REV for permeability is larger than static properties (porosity and specific surface area),because it needs to account for the tortuosity and connectedness of the flow paths (Mostaghimi et al., 2013). The volume of porosity and capillary pressure REV is less than 2 mm3,while it is dependent from 3.4 to 157.5 mm3for saturation REV(Jackson et al.,2020).But this was only verified in sandstones.How the REV changes among different rock types still need to be further clarified.
Herein,both unconsolidated sand packs and natural sand cores with different grain shapes and pore structures were used in this study. The pore-based architecture and its variation among different rock types were systematically investigated based on Xray CT image analysis and pore network modelling. Series of characteristic parameters were introduced to comprehensively quantify the internal structure of rock cores. Meanwhile, REV determination was conducted in artificial and natural cores using different definitions. The purpose of this study is to find the intrinsic link of characteristic parameters and their variation regularity among the rock cores, as well as provide some useful information for REV selection.
2. Materials and methodology
2.1. Materials and apparatus
A total of 22 artificial unconsolidated sand packs and natural consolidated rock cores were employed in this study.Table 1 gives the composition and image resolution of each porous sample and Fig.1 illustrates the CT images of each porous sample used in this study. As for unconsolidated sand packs, the glass beads with spherical grain shapes and quartz sand with irregular grain shapes were used.Specifically,the ranges of grain diameters are 0.50-0.71 mm,0.35-0.50 mm and 0.18-0.25 mm for glass beads BZ06,BZ04 and BZ02 (Wang et al., 2017), while they are 0.75-0.88 mm,0.36-0.43 mm and 0.18-0.21 mm for quartz sand QZ20,QZ40 and QZ80 respectively. Thus, the grain size distribution between glass beads and quartz sands is similar, which is beneficial to compare the effects of grain shapes.The glass beads or quartz sand were put solely or multiply in a PEEK tube with the inner diameter of 7 mm to make sand packs with different porous structures. The sand packs were vibrated sufficiently using an oscillator to ensure the sand pack is compact and will not move during imaging.The sand packs can be divided into five groups: identical glass bead packs(BZ06, BZ04 and BZ02), identical quartz sand packs (QZ20, QZ40 and QZ80),multiple glass bead packs(BZ06+BZ04,BZ06+BZ02 and BZ06+BZ04+BZ02), multiple quartz sand packs (QZ20+QZ40,QZ20+QZ80 and QZ20+QZ40+QZ80) and mixed sand packs(BZ02+QZ40, BZ04+QZ40 and BZ04+QZ80). The identical sand packs were composed of single type glass beads or quartz sand.The multiple sand packs were made of two or three types of glass beads or quartz sand, while the mixed sand packs consist of both glass beads and quartz sand.
Seven consolidated rock cores with different pore structures,downloading from Digital Rocks Portal with permission(Prodanovic et al., 2015), were selected because of the high image resolution, which is beneficial to get accurate image processing results and REV sizes. The rock cores were separated into two groups. The first group owns a granular porous skeleton and its porous volume is homogeneous and well connected, including Berea core, Belgian fieldstone, Doddington sandstone and Ketton carbonate.We call them angular cores in this study.The skeleton of the second group is composed of silts, leading to heterogeneous porous space and abundance of micro and isolated pores. This group was named as silty cores and it includes Austin chalk,Estaillades carbonate and Savonni‵eres carbonate.
A micro-CT machine (InspeXio SMX-225CT, Shimadzu, Japan)was employed to perform pore-scale imaging analysis of the unconsolidated sand packs. The imaging procedures and parameter setting can be referred to our previous studies (Lv et al., 2017a,2017b). The reconstructed images of all porous samples were visualized and analyzed using Matlab(Math Works,Inc., USA)and an open-source software Fiji (Schindelin et al., 2012).
2.2. Synthetical analysis methods of pore structure and REV
Fig. 2 gives the workflow of pore structure and REV analysis in this study. The CT images of porous samples were first cropped to remove the useless voxels. The cropped images were segmented using machine learning algorism (Trainable Weka Segmentation),which has been proved to be an effective method for accurate segmentation (Arganda-Carreras et al., 2017). Finally, the segmented binary images were analyzed to get the characteristic parameters of porous structures.The parameters used in this study are listed as blow.
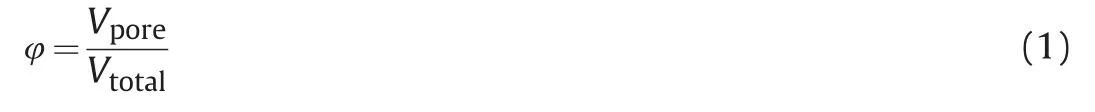
Porosity:porosity is the most fundamental property of a porous structure.It is calculated using the following equations,where φ isthe porosity, Vporeis the volume of pore spaces, and Vtotalis the volume of the whole porous sample.

Table 1 The porous samples used in this study.
It should be noted that the porosity of all samples is calculated based on binary CT images, which may be a little different compared to other methods and references.
Pore volume distribution and shape factors: the pore spaces were extracted from the binary images and computed the watershed basins on a Euclidian distance map of the pore spaces to isolate the pore spaces. The isolated pores were labeled and the volume was calculated using voxel data. The shape factor of each pore was calculated as:
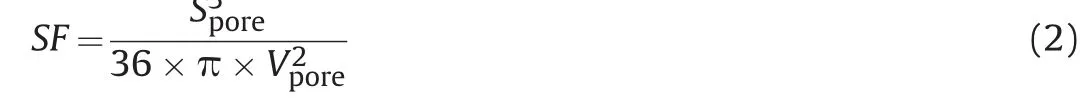
where Sporeis the internal area while Vporeis the volume of the pore spaces.The value of SF is 1 for a perfect sphere,while larger than 1 for irregular volume.
Specific area: the specific area is defined as the ratio of the internal surface area and internal volume. The unit is μm-1in this study. It is calculated as:

Pore-throat distribution and coordination number: the porenetwork model can be extracted from the images of isolated pores. The pore-throat distribution and coordination number of pores were obtained through pore-network modelling.
Because the REV size changes with different definitions,several parameters were employed to determine and recheck the REV sizes in different types of porous media. Specifically, four subvolumes were extracted from four corners of the porous bulk volume. The REV was first basically determined based on porosity measurement, the REV is defined as the volume when the porosity difference among four subvolumes is less than 1% and keep stable with increasing the subvolume sizes. Then the parameters of specific area, tortuosity and the topological invariant, Euler characteristic,which have a significant influence on permeability,were applied to recheck the REV size. Euler characteristic is a combination of the number of isolated objects (N ), cavities (O ) and redundant loops(L )of the porous volumes.It is independent of geometry meaning that how big or small things do not matter (McClure et al., 2020),which is defined as:

Finally, the variation of absolute permeability was used to examine the effectiveness of the above-mentioned parameters for REV determination. They were calculated based on the simulation of pore network modelling,an effective and computationally timesaving method to get the permeability data examined by a previous study (De Boever et al., 2016; Raeini et al., 2019).
3. Result and discussion
3.1. Pore structure characteristics in unconsolidated packs
Table 2 shows the general properties of each porous sample used in this study. In the unconsolidated identical sand packs, the porosity of glass bead packs is smaller than the quartz sand packs with similar grain size. As shown, the porosity of glass bead packs shows little change with the grain size decrease,ranging from 0.301 to 0.336. While it increases with grain size decrease in identical quartz sand packs,dropping from 0.449 to 0.362,which is different from our expectation.It indicates that the grain size is a key factor to predict porosity in the irregular sand packs while it has little influence on the regular sand packs.Unlike the change of porosity,the variation of specific area and tortuosity has a clear relation with the grain size in the identical sand packs, no matter whether the grain shape is regular or irregular. Specifically, the specific area increases while the tortuosity decreases with the grain size decrease in identical glass bead and quartz sand packs. Interestingly,the specific area of quartz sand packs is clearly larger than the glass bead packs with similar grain sizes. It is caused by the difference of grain shapes. The irregular quartz sands are more likely to form narrow and thin pore-throat spaces, leading to larger specific areas than the spherical glass bead packs.
Fig.4 and Fig.S1(Supporting Information)give the statistics of pore characteristics of the identical glass bead and quartz sand packs,respectively.As shown,the magnitude of most pore volumes is at 10-2mm-3, which is in the same order of magnitude as the grains of sand. The irregular quartz sand packs form a broader range of pore sizes (0.01-0.5 mm-3) than the regular glass bead packs(0.01-0.1 mm-3)under the similar grain size condition.The range of throat radius of quartz sand packs(0-420 μm)is two times wider than glass bead packs(0-210 μm).The difference illustrates that the irregular grain shape gives rise to more complex space,both volume and geometrical shape,than the spherical sands.It is also indicated by the wider distribution of shape factor and pore coordination number in the identical quartz sand packs. As demonstrated by the figures, the pore spaces become smaller and more complicated with the grain diameter decrease in identical glass bead and quartz sand packs, indicated by the compact distributions of pore volume, throat radius, throat length, and the scattered distributions of pore shape factor and coordination number in BZ02 and QZ80 packs.
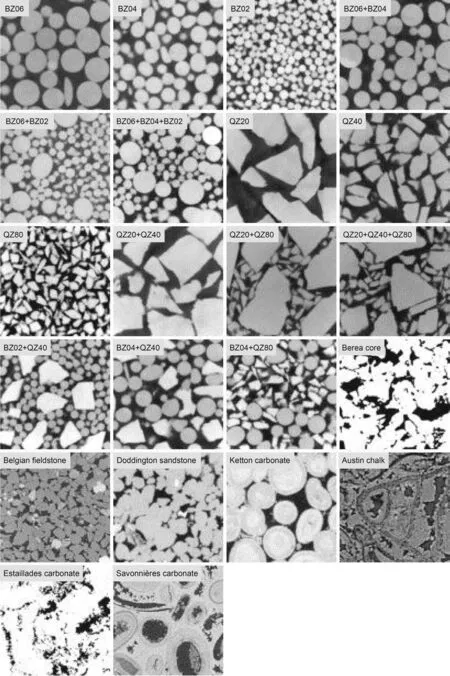
Fig.1. The CT images of the porous samples used in this study.
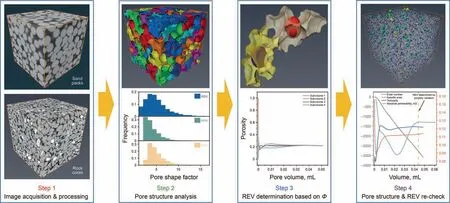
Fig. 2. Workflow of the pore structure and REV analysis.
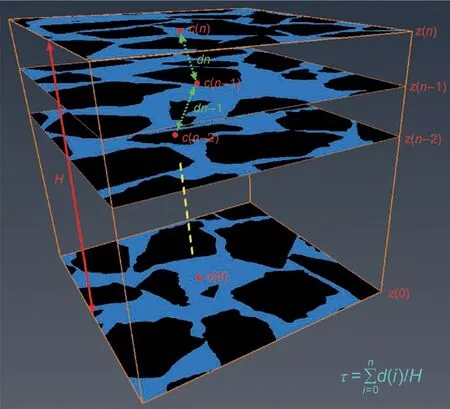
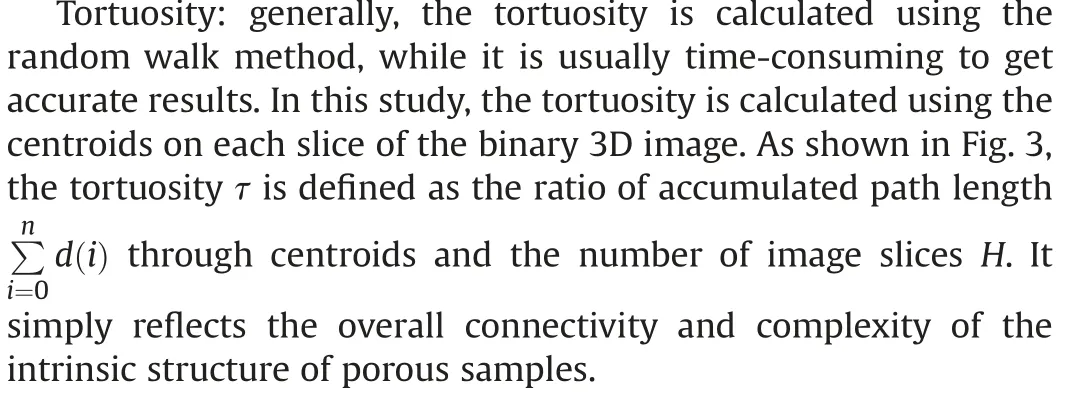
Fig. 3. An illustration of the tortuosity of pore structures.
While in the multiple and mixed sand packs, as illustrated in Table 1, the porosity is generally smaller than the identical sand packs.A main reason is that the pore spaces formed by a single type of sands can be filled by the sands with different shapes or sizes,decreasing the pore space of cores.It is particularly obvious for the mixed sand packs, which indicates that the different shapes of grains can effectively fill the core space and decrease the porous volume.The packs with more types of sands,or composited by the sands with larger difference in diameter, have larger specific area and smaller tortuosity,which is similar to the effects of grain sizes in identical sand packs.Figs.S2-S3 give the statistics of pore-throat characteristics of different multiple sand packs. Specifically, the packs formed by more types or smaller grain sizes generally give rise to smaller pore spaces,which also lead to shorter throat radius.This was illustrated by the subfigures of pore volume and throat radius in Figs. S2 and S3. The grain sizes and types of sand also impact the shapes of pores. More sand types and larger difference in grain sizes generate more shapes of pore spaces, illustrated by the subfigure of pore shape factor distribution. However, the distribution of pore coordination number is similar among different packs,indicating the grain size or sand type has little influence on the connectivity of pore spaces in multiple packs.In the mixed sand packs,as shown in Fig.S4,the BZ04+QZ40 pack,which is composed by the glass beads and quartz sands with similar grain sizes, has wider distributions in pore volume,throat radius and throat length than BZ02+QZ40 and BZ04+QZ80, while there is no clear difference in pore shape factor and coordination number distributions among these packs. It demonstrates that the difference of grain sizes mainly impacts the pore volumes but has little effects on geometric structure in the mixed sand packs.
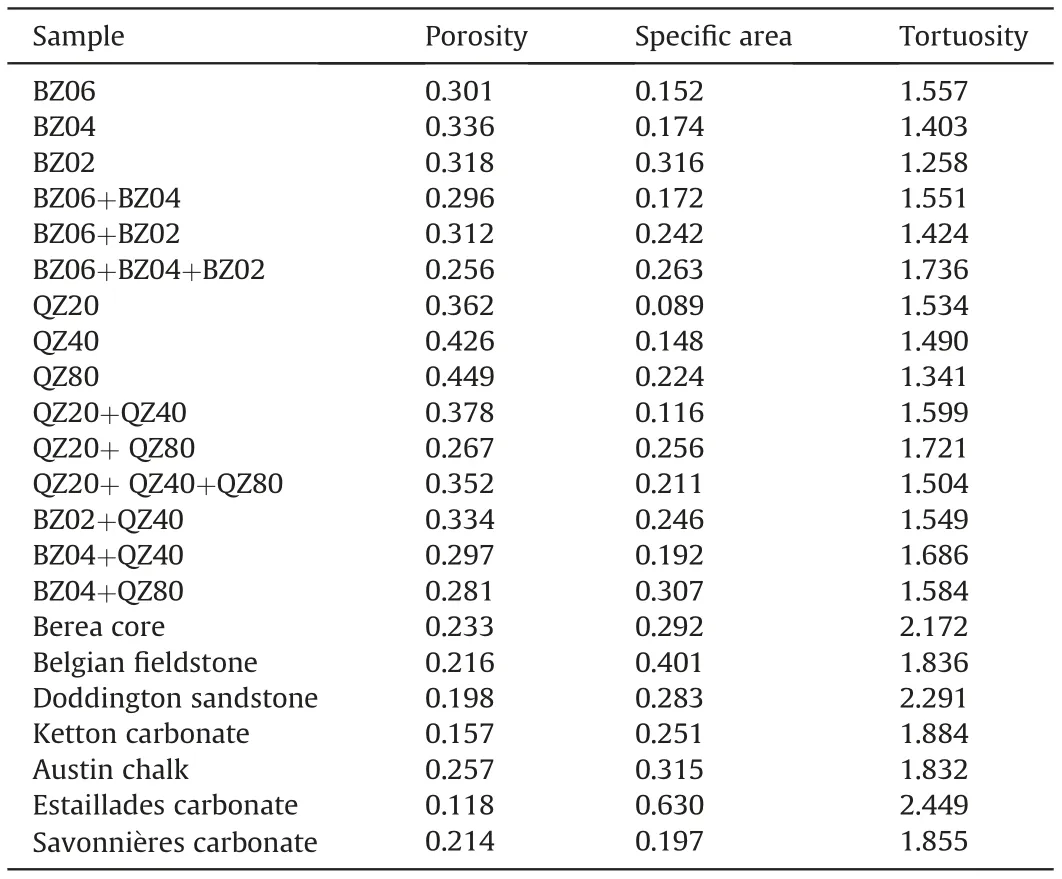
Table 2 The general properties of each porous sample.
3.2. Pore structure characteristics in consolidated rock cores
Generally, the porosity of consolidated rock cores is obviously lower(smaller than 0.25)while the specific area and tortuosity are larger than unconsolidated sand packs. It means that the fluid interacts with the porous surface more sufficiently in rock cores than sand packs.Accordingly,the effects of wettability and capillarity are more significant in rock cores,leading to different fluid percolation properties and REV sizes between rock cores and sand packs.Another significant difference between rock cores and sand packs is that, as shown in Fig. 5, the porous volumes involve quantities of micro and isolated pores in rock cores, especially for silty cores.These pores contribute to the total porosity but have little effect on the fluid invasion.
Figs. S5-S6 demonstrate the statistics of pore-throat characteristics of angular and silty rock cores,respectively.As shown,the pore volume of angular rock cores is at least one order magnitude smaller than the sand packs, along with the shorter throat radius and length. The shape factor and coordination number are also generally smaller in rock cores. This phenomenon is more remarkable in silty rock cores. The distribution of pore volume is centralized and is at least 3 order magnitude smaller than sand packs.The shape factor and coordination number are less than 5 in most pore spaces. A possible reason causing the different pore characteristics between rock cores and sand packs is that there is a number of micro and isolated pores in the rock cores,especially in silty rock cores. The irregularity of micro pores can be ignored subjected to the resolution of CT images and result in small values of shape factors.While the existence of isolated pores accounts for the small coordination number because of their poor connectivity.The results demonstrate that the difference of the pore characteristics between rock cores and sand packs is not only the pore-throat sizes,but also the shapes and connectivity.It should be very careful when we choose sand packs to replace rock cores to investigate the properties of fluid invasion in porous media.
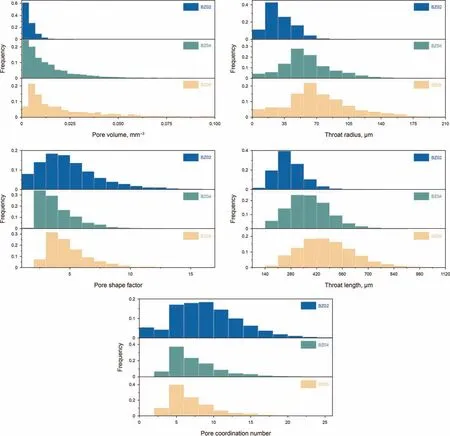
Fig. 4. Statistics of pore-throat characteristics of identical glass bead packs.

Fig. 5. An illustration of the porous spaces in rock cores. A connectivity analysis was performed to get the individual objects in the entire 3D volume. Each object was assigned a different consecutive value. The isolated pores (based on volume) were labeled as colorful patches while the connected pores were labeled with gray color.
3.3. REV determination and comparison
Table 3 gives the REV sizes of the sand packs and rock cores based on porosity measurement. Figs. S7-S8 provide the porosity variation with volume increase in four subvolumes of each sand pack and rock core sample. In the sand packs, the REV sizes are always in the order of magnitude of 10-2mL except the sample of BZ06+BZ04, ranging from 0.1 to 0.6 mL. It is clear that the REVvolume becomes small gradually with grain size decrease in identical glass bead and quartz sand packs.The grain shape impacts the REV sizes when the grain size is large,which can be shown from the difference of REV sizes between BZ06 and QZ20.However,the grain shape shows no obvious effect on REV sizes when the grain diameter changes small to 0.4 mm and 0.2 mm. The REV sizes of multiple sand packs are generally larger than the identical sand packs with similar average grain sizes.While the REV sizes of mixed sand packs, made by spherical glass beads and irregular quartz sands, keep stable around a small value of 0.02 mL, indicating similar porosity distributions among the three packs. As shown in Fig.S7,the porosity of subvolumes reach steady states with smaller pore volumes in glass bead and mixed sand packs than quartz sand packs, which illustrates that spherical sands or regular-irregular sand mixing is a good way to make homogenous sand packs,especially in the case of large grain diameter.
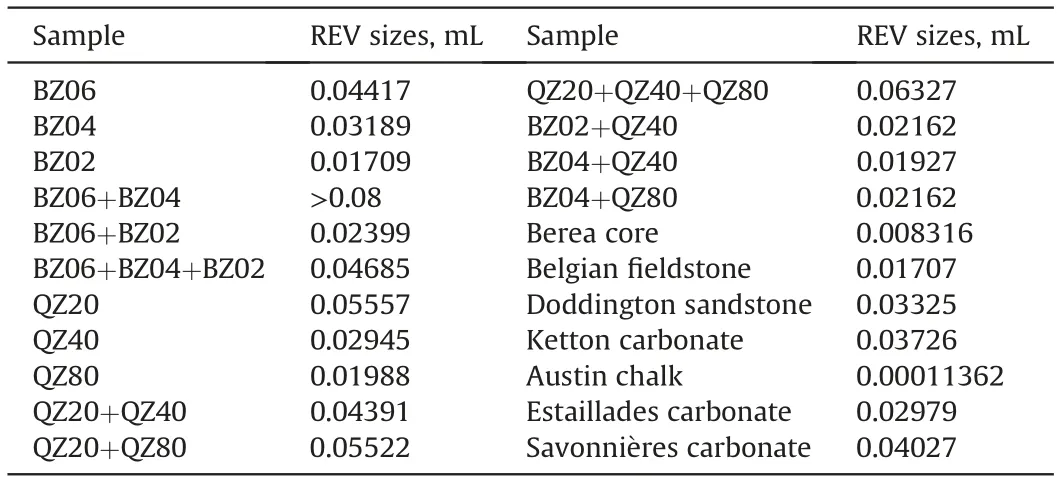
Table 3 REV determination based on porosity variation.
Based on the measurement of porosity variation, all the rock cores in this study own a definite REV size, including both homogenous angular cores and heterogeneous silty cores. Their REV sizes range from 0.0001 to 0.04 mL,at least one order of magnitude smaller than the sand packs.As indicated in Fig.S8,the porosity of angular rock cores reaches a steady state quickly with the volume increase,except Ketton carbonates,because of its large grain sizes.The speed of reaching steady state slows down in silty rock cores,owing to the influence of heterogeneity.
However, REV determined by porosity was reported that it is inaccurate sometimes. Thus, this study also introduces other parameters, including specific area, tortuosity and Euler number, to check their effectiveness on REV determination. Absolute permeability is employed as the evaluation criterion for these parameters,which is one of the most critical parameters for fluid flow in porous media.Fig.6 and S9-S11 give the variation of Euler number,specific area, tortuosity and absolute permeability with pore volumes in glass bead packs, quartz sand packs, mixed sand packs and rock cores, respectively. The REV sizes determined by porosity are also indicated by the dotted line in the figures. The Euler number monotonously decreases with volume increase because more connected pore spaces are contained, except Savonni‵eres carbonate, which includes quantities of isolated micro pores, increasing component N of Euler number.Thus,we cannot get REV sizes from the change of Euler number.However,it is found that the variation of Euler number is perfect straight lines in homogenous porous samples.The linearity is larger than 95%with pore volume increase,while it is weakened by porosity heterogeneity in some sand packs with large grain sizes or mixed grain sizes (such as BZ06,BZ06+BZ04, QZ20, etc.) and silty rock cores. Thus, the linearity of the Euler number is a good indicator to determine the heterogeneity of porosity and pore interconnectivity.
Generally, the specific area is the first parameter to reach the steady state, which is followed by absolute permeability and tortuosity.Moreover,the specific area can even reach a steady state in heterogeneous porous samples (Estaillades carbonate and Savonni‵eres carbonate), illustrating the inaccuracy of REV determination by specific area. The steady-state volume of tortuosity sometimes is larger than the steady-state volume of absolute permeability, which is out of our expectation. A possible reason is the tortuosity measurement method,which is calculated by the CT image centroid.It can be significantly influenced by the large grain sizes in small porous volumes. Interestingly, we found that the absolute permeability can generally reach the steady state at the REV volume determined by porosity in most porous samples.Thus,it is possible to measure REV volumes by porosity calculation rather than heavy workload absolute permeability measurement. Based on the analysis of porosity and other parameters,the most effective and accurate REV measurement method is the combination of porosity and Euler number. The variation of the Euler number can be firstly employed to check the homogeneity of porous media through its linearity, then porosity is used to determine the REV sizes.
4. Conclusion
In this study,different types of sand packs and rock cores were employed to systematically investigate the pore structure characteristics and REV sizes at the pore scale. The porous structure was quantitatively analyzed by pore-throat volume and length distribution,shape factor and coordination number,while the REV sizes were first measured by porosity variation and rechecked by other parameters. The following are the main findings in this study.
In identical sand packs, the grain size is a key factor to control porosity in the irregular sand packs while it has little influence in the regular sand packs.The specific area of pore volumes increases while the tortuosity decreases with the grain sizes decrease.While in the multiple and mixed sand packs,the packs with more types of sands, or composited by the sands with larger difference in diameter, have larger specific area, smaller tortuosity and pore spaces.However, it has little effect on the connectivity of pore spaces.
The difference between sand packs and rock cores not only includes porosity and pore sizes, but also the pore shapes and pore connectivity.It should be very careful when we choose sand packs to substitute rock cores to investigate the properties of fluid invasion in porous media.
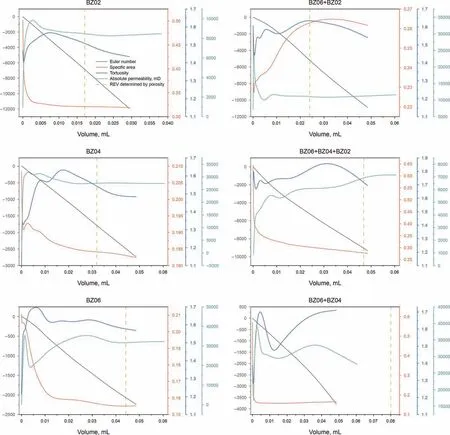
Fig. 6. Euler number, specific area, tortuosity and absolute permeability variation with pore volume in glass bead packs.
Based on the REV measurement through porosity,the REV sizes of sand packs are generally in the order of magnitude of 10-2mL,while it is at least one order of magnitude smaller in rock cores.The combination of porosity and Euler number is a good indicator to effectively get the REV sizes of porous samples, which can be a substitute for complicated permeability measurement.
The influence of mineral composition on REV sizes was not considered here. The following study will conduct two phase flow experiments and simulations to inspect the effects of wettability on REV sizes.Also,the applicability of the REV determination method was not examined by unconventional reservoirs such as shale and coal seam,which are highly heterogenous and anisotropic because of the existence of aperture,spacing and fracture sets.It needs to be further investigated in the future.
Acknowledgement
This study was supported by National Natural Science Foundation of China (Grant No. 52106213, 51876015), Shanxi Scholarship Council of China(2020-116).The first author was also supported by the Key Laboratory of Ocean Energy Utilization and Energy Conservation of Ministry of Education (LOEC-201903) and the Science Foundation of North University of China (XJJ201907).
Appendix A. Supplementary data
Supplementary data to this article can be found online at https://doi.org/10.1016/j.petsci.2022.03.002.
杂志排行

Petroleum Science的其它文章
- A fast space-time-domain Gaussian beam migration approach using the dominant frequency approximation
- Predicting gas-bearing distribution using DNN based on multicomponent seismic data: Quality evaluation using structural and fracture factors
- Reflection-based traveltime and waveform inversion with secondorder optimization
- Determination of dynamic capillary effect on two-phase flow in porous media: A perspective from various methods
- Settling behavior of spherical particles in eccentric annulus filled with viscous inelastic fluid
- Laboratory investigation on hydraulic fracture propagation in sandstone-mudstone-shale layers