The key parameter of shale oil resource evaluation: Oil content
2022-09-23MinWangMingLiJinBuLiLiangXuJinXuZhang
Min Wang , Ming Li , Jin-Bu Li , Liang Xu , Jin-Xu Zhang
a State Key Laboratory of Shale Oil and Gas Enrichment Mechanisms and Effective Development, Beijing,102206, China
b SINOPEC Key Laboratory of Petroleum Accumulation Mechanisms, Wuxi, Jiangsu 214126, China
c Shandong Provincial Key Laboratory of Deep Oil and Gas, Qingdao, Shandong 266580, China
d School of Geoscience, China University of Petroleum (East China), Qingdao, Shandong 266580, China
Keywords:Shale oil Oil content Oil saturation Light hydrocarbon recovery Resource evaluation
ABSTRACT The United States has become the world's largest oil producer of shale oil. China has abundant shale oil resources,but its resource potential has not yet been exploited.The core of the evaluation is the selection of parameters and their reliability.By combining the parameters of the shale oil resource evaluation,we investigated the key parameters in the evaluation model and reviewed the research results. The adsorption and retention of heavy hydrocarbons, loss of light hydrocarbons, and original oil saturation are key in the evaluation of shale oil resources.The adsorption and retention of heavy hydrocarbons can be determined by the pyrolysis,FID curve,and hydrocarbon generation kinetics of shale before and after extraction.The loss of light hydrocarbons mainly occurs in coring(change in temperature and pressure),sample treatment, which can be evaluated using the GC spectrum, rock pyrolysis, crude oil volume coefficient, mass balance, component hydrocarbon generation kinetics, and other methods. The original oil saturation evaluation includes indirect, direct, logging, and simulation methods. The most reliable parameters can be obtained by using the sealed or pressure-maintained coring immediately after thawing (without crushing), and the recovery of light hydrocarbon loss is critical for the resource evaluation of medium to high mature shale. Therefore, the experimental determination of shale oil content and the study of the influencing factors of the parameters should be strengthened.
1. Introduction
The successful exploration and development of unconventional oil and gas (especially shale oil and shale gas) has changed the world's energy map.The United States has become a net exporter of natural gas, and external dependence on crude oil has decreased from 62.7%in 2010 to 18%in 2018,which makes it independent by 2023. In 2020, China's crude oil output was 195 million tons and imports were 543 million tons. China's external dependence exceeds 73%, thereby seriously threatening its energy security. Shale oil is liquid oil that exists in shale and its thin interlayer(siltstone,dolomite, limestone, or tuff) in free and adsorbed hydrocarbons,excluding oil shale, which is man-made oil obtained by cracking organic matter/kerogen in the shale through superheating cracking, hydrogenation catalysis, or thermal distillation. Shale oil relies on natural or artificial fractures (fracturing technology) to obtain industrial production. According to the scale of interlayers and fractures, these can be divided into tight, fracture, and mixed types (Jarvie and Breyer, 2012b; Wang et al., 2015a).
Kuuskraa et al. (2013) estimate that China's shale oil resources are 32 billion barrels,ranking third in the world.In 2014,SINOPEC evaluated the geological resources of shale oil in its exploration area to be approximately 20.4 billion. PetroChina estimated approximately 14.5 billion tons in 2016 within its exploration area.The Ministry of Land and Resources evaluated the geological resources of shale oil in China to be 15.3 billion tons in 2016,while the Ministry of Natural Resources determined an estimate of 21.4 billion tons in 2019. Zou et al. (2013) suggested that continental shale oil in China is continuously accumulated in the center of the lake basin, and the technically recoverable resources are approximately 30 × 108-60 × 108tons. An evaluation by Lu et al. (2016)determined that the total amount of oil retained in shale is as high as 88 × 108tons in the Bonan Sag, with an area of less than 1,000 km2in the Shengli Oilfield.The total amount of oil retained in shale in the Qingshankou Formation of the Qijia-Gulong Sag in the Daqing Oilfield is as high as 146×108tons,and the total amount of oil retained in shale in the first member of the Qingshankou Formation in the Jilin Oilfield is as high as 156×108tons.Shale oil has been produced in the Lucaogou Formation of the Jimusaer Depression in the Junggar Basin,and shale oil flow has been seen in many eastern basins in China,especially in the Shahejie Formation in the Jiyang Depression of the Bohai Bay Basin. Industrial oil flow has been observed in more than 40 wells.High-yield shale oil flow has also been obtained in the second member of the Kongdian Formation in the Huanghua Depression. Shale oil is also produced in the first member of the Cretaceous Qingshankou Formation in the Gulong Sag,Songliao Basin.At present,the shale oil reserves of the Xinjiang Oilfield, Changqing Oilfield,and Dagang Oilfield are 4 billion tons,exhibiting a great exploration prospect of shale oil(Hu et al. 2018, 2021a, 2021b; Liu et al. 2019, 2021; Wang et al. 2019a,2019b; Song et al., 2020; Zhao et al., 2020b).
Shale oil resources evaluated by different institutions or scholars vary greatly. Based on a comparative analysis of the shale oil resource evaluation methods, this paper discusses the key parameters of the model (particularly, oil content) and reviews the problems encountered in obtaining oil content to benefit shale oil resource evaluations.
2. Evaluation methods of shale oil resources
In principle,both the analogy method and the statistical method can be used for shale oil resource evaluations, but the analogy method requires a scale area with a higher degree of exploration,similar to the geological conditions of the study area, while the statistical method requires a certain number of production data.For continental shale oil,which has not been significantly produced in China,the analogy method and statistical method lack comparable and reference objects (the marine shale in North America is not suitable for analogy because of the considerable difference in geology). For example, the FORSPAN method is suitable for the prediction of the remaining recoverable capacity of the developed units, which requires substantial drilling and well data. The idea and objective of the genetic method in conventional oil and gas resource evaluations are different from the needs of shale oil evaluations. The former focuses on the evaluation of the hydrocarbon generation, expulsion, and accumulation coefficient, while the latter focuses on the evaluation of residual hydrocarbons.However, the volume method based on hydrocarbon generation can be used to evaluate shale oil resources.It is a method to obtain shale oil resources by evaluating the residual hydrocarbon content in shale and multiplying this by the shale volume, which is currently the most effective and applicable method. The data of pyrolysis S1and chloroform asphalt“A"used in the volume method are exceptionally abundant, which makes this method the most basic method for shale oil evaluation in China.
Lu et al. (2012), Liu et al. (2013), Yang et al. (2013) and Lu et al.(2017)evaluated the shale oil resources of the Ordos Basin, Malang Sag, Bonan Sag, Dongpu Depression, and Damintun Sag using the volume method.In addition,the mass balance method(residual hydrocarbon=originalhydrocarbon generation-expulsion-pyrolysis hydrocarbon) is also a feasible evaluation method for target areas with abundant shale geochemical parameters. For example, Chen et al. (2020) used the mass balance method to evaluate the shale/tight oil resources of the Lucaogou Formation in the Jimusaer Depression. However, the values of some parameters, such as hydrocarbon expulsion threshold, hydrocarbon generation conversion rate, and hydrocarbon expulsion efficiency involved in the mass balance method are empirical (determined according to the envelope),which increases the uncertainty of the evaluation results.
2.1. Chloroform asphalt “A" method
Chloroform asphalt “A" reflects the content of soluble organic matter in sedimentary rocks, which is usually expressed as a percentage of the rock mass.As a comprehensive result of hydrocarbon generation and expulsion, chloroform asphalt “A" essentially reflects the amount of residual oil in source rocks. Therefore, it is more appropriate to use the index of chloroform asphalt “A" to evaluate the residual oil of the source rocks.
The shale oil content is calculated using the original chloroform asphalt “A" as follows:

where: V = shale volume, m3; ρ = shale density, t/m3;A = chloroform asphalt “A" content, %; ka= light hydrocarbon correction factor of the chloroform asphalt “A”.
Chloroform asphalt “A" is a common index in conventional oil and gas exploration. Its analysis method is mature, and basic data are rich.Because the composition of chloroform asphalt“A"is close to that of crude oil, it can better represent the oil content in the shale, and the amount of the sample required for the chloroform asphalt “A" experiment is large, which can better eliminate the problem of shale heterogeneity. The existing problem is that the light hydrocarbon is completely lost due to the sample drying,crushing, and extract concentration in the chloroform asphalt “A"experiment, so a light hydrocarbon correction is needed.
2.2. Pyrolysis S1 method
Rock pyrolysis S1is in the free state (mg HC/g rock), which evaporates before 300°C during pyrolysis heating. It is the hydrocarbon that has been generated in the source rock but has not been discharged, which is the target of shale oil evaluation and exploration.The principle and method of calculating the shale oil volume are the same as using original chloroform bitumen “A”.
The formula for calculating the shale oil content using S1is as follows:

where: V = shale volume, m3; ρ = shale density, t/m3; S1= rock pyrolysis S1content,kg/t;klh=light hydrocarbon correction factor of S1; khh= heavy hydrocarbon correction factor of S1.
Pyrolysis is one of the common analysis methods used in conventional oil and gas exploration and has the advantages of mature technology,high accuracy,economy,low sample consumption,and convenient acquisition. Therefore, Eq. (2) has become the most widely used method for shale oil resource evaluations. The pyrolysis S1value is greatly affected by the preservation of the core in the later stages. For the same sample, the pyrolysis S1value of a fresh sample is 1.5-2.0 times that of the sample stored at room temperature for one month (light hydrocarbon loss) (Zhang et al.,2012), so Eq. (2) contains a light hydrocarbon correction coefficient.In addition,there is a part of the soluble hydrocarbon(heavy hydrocarbon retention) in pyrolysis S2, which also contributes to shale oil. Therefore, a heavy hydrocarbon correction coefficient should also be considered.
2.3. Oil saturation method
The oil saturation method refers to the reserve calculation method in conventional oil and gas exploration,and the formula is as follows:

where:Qo= reserves of shale oil,104t; A =oil-bearing area,km3;h = effective thickness of shale, m; φ = effective porosity, %;So= original oil saturation, %; ρ = oil density, t/m3; Boi= volume coefficient of oil.
In principle, the oil saturation method is the closest to the reserve calculation in conventional oil and gas exploration. However, few data about porosity and oil saturation are available, and the measurement accuracy of these parameters is greatly affected by other factors. Many measurement methods for porosity and oil saturation have higher requirements for the cores, such as the sample size, development degree of the lamina or fracture,subsequent preservation, and content of soluble organic matter in the shale, which limits the use of this method.
2.4. Key parameters of shale oil resource evaluation
It can be seen from Eqs.(1)-(3)that the parameters involved in evaluating shale oil resources by volume method include shale volume, density, oil content, correction coefficient of light hydrocarbons and heavy hydrocarbons,oil saturation,and porosity.Shale volume (effective distribution area × thickness) controls the distribution range of shale oil and is an essential parameter for determining the total amount of resources. These two parameters are easy to obtain through mud logging, well logging, or seismic data.The density of shale is similar at a certain depth range,and it is easy to obtain by density logging.
The oil content(S1or chloroform asphalt“A")can be determined by geochemical experiments,and there are many such data for the exploration areas,but the oil content has strong heterogeneity with vertical and horizontal changes. More importantly, shale samples are prone to hydrocarbon loss in the process of storage,processing,and experiment, and the lost hydrocarbon flows more easily.Therefore, the oil content (S1or chloroform asphalt “A") and correction factors have a considerable impact on shale oil resource evaluation. These are the key parameters of the evaluation, especially the correction factors of the oil content. In recent years, Lu's team has carried out many effective studies on shale oil heterogeneity evaluations(Lu et al.,2017).A shale heterogeneity evaluation can be achieved using logging data and △log-R methods. The measurement accuracy of porosity and oil saturation is greatly affected by other factors,and the measurement method has higher core requirements.Although there are no reports on the use of the oil saturation method to evaluate shale oil resources,this paper also reviews the research on shale oil saturation.
For different states of hydrocarbon in shale, including free oil,adsorbed oil on mineral surface and absorbed oil in kerogen,many experimental methods are used to quantify corresponding content(Wang et al.,2015b;Romero-Sarmiento,2019;Wang et al.,2019a;Li et al., 2020b; Zhang et al., 2020). It should be noted that the oil obtained from the corrected pyrolysis S1and chloroform asphalt“A" is free oil and partially adsorbed oil. The heating temperature determines whether hydrocarbon belongs to free or adsorbed oil,and the extraction mainly determines the free oil.
3. Research of S1 correction
S1is the hydrocarbon volatilized when the rock sample is heated to 300°C using the Rock-Eval instrument. It is basically C7-C33,which is a hydrocarbon that has been generated but not discharged.It is also called free hydrocarbon, or residual hydrocarbon in the rock, which can indicate the oil content of the shale. Notably, the samples used for the pyrolysis experiment are often placed in the core bank for an extended time,during which there are many losses(called light hydrocarbon loss) in the gas hydrocarbons (C1-5) and light hydrocarbons (C6-13). Previous studies have demonstrated that there are previously generated liquid hydrocarbons in S2(pyrolysis hydrocarbon) that have large molecular weight and do not evaporate before 300°C (Jarvie and Breyer, 2012a), but remain in the pores or are adsorbed on the organic matter, that is, kerogen adsorbed hydrocarbon (also known as heavy hydrocarbon).Therefore, the retained hydrocarbon should consist of three parts:1) measured S1, 2) small molecular hydrocarbons lost before pyrolysis experiment, and 3) previously generated liquid hydrocarbons (ΔS2) entering S2(Fig. 1). Therefore, shale oil resource evaluations need to include light hydrocarbon and heavy hydrocarbon corrections for S1.
3.1. Correction of heavy hydrocarbon
The comparison of pyrolysis between the extracted and unextracted samples can effectively correct for heavy hydrocarbons,such as the comparison of pyrolysis parameters of the shale before and after extraction, comparison of the pyrolysis FID curves before and after extraction, and the hydrocarbon generation kinetic parameters of the shale organic matter before and after extraction.
Wang and Zheng(1987)found that a considerable proportion of hydrocarbons in chloroform asphalt “A" entered S2through pyrolysis of chloroform asphalt“A"from the source rock,indicating that the measured value of S1was small, and the correction coefficient was 1.82(Fig.2a).Jarvie and Breyer(2012a)demonstrated that the amount of hydrocarbon adsorbed by kerogen can reach 2-3 times that of S1(Fig. 2b). Wang et al. (2014) analyzed the relationship between the amount of hydrocarbon adsorbed by kerogen and S1in the shales(72 samples)of the Bohai Bay Basin,Songliao Basin,and Sichuan Basin by pyrolysis before and after extraction and found that the amount of hydrocarbon adsorbed by kerogen was 2.22 times of that of S1(Fig.2c).Han et al.(2015)conducted pyrolysis on the Barnett shale before and after extraction and concluded that the S2of the shale samples after extraction was significantly lower than that before extraction(S2extracted=0.8551×S2unextracted-1.7179).Li et al.(2019b)determined the temperature threshold(Tok)of the heavy hydrocarbon thermal release and kerogen pyrolysis by comparing the pyrolysis FID curves of the shale samples before and after extraction and then established a method to evaluate the heavy hydrocarbon content(S2oil)using conventional pyrolysis FID curves. Chen et al. (2018b, 2019) analyzed the pyrolysis kinetics of shale before and after extraction, obtained the kinetic parameters of the heavy hydrocarbon thermal release and kerogen pyrolysis,and quantitatively evaluated the kerogen adsorption hydrocarbons.
The adsorption of heavy hydrocarbons is related to the organic matter content. For example, approximately 10% of the kerogen in organic-rich shale adsorbs hydrocarbons, while 50% of the soluble organic matter in the Monterey shale is adsorbed by kerogen(Jarvie and Breyer, 2012b; Jarvie, 2014). In addition, the adsorption of heavy hydrocarbons decreases with an increase in the organic matter maturity. Li et al. (2016) studied the shale of the Shahejie Formation in the Jiyang Depression,Bohai Bay Basin,and found that the hydrocarbon adsorption capacity of kerogen gradually decreased with an increase in the kerogen maturity.For adsorption and solubility, the amount of hydrocarbon adsorbed by kerogen should be determined by the composition of the oil and the adsorption and solubility of the kerogen.However,when kerogen is in the peak stage of gas generation, the competitive adsorption of gas and crude oil in kerogen may cause a sharp decline in the amount of adsorbed heavy hydrocarbons. Considering that adsorbed heavy hydrocarbons do not flow easily,they contribute little to the productivity of shale oil, and the evaluation method is simple and mature; therefore, this paper will not focus on this.
3.2. Light hydrocarbon correction
Affected by the sample storage conditions, crushing, and the waiting time (about 3 min) of the Rock-Eval 6 experiment, the S1value measured in the laboratory is often much lower than the actual value of the formation because of the loss of small molecular hydrocarbons. This loss consists of two parts: 1) the temperature and pressure change from underground to the surface,resulting in the release of small molecular hydrocarbons;2)storage in the core bank and laboratories, pre-experiment processing (such as crushing), and waiting for sample injection, among others. Jarvie et al.(2012, 2014) found that the loss of light hydrocarbons (up to C10)depends largely on the abundance of organic matter,lithofacies,oil properties,sample size,and storage methods.The loss amount is up to 35% (correction coefficient is 1.33 and can reach 5.0). The evaluation method for the light hydrocarbon loss is as follows:

Fig.1. Relationship between Rock-Eval thermolysis peak and extractable organic matter, modified by Bordenave (1993).

Fig. 2. Evaluation results of heavy hydrocarbon correction coefficient based on comparison of shale pyrolysis before and after extraction. (a) Relationship between ΔS2 and S1 of lacustrine shale in Eastern China.Data from Wang and Zheng(1987).(b)Comparison of free oil in S1,oil in S2 and total oil content(Jarvie et al.,2012).(c)Relationship of retained oil(S1-S1'+S2-S2’) and S1 in the lacustrine shale in Eastern China (Wang et al., 2014).
3.2.1. Gas chromatography
Based on the difference in the hydrocarbon content from the GC spectrum of thermal evaporation of shale and homologous crude oil,the loss of light hydrocarbons is corrected. After correction, the original hydrocarbon amount is S1×(GC fingerprint produced oil/GC fingerprint of extracted oil)(Jarvie et al.,2012).A comparison of the GC spectra of shale oil produced in the middle Bakken and shale extracts indicates that most of the small molecular hydrocarbons(C15-) are lost (Jarvie, 2014). Song et al. (2014) analyzed the GC spectrum of crude oil in the lithologic reservoirs in the Jiyang Depression,assuming that all C14-in the saturated hydrocarbonwas lost,and then corrected the loss of chloroform asphalt“A"in shale which nears the depth of the crude oil in the same layer. The correction coefficient increased with the maturity. When the Ro(vitrinite reflectance)of the shale organic matter is 0.5%,0.7%,0.9%,1.1%, and 1.3%, the corresponding correction coefficients are 1.09,1.16,1.30,1.41,and 1.52 respectively.In fact,C15-in the extracts is lost during the process of extraction and evaporation(Jarvie and Baker,1984; Peters,1986), as well as the loss of saturated hydrocarbons and aromatic hydrocarbons. Therefore, the light hydrocarbon correction coefficient obtained by Song et al.(2014)is too small.
Michael et al. (2013) considered that C15-is mostly lost and found that the loss of light hydrocarbons is primarily related to the API degree of crude oil, and the loss increases with an increase in the API degree.He proposed using the relationship between the API degree and C15-content of crude oil to estimate the loss of light hydrocarbons(API=0.412×C15-+20.799).When the API degree is 50,the loss of C15-can reach 70%.S¸en and Kozlu(2020)used this method to calculate the C15-loss of wells Gulf Kevan 1,TPDo˘gan 1,TP So˘guktepe 1-TP K.Migo 2,and TPG.Hazro 2-TP-Arco Abdülaziz 1 in the Arabian Plate in Southeast Turkey, and the results were 10.1%, 22.33%, 58.70%, and 70.8%, respectively.
3.2.2. Pyrolysis
Li et al.(1993)analyzed the pyrolysis of rock containing medium oil at room temperature for different storage times. The results demonstrate that the loss of light hydrocarbons varies with storage conditions.The longer the storage time,the greater the loss.Zhang et al.(2012)compared the pyrolysis S1values of samples stored in a frozen sealed state and placed at room temperature for different times,and found that about half of the S1was lost during the core storage and experiment. Zhu et al. (2015) selected the lacustrine shale samples from Dongying Sag, Bohai Bay Basin, and compared fresh frozen samples immediately after being taken out from the well with the samples stored at room temperature for 30 days.Based on the pyrolysis data, the light hydrocarbon recovery coefficients at different evolution stages were established (Fig. 3).When Ro< 0.7%, the light hydrocarbon loss is small, and the correction coefficient is near 0.1. When Ro> 0.7%, the light hydrocarbon correction coefficient begins to increase.
3.2.3. Formation volume factor (FVT)
Chen et al. (2019) considered that in the oil and condensate windows, the release of light hydrocarbons from the oil when the core is taken to the surface is the key mechanism of loss.According to the phase equilibrium principle under different temperatures and pressures, the gas oil ratio or formation volume factor of dissolved gas was proposed to approximate the light hydrocarbon loss in shale oil reservoirs.
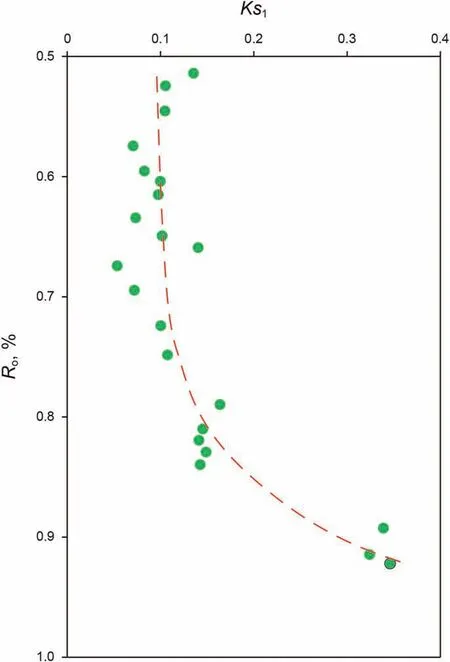
Fig. 3. Light hydrocarbon loss coefficient (Ks1) with depth variation, Dongying Sag,China (Zhu et al., 2015).
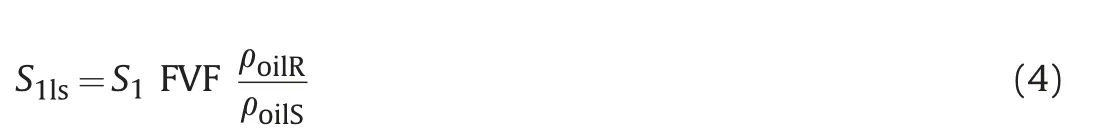
where S1is the pyrolysis data,representing the amount of residual free hydrocarbon in the sample (mg HC/g rock); ρoilSand ρoilRare the density of oil under surface and reservoir conditions (kg/m3),and FVF is the formation volume factor(dimensionless).
However, when the light hydrocarbon loss (S1ls) is corrected during sample collection,the loss during experimental preparation(S1lp)is not considered when the pyrolysis parameter S1is used for the calculation, which makes the correction value of S1lsslightly smaller. Chen and Jiang (2020) further established a shale oil resource evaluation method considering S1lpand compared it with the geochemical parameters. However, it is difficult to obtain the reservoir parameters. Only through high-pressure physical property experiments can the formation oil density and gas oil ratio be obtained accurately.
3.2.4. Mass balance
Chen et al.(2018a)evaluated the light hydrocarbon loss of shale oil in the Lucaogou Formation in the Jimusaer Depression using the mass balance method(loss of hydrocarbon=original hydrocarbon generation - discharged - measured residual hydrocarbon) and assumed that all the hydrocarbons generated exceeding the threshold depth of hydrocarbon expulsion were discharged. The results indicated that the ratio of S1lossto(S1+S1loss)was 11%-89%.It was found that the ratio of S1lossto TOC did not change significantly among the samples with similar maturity, which indicated that TOC had a significant control on S1loss.Chen et al.(2018a)also considered that quantitative evaluation of light hydrocarbon loss in the laboratory cannot consider all the influencing factors simultaneously or simulate the difference between the surface and underground reservoir in the sampling process. Therefore, the mass balance method is a more effective method for evaluating the amount of hydrocarbon loss (Jiang et al., 2016b; Li et al., 2020a).However,this method is affected by data selection and an artificial envelope when calculating the hydrocarbon expulsion efficiency and hydrocarbon generation conversion rate.
3.2.5. Component hydrocarbon generation kinetics
The component hydrocarbon generation kinetics can reflect the characteristics of the hydrocarbon generation process of organic matter (gas and liquid hydrocarbons). The light hydrocarbon compensation correction coefficient chart can be established considering the dual effects of the organic matter type and maturity using the component hydrocarbon generation kinetics simulation method. The advantage is that it can simulate the correction coefficient of light hydrocarbon loss under different geological conditions.The light hydrocarbon correction coefficient(KL=C6-13/C13+)of shales in the lower third member of the Shahejie Formation in the Bonan Sag is related to maturity,ranging from 0.5 to 1.5(Wang et al.,2014).Chen et al.(2017)used this method to correct the light hydrocarbon loss in the lower fourth member of the Shahejie Formation in the Damintun Sag, and found that when the organic matter maturity is between 0.7%and 1.5%,the correction coefficient of light hydrocarbon loss is between 0.6 and 0.9.Wang et al.(2014)did not reveal the effect of core storage on the S1loss,ignoring the loss during coring. In addition, the method of hydrocarbon generation kinetics assumes that there is no difference exclusion of crude oil;that is,the discharged and retained crude oil in the shale have the same composition, such as saturated hydrocarbons, aromatic hydrocarbons, non-hydrocarbons, and asphaltene. However, the actual micro migration of crude oil in the source rocks varies. Han et al. (2015) analyzed the Barnett shale in the Marathon 1 Mesquite well and found that the aliphatic content of the extracted oil of the siliceous shale in the second member is higher than that of the clay rock in the third member (62% versus 44%). The second shale oil is considered to include the migrated oil, while the third shale oil is predominantly the result of in-situ retention.
3.2.6. Empirical methods
Cooles et al. (1986) suggested that most of the light hydrocarbons were lost and had accounted for 35%of the total oil(C14-/C5+).Hunt et al. (1980) reported approximately 30% of the light hydrocarbons in crude oil.Noble et al.(1997)established the relationship between the C12-component content and API degree through crude oil volatilization experiments. Then, he recovered the extracted soluble organic matter content, and then calculated the oil saturation of the Eagle Ford shale based on the relationship between the adsorbed oil content by organic matter and TOC. The oil saturation of the shale ranged from 15% to 70% in the oil generation window. It is considered that the change in pressure, temperature,and composition in the process of sampling will lead to a reduction in the oil saturation,and the correction coefficient of the original oil saturation is 1.1-1.5. The oil saturation of immature shales is less than 10%,while it is as high as 80%in the oil generation window, and gradually decreases at high maturity. Chen et al.(2019) and Li et al. (2019c) used 15% of the experimental S1value as the light hydrocarbon loss during sample preservation and experiment.
3.3. Influencing factors of light hydrocarbon loss
The loss of small molecular hydrocarbons in shale oil is related to a series of factors, such as rock permeability, TOC, lithofacies,oil properties, sample type (core or cuttings), sampling method,preservation conditions, and even analytical instruments (Jarvie,2014).Espitali′e et al.(1984)determined the hydrocarbon content of C1-C8in cutting samples with different storage times (room temperature) and found that the hydrocarbon content was the highest when the samples were stored for 12-15 min, and then gradually decreased with the increase in storage time,and all the small molecular hydrocarbons evaporated after about 80 min.Carvajal-Ortiz and Gentzis (2018) found that there was a significant difference in S1between the analysis of 2-5 s immediately after crushing and several hours after crushing (>2 h). The result showed that the former was 22%-42%higher than the latter.Han et al.(2019)indicated that hydrocarbons with a low boiling point(<36°C), such as C1-C5, would be lost in general. The GC spectrum of thermal evaporation of the Niobrara shale in the Denver Basin indicated that C7-was completely lost, which was attributed to the pretreatment.
Jiang et al. (2016a) reported that organic matter abundance had a significant control effect on the light hydrocarbon loss,such as the Ordovician Lotbiniere shale (TOC = 0.87%,Tmax=447°C),in which C9-was completely lost within 21 h,and S1was reduced by 37.5%(from 0.56 mg/g to 0.35 mg/g).However,the Duvernay shale (TOC = 11.3%, Tmax= 477°C) still showed a high concentration of C7-9hydrocarbons after 5 days, S1only decreased by 14% (from 5.26 mg/g to 4.47 mg/g, after 2 years at room temperature), and lost 22% of the hydrocarbons after 55 days.
The loss of small molecular hydrocarbons in shale oil is affected by many factors. The maturity of organic matter determines the content of small molecular hydrocarbons in shale oil,which should have the greatest impact on the loss of hydrocarbons. In addition,the preservation of samples and experimental analysis conditions(such as immediate analysis or after an extended time) are other major factors affecting the loss of small molecular hydrocarbons.For shale with different properties, the light hydrocarbon correction factors should be different, especially for samples with different porosities and permeabilities. Jiang et al. (2016a) found that the light hydrocarbon loss rate of poor organic matter samples was higher than the rich ones.
Kissin(1987)found that the molar content of n-alkanes in crude oil followed the exponential relationship with the corresponding carbon number,and established a method to predict the content of n-alkanes in crude oil by carbon number. However, due to the change of crude oil components in micro migration,there is often a large deviation in the relationship between molar content and carbon number fitted by an exponential relationship. The prediction of the model is more complex by using two-stage or multistage fitting (Thompson, 2002). Some scholars also pointed out that the fitting effect of this method is relatively good for C15+heavy components,but poor for light hydrocarbon by the data from Jiang et al. (2016a).
The loss of light hydrocarbons in shale oil primarily occurs with the change in the temperature and pressure during coring and the subsequent sample treatment and preservation. Therefore, rock pyrolysis (without crushing) can be carried out immediately after thawing the sealed cores or pressure-maintained cores.Oil content measurement experiments under different placement times should be carried out, and a correction map of light hydrocarbon loss should be established considering factors such as the rock physical properties and organic matter content.
4. Oil saturation
Oil saturation refers to the ratio of the volume of crude oil to the pore volume of rock under a certain temperature and pressure condition. It is the most used and easily accepted parameter for characterizing the oil-bearing properties of reservoirs. It is also a critical parameter for the “sweet area” optimization, reserve calculation, well location design, development plan, and development effect inspection(Nikolaev and Kazak,2019;Dash et al.,2020;Ravi et al.,2020).However,the determination of fluid saturation in shale is exceptionally challenging because of the special composition (stray/bedded distribution of organic matter and high proportion of clay minerals), small pore radius (a large number of nanopores),complex pore throat structure(poor connectivity),and unclear fluid occurrence mechanism.
Porosity is a basic parameter for determining shale oil saturation.Shale porosity measurement methods mainly include GRI(Gas Research Institute) method belonging to GIP (gas injection porosimetry)(Luffel and Guidry,1992;Sun et al.,2016;Fu et al.,2020b),WIP (water immersion porosimetry) (Kuila et al., 2014), DLP (dual liquid porosimetry) (Top′or et al., 2016), NMR (Martinez and Davis,2000; Yao et al., 2010; Yan et al., 2018), MICP (mercury injection capillary pressure) (Sigal, 2013; Davudov et al., 2018), gas adsorption (Clarkson et al., 2013; Mastalerz et al., 2013), SEM (scanning electron microscopy) (Chalmers et al., 2012; Schieber et al., 2016),SANS(small angle neutron scattering)(Sun et al.2018b,2019),etc.Please refer to the corresponding literatures for details.
When the core is taken to the surface, owing to the change in temperature and pressure, the oil-soluble gas, light hydrocarbon(C1-C14), and formation water in the pores are volatilized to varying degrees,resulting in oil saturation determined in the laboratory lower than the original saturation of the shale under the in-situ conditions. However, the oil saturation used in the “sweet area”evaluation and reserve calculation should be the original oil saturation. Therefore, it is vital to accurately determine the oil saturation for the in-situ state(Michael et al.,2013;Tan et al.,2013;Gong et al.,2016; Nikitin et al., 2019; Ali et al., 2020; Wu et al.,2020).
At present, there are four methods to calculate the original oil saturation of shale.1)Indirect methods.The residual oil saturation of the core (part of the fluid has been lost) is determined using retort, Dean Stark extraction, alcohol extraction, NMR (nuclear magnetic resonance), and the original oil saturation is then obtained with the loss correction (light hydrocarbon recovery)(Handwerger et al. 2011, 2012; Spears et al.,2011; Tan et al.,2018;Fu et al., 2020a); 2) Direct method. The original fluid saturation obtained directly from special coring samples (pressure-maintained coring, sponge-liner coring, or sealed coring) is the most effective and convincing method; 3) Logging method. Using the fluid saturation interpretation model suitable for shale reservoirs,the inversion of logging data (mainly including resistivity logging,dielectric logging, and NMR logging) is carried out to obtain the original oil saturation continuously(Passey et al.,2010;Kethireddy et al.,2013;Tan et al.,2015).4)Indoor simulation.By saturating the core (fluid has been lost) with different fluids, the distribution of the fluid in the pores of shale for the in-situ state is restored, and then the original fluid saturation is determined using the instruments (e.g., NMR or Nano-CT) (Li et al., 2007;Ali et al., 2020).
4.1. Retort
The retort uses heat to vaporize the pore fluids(extracted from the samples)and measures the volumes of the extracted water and oil directly by condensing the vapors in a receiver vessel(Crabtree,1965). Considering the characteristics of small pore throats and poor physical properties of shale, Handwerger et al. (2011)improved the experimental process of retort to make it better applied to shale;That is,the sample was first crushed and weighed before and after the retort process,and then heated continuously to a succession of three or four characteristic retort temperatures.The experimental results show that there is a good correlation between the oil saturation measured by retort and NMR. Rylander et al.(2013) analyzed the free oil content of the Eagle Ford shale using retort and Dean Stark. It was found that the free oil content obtained by retort was lower than the Dean Stark method, while the total oil content (bound oil + free oil) obtained by retort was equivalent to the free oil content determined by Dean Stark, indicating that the free oil determined by Dean Stark included the contribution of bound oil.
Retorts have the advantages of mature technology, short analysis time,and direct measurement of the oil and water volume.It is especially suitable for the rapid evaluation of shale oil content in the field and laboratories.For tight shale reservoirs,it only takes a few hours to determine the fluid saturation of shale fragments using retort, while it takes more than two weeks with the Dean Stark. Handwerger et al. (2011, 2012) selected siliceous shale and argillaceous shale to carry out three-stage(T1=250°F,T2=600°F,T3=1,300°F)high-resolution retort experiments and obtained the free water,capillary water,and structural water in turn,and called capillary water and structural water as clay-bound water (Fig. 4).However, the shale containing a large amount of kerogen and asphalt cracked at high temperatures.Meanwhile,the clay minerals and gypsum in the shale are dehydrated at high temperatures.For example, illite undergoes hydroxylation at 470°C-580°C, which affects the experimental results (Araújo et al., 2004; Larsen et al.,2005; Handwerger et al., 2011).
4.2. Dean Stark
In the method, the vapor of the solvent rises through the core and leaches out the oil and water in the pore space. Typically, the water condenses and is collected in a graduated cylinder,while the solvent and oil are continuously circulated through the extraction process (Dean and Stark,1920).
Luffel and Guidry (1992) analyzed the porosity and fluid saturation of Devonian shales using the Dean Stark method.The steam generated by heating toluene(110°C)in the sealed space was used to extract the shale sample and then dried to obtain the amount of oil and water, respectively. The solvents used in Dean Stark are developed from single solvent (such as toluene, dichloromethane,and chloroform) to mixed solvents (such as benzene-methanol,acetone-dichloromethane-methanol). Due to the varying physical/chemical properties of the different solvents, appropriate solvents should be selected to achieve different purposes. For example, a chloroform-methanol solvent can dissolve salt in the shale.Fu et al.(2020a)used petroleum ether,dichloromethane,and rock pyrolysis to obtain the movable hydrocarbon content of the Chang 73shale oil in the Cheng 80 block, Ordos Basin. The results indicate that the movable hydrocarbon content of dichloromethane extraction is 6.41 mg/g,which is higher than that using petroleum ether 6.27 mg/g and rock pyrolysis 4.57 mg/g. Sun et al. (2018a)used dichloromethane to obtain the oil saturation of the black shale core (columnar sample) with silty lamina in Chang 7 of the Yanchang Formation in the Fuxian area of the Ordos Basin. The results suggest that the oil saturation is 13.34%-87.34%, with an average of 39.32% (30 samples). Bao (2018) used the Dean Stark method to obtain the oil and water from the shales in the lower part of the third member of the Shahejie Formation and the upper part of the fourth member of the Shahejie Formation in the Jiyang Depression of the Bohai Bay Basin, and then determined the fluid saturation. Compared with retort and NMR (generally only a few minutes to a few hours),Dean Stark requires a long time,especially for shale with small pore and complex pore throat structures,which takes approximately 12-20 days,while the standard 2.5 cm column takes approximately 20-35 d longer. Throughout the process of the Dean Stark,the experimental instrument is required to maintain high accuracy(Handwerger et al.,2011).Ramirez et al.(2011)used Dean Stark and NMR to analyze the water saturation of the Haynesville shale in Texas.The results indicated that the water content obtained by NMR was higher than that using Dean Stark,because NMR can detect the water in isolated pores and micronano corner pores. For the same rock sample, the water contents obtained by the retort and Dean Stark methods are not equal. The overall law is that the water content obtained by Dean Stark is higher than retort(<600°F).The analysis demonstrates that excess water may originate from structural water (Handwerger et al.,2011; Spears et al., 2011; Handwerger et al., 2012). In addition,the Dean Stark cannot separate the free water from capillary water in the shale (Handwerger et al., 2011; Handwerger et al., 2012).
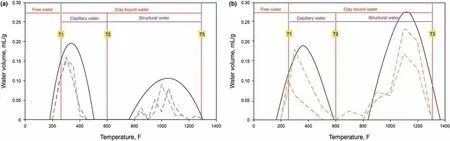
Fig. 4. High-resolution retort analysis of (a) a siliceous mudstone, and (b) an argillaceous mudstone. Dotted lines of different colors represent different samples, modified after Handwerger et al. (2011).
4.3. Alcohol extraction
Because the Dean Stark has the disadvantages of time consuming and high toxicity of the solvents used, in recent years,an alcohol extraction method suitable for measuring the fluids saturation of tight reservoirs has been proposed based on the Dean Stark. The alcohol used is usually methanol or ethanol, and its principle is based on the infinite and uniform miscibility of alcohol and water.First,the fragmented samples are placed in an extraction tank filled with alcohol solvents, and then the extraction tank is maintained at a constant temperature for a certain period to thoroughly extract the water in the rock.Then,the water content in the core is determined directly.Finally,the core is extracted,and the oil content is obtained using the quality difference(Zhang et al.,2017;Tan et al., 2018).
The water content in the alcohol extraction solution can be determined using gas chromatography or the Karl Fischer titration method. The Karl Fischer titration method has the advantages of high precision (usually within 1% of water content), short analysis time,and wide application range.The Karl Fischer titration method requires a certain amount of water to participate in the reaction when I2oxidation is used. Because the reaction is reversible, an appropriate amount of alkaline substance is necessary to neutralize the acid generated to ensure that the reaction proceeds smoothly to the right.At present,I2,SO2, C5H5N(pyridine),CH3OH(methanol),and CH3CH2OH (ethanol) are often used together as Fischer reagents. Karl Fischer titration includes two types: the volume method and the coulometric method (Coulomb method). Handwerger et al. (2011, 2012) compared the differences in the determination of water content using retort, Dean Stark, TGA(thermogravimetric analysis),and Karl Fischer titration(methanol).The results indicated that the water content determined using Karl Fischer titration was similar to that determined with TGA and retort(T1+ T2), but smaller than that determined using Dean Stark, primarily because the Dean Stark could distill part of the structural water in the clay minerals. The author used the Karl Fischer Coulomb method (ethanol) and T1-T2NMR to measure the water content of the Upper Cretaceous shale in the Songliao Basin. The results suggest that the water content measured using NMR is lower than the Karl Fischer Coulomb method overall, and the conversion of the NMR oil-water signals may be the cause of this difference(Fig.5a).For tight reservoirs,ethanol thermal extraction has significant advantages because the extraction rate is not affected by the physical properties of the sample (Fig. 5b).
4.4. Nuclear magnetic resonance
Nuclear magnetic resonance (NMR) has unique advantages in characterizing the fluid content, pore size distribution, and occurrence of fluid. Non-destructive, fast analysis speed, and no requirement for sample size are main advantages(Yao et al.,2014;Li et al.,2019a; Song and Kausik, 2019; Zhang et al.,2019; Li et al.,2020b). The 1D NMR(T2NMR)of shale in different states (e.g., asreceived sample, extraction sample, or saturated sample) cannot quantitatively characterize the fluid content.This is mainly because the T2spectra of different components (fluid + organic matter)often overlap, so it is necessary to improve the experimental scheme or data analysis methods,for example,adding Mn2+ion to the solution to eliminate hydrogen-containing fluid signals (Yao and Liu, 2018), using heavy water (D2O) to replace the formation water(Di et al.,2017),or frequency division technology of 1D NMR(Jiang et al., 2015; Piedrahita and Aguilera, 2017).
2D NMR (T1-T2NMR) can resolve the problem of uncertain results when using a single sequence (Tinni et al., 2017; Korb et al.,2018; Li et al., 2019a; Li et al., 2020b; Zhang et al., 2020; Liu et al.,2021). Kausik et al., (2016) carried out T1-T2analysis of shale with 2 MHz NMR to determine the contents of the free oil and water,inorganic pore oil and water, organic pore oil and water, and clay-mineral-bound water (Fig. 6a). Yang and Kausik (2016)characterized the free water, bound water, movable oil, and immovable oil based on high-frequency field 2D NMR (Fig. 6b).When performing NMR experiments on cores where fluids(highly mobile light hydrocarbon) have been lost, only the residual oil content can be determined, making the evaluation results unreliable, especially for medium-high mature shale oil. To solve this problem, the author selected medium-high mature shale in the Songliao Basin as the research target.First, the obtained pressuremaintained or sealed samples were frozen in liquid nitrogen in the field,and then carried out 2D NMR under laboratory conditions to quickly obtain the oil saturation of the samples (Fig. 7), which provided a feasible scheme for the accurate evaluation of the original oil saturation. Li et al. (2020b) analyzed relationships between the NMR T1-T2map and geochemical parameters. Good positive relationships between region 2(and region 3)in NMR T1-T2maps and adsorbed oil (and free oil) contents from step-by-step Rock-Eval experiments have been observed, indicating that NMR can be used to identify and quantify the adsorbed versus free oil contents, as a non-destructive technique.
Owing to the different advantages of the above analysis methods and the complex fluid occurrence of shale, researchers usually combine various methods to determine the fluid saturation.For example, retort is combined with Dean Stark to determine the contents of free fluid (oil, water) and bound fluid (Handwerger et al., 2011; Konoshonkin and Parnachev, 2015). The combination of NMR with Dean Stark, rock pyrolysis, and other methods can effectively characterize the content of different fluids in shale(Konoshonkin and Parnachev,2015;Romero-Sarmiento et al.,2017;Li et al.,2019b; Li et al., 2020b).
Notably,most of the above methods are based on the analysis of the core whose fluid has been lost,and the oil saturation obtained is significantly less than the original oil saturation of the shale.However,in shale oil and gas exploration,more attention is paid to the original fluid saturation. During core sampling, preservation,and preparation,the gaseous hydrocarbons and light hydrocarbons in the pores are lost, resulting in a lower oil saturation in the laboratory. In addition, the lost hydrocarbons have small molecular radius and fast seepage velocity.The contents of these components are particularly important for the development of shale oil.Therefore,it is critical to determine the original oil saturation of the shale.
4.5. Direct method
The direct method analyzes the saturation of shale after special coring, which includes pressure-maintained coring, sponge-liner coring, and sealed coring. Pressure-maintained coring is the best to obtain the original oil saturation,which can also collect the gas of the reservoir at the same time. Sponge-liner coring is specially developed to improve the accurate measurement of fluid saturation. Unlike pressure-maintained coring, sponge-liner coring does not collect gas, but its cost is lower than pressure-maintained coring (GB/T 29172-2012 Practices for core analysis, China, 2012).
Sealed coring uses sealed coring tools and sealed fluid to get cores that are mostly free from the pollution of the drilling fluid.Furthermore, this method can also solve the problem of low core recovery rates in loose formations. Although the sealing effect of sealed coring on fluid is not as good as pressure-maintained coring and sponge-liner coring, this technology has been widely used in the fields.If the operation is compliant,it can also reflect the in-situ fluid saturation. Shale samples obtained by special coring are the basis for analyzing the components and properties of the fluid,evaluating the original fluid saturation, and studying the fluid volatilization. However, related research is still in its infancy.
The author placed sealed coring samples(shale oil reservoir)in the Songliao Basin in an indoor environment to simulate fluid volatilization and used PY-GC and NMR to investigate the variations in the fluid content/composition with time.Fig.8 shows the PY-GC spectra of the sealed coring samples(Ro=1.34%)stored at different times. The C1-C14hydrocarbons in crude oil are lost rapidly,especially the C1-C5gaseous hydrocarbons,whose contents rapidly decrease from 2.4596 mg/g to 0.0199 mg/g after 10 min. Fig. 9 displays the 2D NMR spectra of the same sample stored at different times.It can also be seen that the oil saturation measured indoors is far lower than the original oil saturation because of the rapid loss of light components in the pores.The above experimental results indicate that special coring is a vital material in shale oil exploration and demonstrate the necessity of light hydrocarbon recovery research. However, restricted by the field conditions and drilling costs, special coring is usually limited and cannot be used for large-scale analysis and research.
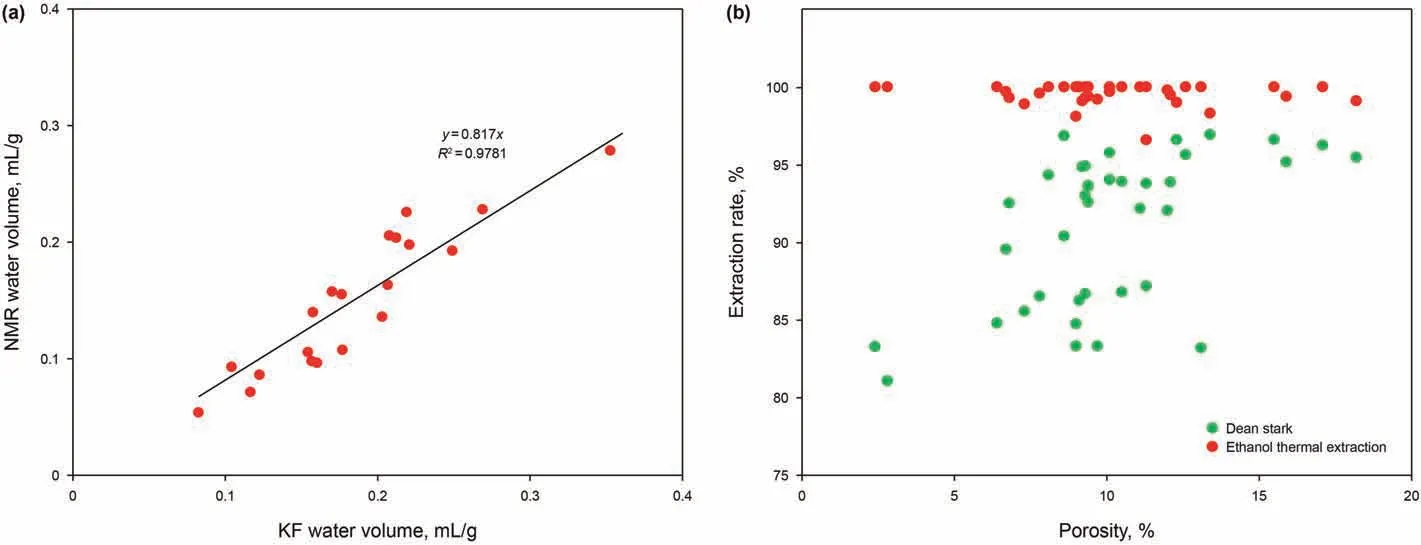
Fig.5. (a)Comparation of NMR water volume and KF water volume.(b)Relationship between porosity and extraction rate by ethanol thermal extraction and Dean Stark,modified after Tan et al. (2018).
4.6. Logging
The original oil saturation can be obtained continuously using the logging.The resistivity-porosity-saturation model is the most used interpretation method. However, due to the complex pore throat structure,small pore throat,diverse fluid occurrences,strong heterogeneity and anisotropy (bedding/stray distribution of mineral and organic matter), shale resistivity is not controlled only by the formation water salinity and clay minerals(Passey et al.,2010;Chen et al., 2014). Traditional saturation interpretation models,such as the Archie equation, Simandoux equation, Indonesia equation, Dual-water model, and Waxman-Smits model, consider that resistivity is only affected by the formation water and clay minerals, which is significantly inconsistent with shale. Existing studies have determined that the conductivity of shale reservoirs is also affected by the pore throat structure,distribution of symbiotic water, maturity, and abundance of kerogen, pyrite, siderite, and other conductive minerals (Clennell et al., 2010; Kethireddy et al.,2013). The building of the shale petrophysical model is the key to establishing fluid saturation interpretation models for shale reservoirs. Based on different research purposes, scholars have constructed a variety of petrophysical models of organic-rich shale.Some scholars believe that the shale matrix should include clay minerals,while others regard clay minerals as a separate part of the model (Fig.10).

Fig. 6. (a) The low-field NMR (2 MHz) T1-T2 map for all the components in unconventional shales, modified after Kausik et al. (2016). (b) A schematic T1-T2 reference map for 400 MHz NMR measurement results for an unconventional organic-rich reservoir, modified after Yang and Kausik (2016).
Nie et al. (2020) attempted to separate inorganic pores from organic matter to eliminate the background conductivity caused by the drilling fluid and other conductive minerals, and established a saturation evaluation model of organic-rich lacustrine shale based on effective conductive pores (Fig.11a). In recent years, new techniques, such as dielectric logging and NMR logging, have been developed for unconventional reservoirs, which have significant advantages in characterizing fluid saturation. Chen et al. (2014)combined dielectric logging with resistivity logging and established a fluid saturation interpretation model suitable for organicrich shale using a numerical simulation analysis of the factors affecting the conductivity and dielectric constant of porous media.The model not only considers the pore throat structure of the reservoir but also clarifies the influence of the spatial distribution of the formation water,kerogen,and pyrite on the above parameters.Tathed et al. (2018a, 2018b) evaluated the fluid saturation, formation water conductivity,cementation index,and saturation index of Bakken formation by integrating the CRIM, SMD, and WS models.Zhao et al. (2020a) evaluated the fluid saturation of the Chang 7 shale in the Ordos Basin using dielectric dispersion logging based on the CRIM and SHSD interpretation models. Piedrahita and Aguilera (2017) combined NMR logging with rock pyrolysis,established the relationship between the porosity and OSI by decomposing the T2spectrum, and then evaluated the oil saturation of the shale (Fig. 11b). Kausik et al. (2016) determined the distribution position of different components of shale in 2D NMR(T1-T2) and discussed how to combine this data with 2D NMR logging to obtain the fluid saturation of shale under the original conditions. Kuang et al. (2020) suggested that the ratio of the oil-wet area to the water-wet area is approximately equal to the ratio of water saturation to oil saturation,and proposed to calculate the oil saturation of the Lucaogou Formation shale using the T2cut-off value of oil and water.
4.7. Laboratory simulation
In the laboratory simulation method, the core (fluid has been partly lost) is saturated with different fluids in turn to restore the distribution of the fluid in the pore of the shale under the in-situ state, and then the original fluid saturation of shale is determined using experimental instruments, such as NMR and Nano-CT. For shale samples,the most common method is to directly saturate the crude oil (fluid has been lost) and age the sample. Besides, the process of extraction →drying →saturated water →centrifugation →saturated oil →aging to simulate the fluid distribution is also popular. However, there are many defects in these methods.For example, in the process of core sampling and placement, light hydrocarbons and formation water will be lost to varying degrees,and the occurrence mode of the fluid,especially the distribution of the formation water, is not fully understood. Li et al. (2007) proposed a three-stage NMR method to restore the oil saturation.The main experimental steps included: 1) Performing the first NMR measurement after the core is removed from the core barrel; 2)Soaking the rock after the first NMR measurement with the formation water for more than 2 h under the soaking state, and then taking the second NMR measurement;3)Soaking the rock sample with a Mn2+ion solution and then taking the third NMR measurement.The loss of oil,gas,and water can be clearly seen in the T2spectrum.It is assumed that the void pores caused by the pressure decrease are caused by the loss of dissolved gas and volatile light components in the crude oil,which is inconsistent with the actual situation, resulting in a high oil saturation, which is the biggest disadvantage of the method(Figs.12a and b).Ali et al.(2020)used NMR to carry out imbibition experiments of organic shale under different fluid environments (formation water, crude oil, and ndodecane) to clarify the distribution characteristics of oil-wet,water-wet, and neutral-wet pores, and determine the original oil saturation of the shale (Figs.12c and d).
As the most basic and crucial parameter in shale oil exploration and development, the accuracy of the original oil saturation has been of great interest to many researchers in different fields.The oil saturation obtained by the direct method is the most convincing,but its application is restricted by the exploration costs and field conditions. Based on the saturation interpretation model, the inversion of logging data is the most feasible method for obtaining the vertical continuous changes of the original oil saturation. For core samples whose fluid has been lost,the accuracy of the original oil saturation depends on light hydrocarbon recovery model. The indoor simulation method can restore the microscopic distribution of the fluid based on the occurrence mechanism, which is helpful for understanding the original oil saturation of the shale.
5. Conclusions
(1) The commonly used models for shale oil resource evaluation include the chloroform asphalt “A" method, pyrolysis S1method, and oil saturation method, in which heavy hydrocarbon retention, light hydrocarbon loss, and original oil saturation evaluations are the key.
(2) The adsorption and retention of heavy hydrocarbons can be evaluated through the experimental comparison of shale before and after extraction, including the difference comparison method of pyrolysis parameters before and after extraction, the method of reverse accumulation comparison of the FID curve before and after extraction, and the kinetic parameter method of hydrocarbon generation of the organic matter before and after extraction.
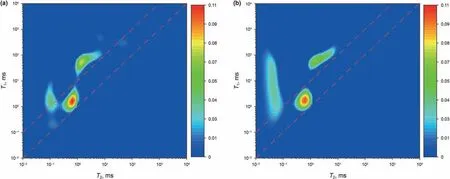
Fig. 7. T1-T2 map of sealed core samples frozen by liquid nitrogen.(a) So=53.5%, (b) So=46.4%.
(3) The loss of light hydrocarbons includes the release of small molecular hydrocarbons caused by changes in temperature and pressure from underground to the surface, and the loss of small molecular hydrocarbons in core bank and laboratory storage,during pretreatment(such as crushing),and waiting for the analysis.The loss can be evaluated by considering the GC spectrum, pyrolysis, volume coefficient of the crude oil,material balance,and hydrocarbon generation kinetics of the components. The loss of light hydrocarbons is related to the rock permeability,TOC,lithofacies,oil properties,sample size(core or cuttings), sampling method, preservation conditions, and even the analytical instruments.
(4) The evaluation of the original oil saturation of the shale includes indirect, direct, logging, and indoor simulation methods. The oil saturation obtained using the direct method was the most convincing. The inversion of the logging data based on the saturation interpretation model is the most feasible method for obtaining the vertical continuous changes in the original oil saturation.The indoor simulation method can restore the microscopic distribution of the fluid based on the fluid occurrence mechanism, which is helpful for understanding the original oil saturation of the shale.
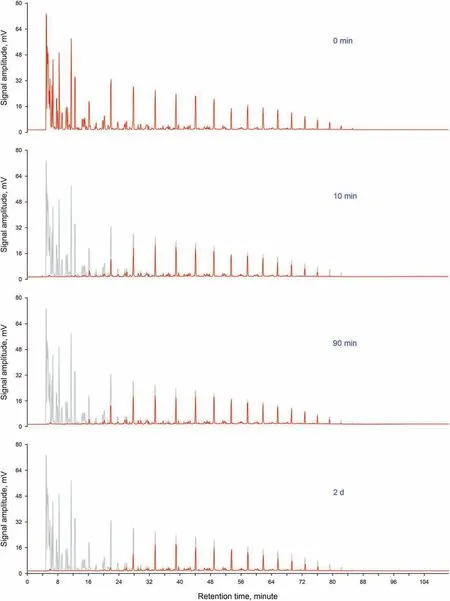
Fig. 8. PY-GC spectra of sealed shale samples with evaporation in the laboratory.
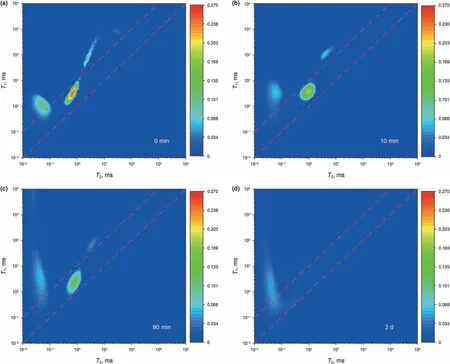
Fig. 9. NMR T1-T2 map of sealed shale samples with evaporation in the laboratory.

Fig.10. Schematic illustrations of various rock petrophysical models for organic-rich unconventional reservoirs. (a) Kethireddy et al. (2013); (b) Passey et al. (2010); (c) Tan et al.(2015); (d) Chen et al. (2014); (e) Habina et al. (2017).
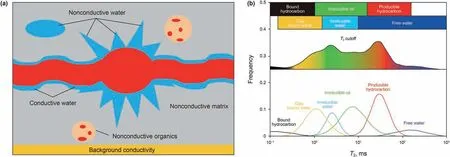
Fig.11. (a) Effective conductive path model of intersalt oil shale reservoirs (Nie et al., 2020). (b) Schematic diagram of NMR factor analysis (Jiang et al., 2015).

Fig.12. (a) Steps of recovering original oil saturation by NMR and (b) schematic diagram of NMR, modified after Li et al. (2007). (c) Organic shale spontaneous imbibition and monitoring with NMR to evaluate the in-situ saturations and (d) pore fluid partitioning comparison in post-imbibition samples (Ali et al., 2020).
The most reliable parameters can be obtained using pressuremaintained coring (or sealed coring) immediately after thawing(without crushing), and the recovery of the light hydrocarbon is essential for the evaluation of medium-high mature shale oil.These challenges can promote the experimental determination of the shale oil content as well as the research on the influencing factors of the calculation model.
Acknowledgments
This study was funded by the National Natural Science Foundation of China (41922015, 42072147), Fundamental Research Funds for the Central Universities (20CX06085A) and Qingdao Postdoctoral Science Foundation (ZX20210070).
杂志排行

Petroleum Science的其它文章
- A fast space-time-domain Gaussian beam migration approach using the dominant frequency approximation
- Predicting gas-bearing distribution using DNN based on multicomponent seismic data: Quality evaluation using structural and fracture factors
- Reflection-based traveltime and waveform inversion with secondorder optimization
- Determination of dynamic capillary effect on two-phase flow in porous media: A perspective from various methods
- Settling behavior of spherical particles in eccentric annulus filled with viscous inelastic fluid
- Laboratory investigation on hydraulic fracture propagation in sandstone-mudstone-shale layers