Imaging internal density structure of the Laoheishan volcanic cone with cosmic ray muon radiography
2022-09-02YaPingChengRanHanZhiWeiLiJingTaiLiXinMaoWenQiangDouXinZhuoFengXiaoPingOuYangBinLiaoFangLiuLeiHuang
Ya-Ping Cheng• Ran Han• Zhi-Wei Li • Jing-Tai Li • Xin Mao •Wen-Qiang Dou • Xin-Zhuo Feng • Xiao-Ping Ou-Yang • Bin Liao •Fang Liu • Lei Huang
Abstract Muon radiography is a promising technique for imaging the internal density structures of targets such as tunnels, pyramids, and volcanoes up to a scale of a few hundred meters by measuring the flux attenuation of cosmic ray muons after they have traveled through these targets. In this study, we conducted experimental muon radiography of one of the volcanoes in the Wudalianchi area in Northeast China to image its internal density structure. The muon detector used in this study was composed of plastic scintillators and silicon photomultipliers.After approximately one and a half months of observing the crater and conduit of the Laoheishan volcano cone in Wudalianchi from September 23rd to November 10th 2019, more than 3 million muon tracks fulfilling the data selection criteria were collected. Based on the muon samples and high-resolution topography obtained through aerial photogrammetry using an unmanned aerial vehicle,a density image of the Laoheishan volcano cone was constructed. The results obtained in this experiment demonstrate the feasibility of using a radiography technique based on plastic scintillator detectors. To obtain the density distribution,we performed a detailed background analysis and found that low-energy charged particles dominated the background noise. Relatively higher densities were found near the surface of the volcanic cone, whereas relatively lower densities were found near the center of the volcanic cone. The experiment in this study is the first volcano muon tomography study performed in China. Our work provides an important reference for future research.
Keywords Muon radiography · Muon transmission imaging · Density
1 Introduction
Volcanic hazard assessment and risk management are important for both population safety and economic development. On January 15, 2022, a powerful explosive eruption from the underwater volcano Hunga Tonga-Hunga Ha′apai brought powerful tsunami waves and heavy ashfall to islands in Tonga, severely damaging coastal communities. Understanding the internal structures of volcanos is essential for forecasting such volcanic hazards.
Conventional geophysical methods have spatial resolutions that typically range from tens of meters to 1 km.Such low resolutions are insufficient for detecting small volumes of magma or magma conduits [1]. Gravimetry is a commonly used geophysical method. However, it suffers from ill-posed inversion matrices, and its sensitivity is limited to relatively shallow depths [2].
As early as 1994, Nagamine et al. proposed the use of cosmic ray muons to probe the internal structures of volcanoes [3]. To overcome the limitation that X-ray radiography cannot be applied to medium-to-large and dense objects, Borozdin et. al. proposed in 2003 that natural background muons with high penetrating power can be used for radiographic imaging [4]. This proposal has attracted broad attention. The use of global density tomography for volcano monitoring was subsequently promoted in [5-7].
Muon radiography can provide high-resolution density measurements of shallow structures with a density contrast precision of 1-3%, which is significantly higher than that achievable using conventional geophysical methods such as electromagnetic and seismic techniques [5]. For example, a conduit with a diameter of 102±15 m was successfully imaged using muon radiography, as reported in[8]. In 2010, Jack et al. theoretically investigated the possibility of using muon radiography to determine the internal density distributions of candidate target structures[9].
In this paper, we present our work on the use of muon radiography to perform volcano imaging and to investigate the inner structures of a volcano. The remainder of this paper is structured as follows: First, we provide an overview of muon radiography (Sect. 2). We then provide a detailed description of the muon radiography project at Wudalianchi (Sect. 3). In Sect. 4, we present the data processing method as well as the imaging procedure and the obtained density results. We explain the possible contamination from background events involving charged particles. We finally provide concluding remarks and a discussion in Sect. 5.
2 Muon Radiography
2.1 Principle
Muons are produced through the interaction of primary cosmic rays with the Earth’s atmosphere. Muons have drawn much attention because of their utility in an imaging method called muon radiography,which is similar to X-ray radiography. In addition, muon imaging based on multiple muon scattering is also a popular topic in the field of radiation detection imaging and is commonly used for the identification of high-Z materials [10].
As muons pass through the investigated object,they lose energy via interactions with matter such as ionization and radiation. There are different attenuation coefficients for gamma rays and X-rays passing through different materials[11]. The muon flux attenuation due to interaction with matter should be carefully modeled according to the spectrum of the incident cosmic muons. In this study, we used a muon flux model named the modified Gaisser’s formula[12].Compared to Gaisser’s formula[13],which is applicable in the high-energy range (100 GeV-100 TeV)and at small zenith angles, the modified Gaisser’s formula is extended to low energies and large zenith angles and is given in Eq. 1:

where Emin denotes the minimum energy required for a muon to cross the investigated object without being absorbed. Emin is dependent on the density-length, which is the product of the average material density ρ and path length l inside the investigated object traversed by the muon. In this study, the density-length is calculated as the product of the volcano rock density and the thickness encountered by the muon along a given line of the muon track before it enters the detector. In this method, the path is divided into many small line segments called steps.Whether the step is inside the volcano or not is determined by the z-coordinate of the line segment.If the z-coordinate is smaller than the elevation of the volcano, the step is accumulated. Otherwise, the track is located outside the volcano. The thickness of the volcano encountered along the muon track can thus be derived.
For a given density-length, there is a minimum muon energy (Emin) required, which can be estimated using either the empirical Bethe-Bloch formula [15] or the numerical values provided by the Particle Data Group[16].The continuous slowing down ability(CSDA)table by[17]gives the relationship between the initial muon kinetic energy and the average penetration depth in various materials. We show the penetration depth for water (red solid line) in Fig. 1). Based on the modified Gaisser’s formula (Eq. 1), the percentage of muons with energies larger than the minimum muon energy (muon survival ratio) can be calculated. By measuring the muon flux attenuation, Emin and the density-length of the investigated object can be deduced.Together with the path length obtained from geodetic measurements, the average density of the research target can then be determined. This is the principle behind muon radiography.
2.2 Muon Detector
With the development of particle detection techniques,particle detectors have become sufficiently precise to perform reliable measurements of muon trajectories. Various tracking detectors such as gaseous detectors, nuclear emulsions,and plastic scintillator detectors have been used for volcano density investigations.

Fig.1 (Color online)The muon survival ratios(percentage of muons with energy larger than the energy along the x-axis)at different zenith angles. The calculation was based on the modified Gaisser formula and the CSDA table from [17]. The energy spectrum for horizontal muons(purple line)is much harder than that for vertical muons(green line).The density-length and minimum muon energy required are also shown (red solid line, left y-axis)
Gaseous detectors, such as resistive plate chambers(RPC)[18],are widely used to detect high-energy charged particles,particularly muons.Typical RPCs have excellent detection efficiency as well as timing and spatial resolutions that are on the order of nanoseconds and centimeters,respectively.In addition,they can provide a large detection area at a low cost per unit area.
Emulsion detectors ( [8]) have high angular and spatial resolutions. In addition, they are portable and do not require electric power.
The plastic scintillator detector ( [7, 19, 20]) is another widely used particle detection device in nuclear and particle physics. The detection principle of a plastic scintillator detector is as follows: When the detector is hit by charged particles or radiation, the plastic scintillator bar emits flashes of scintillation light. Through coupling to photomultipliers or silicon photomultipliers, the scintillation light can be converted into electric signals. The fired scintillation bar is tagged in the same manner. Plastic scintillator detectors offer good time resolution on the order of nanoseconds and relatively high light output.They are easily produced commercially and relatively inexpensive. In addition, their flexibility and portable assembly offer great advantages for investigating volcanic density.
The muon telescope in our experiments was a threelayer plastic scintillator detector. Each detection layer has Nx= Ny= 16 scintillation bars with the dimensions of 80 cm× 5 cm ×1 cm. There are two subplanes in each layer placed orthogonal to each other to provide the x and y coordinates of the fired spot caused by energy deposition from a muon. A total of 256 pixels with the detection area size of 25 cm2are formed.The separation between the top and bottom panels is 100 cm. The readout electronics and details of the detector can be found in [21, 22].
3 Muon radiography at Wudalianchi
3.1 Detector placement
Our research target Laoheishan is located in Heihe,Heilongjiang Province, China. Laoheishan is one of the volcanoes of Wudalianchi. The volcano was measured to be approximately 1400 m in diameter and 200 m in height.Wudalianchi volcanoes (referring to Laoheishan unless otherwise noted) are very interesting because the main stages in the geological effects of ongoing geomorphological evolution can be studied in these volcanoes, and they are the youngest volcanoes in China.The last eruption occurred approximately 300 years ago [23].
Before the measurements, we conducted a geological survey using an UAV. A high-precision 3D image of the volcano was obtained (Fig. 2a). The horizontal resolution of the drone image is 1 cm and the vertical resolution 10 cm.
A plastic scintillator detector was deployed at a distance of about 250 m from the Laoheishan volcano.From the 3D image of the volcano, we calculated the path length of the muon trajectory. The calculated path lengths are presented in Fig. 2b.The path length was obtained from the detector point of view and is given in the geological frame in which the horizontal axis denotes the azimuth angle and the vertical axis denotes the elevation angle. The elevation angle is 0°at ground level and 90°directly overhead. The azimuth angle is 0°at true north in the horizontal plane,and ranges from 0°to 180°clockwise,and from 0°to-180°anticlockwise. The path lengths are represented by different colors and the 100 m contour lines are superimposed on them. The path length of the volcano is a crucial input for volcano density devolution.

Fig. 2 (Color online) a 3D image of volcano collected by the unmanned aerial vehicle system. b Muon path length inside the volcano from the detector point of view.The black solid lines are 100 m contour lines superimposed on the path length map.The black and red dashed regions denote the fields of view of the detector facing the volcano during the two stages of data taking (10° west of north and 30° east of north)
Based on the path length image, the detector was elevated to 20°to improve the scanning of the volcano. The acceptance was thus increased and the time for data taking shortened.The detector was located at an altitude of 400 m.The highest part of the volcano is approximately 600 m;therefore,the relative height of the volcano with respect to the detector was approximately 200 m. The detector angle of the volcano was a cone with an opening angle of approximately 43°. The angular resolution of the plastic scintillator detector is 50 mrad and its spatial resolution is a few tens of meters at a distance of 250 m.
3.2 Data Taking
The measurements were performed between September 23rd and November 10th 2019 for approximately 68 days at the Laoheishan site. More than 3 million muons were collected. The data presented in this study were obtained over three experimental stages: First, the detector was oriented 10°west of north to perform volcano imaging(Fig. 3a). The detector was then rotated to the true west to record the muon flux from the open sky (Fig. 3b). The open-sky measurements were used for comparison with the theoretical predictions from the modified Gaisser formula.The measured fluxes should agree well with the modeled flux.Finally,the detector was oriented 30°east of north to cover the missing part of the volcano (Fig. 3c, d) corresponding to the part outside the field of view of the detector in the first stage. The fields of view of the detector facing the volcano in the two stages are shown in Fig. 2b. Data were collected over a period of approximately one day.All the muon events were recorded for later analysis.
4 Data analysis
4.1 Data processing method
The following data selection method was used to determine the muon tracks in our measurements: Muon tracks were selected from the event samples in which with all three detection panels fired. The muon trajectories are supposed to be straight lines and were determined using the following line selection criteria:


Fig. 3 (Color online) Detector arrangement in the 3 stages of data taking
where 1 on the right-most side denotes the ID difference between the scintillation bars,and(x1,y1),(x2,y2),and(x3,y3) are the coordinates of the fired spots in each detection panel. Euler rotation was performed to obtain the zenith and azimuth coordinates (θg, ϕg) (subscript g denotes geological)of the muon tracks in the geological coordinate frame. The muon track in the geological coordinate frame is thus derived.
To evaluate the muon flux, various corrections were made to remove the impact of the detector response. Efficiency correction was performed on the plastic scintillator bars. The overall efficiency correction factor for each scintillator bar was determined from the vertical muon samples. Because there are three detection panels, the efficiency of each scintillation bar can be derived by dividing the number of events registered by each bar by the number of coincident events from the remaining two bars.The overall efficiency includes the contributions from the light yield of the plastic scintillator, the photon detection efficiency of the silicon photomultiplier (SiPM), and the threshold of the electronics. The overall efficiency value extracted for each scintillator bar is presented in Fig. 4a.The average efficiency of the 96 scintillator bars is approximately 85%. There were two scintillator bars with extremely low efficiencies of less than 60%, which might have been caused by poor connection to the SiPM.
Because the measured number of muon events is proportional to the solid angle and detection area, it is necessary to perform solid angle and acceptance correction to obtain the absolute muon flux. The muon trajectory is restricted by the detection pixel pair in the top and bottom panels. The solid angle subtended by the muon trajectory from the detection pixel on the top panel to the detection pixel on the bottom panel was calculated following the method introduced in [24] and is shown in Fig. 4b.
In Fig. 4b, θx(θy) was defined as atan(5× Δx/d)(atan(5×Δy/d)). Δx(Δy) is the ID difference between the detection pixels along the x(y) direction and d is the distance between the top and bottom detection panels. The numerical value of 5 is the width of the scintillation bars.All the values are given in centimeters. The solid angle decreases rapidly with increasing θxor θy. For vertical muons (i.e., θx, θy= 0°), the solid angle spanned by each detection pixel is approximately 2.5×10⁻³sr.
The detector acceptance is introduced to account for differences in the effective detection area of the muon detector for muons with different injection directions. For example, for muons injected perpendicularly into the detection panel, there are 16×16 detection pixels with a detection area of 25 cm2for each detection pixel, forming an acceptance of approximately 16 cm2·sr.The acceptance function (cm2· sr) corresponding to the detector configuration is shown in Fig. 4c. The acceptance also decreases quickly with increasing θxor θy.

Fig.4 (Color online)Detector response-related corrections.a Overall efficiency of the 96 scintillator bars. There are 6 panels with 16 scintillation bars on each panel.b and c Solid angle and acceptance as functions of θx and θy
The muon flux was measured by applying the abovementioned corrections, and the results are presented in Fig. 5. The measured results as a function of the zenith angle are shown in Fig. 5a. The open-sky muon flux (red dots) and its comparison with the prediction from the modified Gaisser formula (solid blue line) are also presented. The discrepancy with the latter is probably due to contamination from muon-like particles, such as electrons and protons,and will be discussed later.The pixel-by-pixel muon flux measurement results in the open-sky and volcano cases for each detection pixel are also shown. Figure 5b shows the results in the open-sky case. The muon flux decreased rapidly with the elevation angle. For elevation angles of less than 20°, the flux was smaller than 0.001. Figure 5c shows the same variable for the volcano case. A comparison between the open-sky flux measurement and the modified Gassier prediction was also performed. There is good overall agreement with ratio values varying from 0.9 to 1.2, as shown in Fig. 5d. This proves that the muon detector, including its solid angle and acceptance, was understood correctly.
Another part of the data analysis is volcano density analysis.For this purpose,the muon transmission power is defined as the ratio of the muon event rates in the volcano and open-sky cases, as shown in the first line of Eq. 5. By substituting Eq. 2 and Eq. 3 into the first line of Eq. 5, the muon transmission power can be further rewritten as the second line of Eq. 5.

Here, the subscript V(O) denotes the volcano (open-sky)case. By integrating the muon energy spectrum given by the modified Gaisser formula in Eq. 1,Emin,the minimum energy the muon must possess to cross the volcano without being absorbed, could be obtained. The CSDA table from[17], which lists the CSDA values for various materials,was used to evaluate the energy deposited by the muon when it crossed the volcano. Here, we used the numerical values for standard rock. The functional relationship between the density-length ρ.l and muon transmission power Kα, that is, the muon survival ratio, can then be deduced. The results are presented in Fig. 1 and used for the volcano density analysis.
4.2 Muon radiography results
Muon radiography can be used to obtain the profile of the volcano through the muon flux ratio plot.The flux ratio plot was obtained from the pixel-by-pixel ratios of the flux measurement results for the volcano and open-sky cases.In addition,detector-related corrections,such as the efficiency correction for the scintillation bars and the solid angle and acceptance corrections,can be canceled out naturally in the pixel-by-pixel ratio calculation.

Fig. 5 (Color online) Flux measurement results. a: Muon flux measurement results in the open-sky case (red dots), prediction by modified Gaisser formula (solid blue line), and simulated flux results under CRY input w/ and w/o e-, p backgrounds (green and black dots, respectively). b and c: Pixel-by-pixel muon flux measurement results in the open-sky and volcano cases. d: Pixel-by-pixel comparison of the open-sky flux measurement results and the modified Gassier formula prediction

Fig. 6 (Color online) Muon radiography results. a Muon flux ratio plot of the volcano and open-sky cases.There is an obvious separation between air, which is represented by the blue part, and the volcano,which is represented by the colorful part. b Unfolded density plot of the volcano.Because of noise,the absolute density does not have any physical meaning. Here, we show the relative density map
The muon flux ratios are presented in Fig. 6a.The black curves represent the contour lines of the path length in the volcano. The volcano boundary is denoted by the outermost black curve. The muon flux ratio is represented by different colors in which blue represents ratio values above 0.6.There is good agreement between the superposition of the flux ratio plot and the volcano path length. The impact of the volcano can be observed from the ratio plot. Muons with energies less than Emin were stopped inside the volcano, resulting in a small ratio value, which reflects the average density of the volcano along the specific direction of the muon track. The large ratio values in the regions without the volcano indicate that the muons passed through only air, as shown by the blue part in Fig. 6a. In this way,the profile image of the Laoheishan volcano was obtained using the muon telescope.
The inner density structure of the volcano is the research focus of this study. Based on the muon flux ratio analysis,the density was unfolded through the following procedures:The flux ratio value for a given azimuth and elevation angle was first obtained. Using the modified Gaisser formula, the minimum energy required to travel through the volcano at the given zenith angle was then calculated.The density-length could subsequently be deduced from the stopping power curve. In this study, we used the CSDA curve for standard rock.Because we have already obtained the path length from the drone-scanning data, the density could be deduced directly by dividing the density-length by the path length. The density map could then be obtained using the above procedure.The density at most regions was approximately 0.5 g/cm3. It was assumed that the average density of the volcano is 1.7 g/cm3.The measured ratio was approximately one order of magnitude larger than the expected value. Contamination from background events could be the source of the discrepancies between the observed and expected ratios. A background analysis will be performed in the next section. We therefore show only the relative density (Fig. 6b).
4.3 Background analysis
The background could be the source of the discrepancies between the observed and expected muon fluxes. The measured flux was much larger than the value expected from the modified Gaisser formula. To investigate the causes of the higher flux measurement results, a Geant4[25]simulation package was developed to evaluate the data taking process in the open-sky case. The simulation chain consisted of particle generation, particle transportation,detector response,and digitization.Particle generation was performed using the CRY software[26],which can provide muons with realistic angular and momentum distributions.In addition to muons, background particles, such as electrons and hadrons, can also be generated according to a realistic model. The plastic scintillator detector was constructed and lifted up to 20°as in the actual experiment.The particle interactions with matter, such as ionization and scattering effects, were accounted for using the EM and hadronic physics list models in Geant4.
Monte Carlo truth information, such as the precise positions of the hits, energy deposition in the scintillator bars, and precise track lengths, could be obtained. The simulated hits were digitized according to the pixel size of the detector. The number of hits collected for each detection pixel was obtained from the simulation framework.We did not implement the volcano at present because realistic volcano modeling is complex and time consuming.
There were also some backward muons, that is, muons coming from the side without the volcano. Because the volcano is located in the north (azimuth angle 0°), the forward muon azimuth angle is assumed to be within the angular range of (-90°, 90°), and the remaining half of the angular range is defined as the backward direction. Considering the conditions of the practical observation field,the imaging performance can be degraded by backward muons.Based on the Monte Carlo truth,the ratio of muons from the forward direction to muons from the backward direction after selecting the muon samples that passed through all three panels was 100:1.494 under our detector configuration (Fig. 7). Therefore, the effect of the backward muons was trivial and had little effect on the final imaging results.
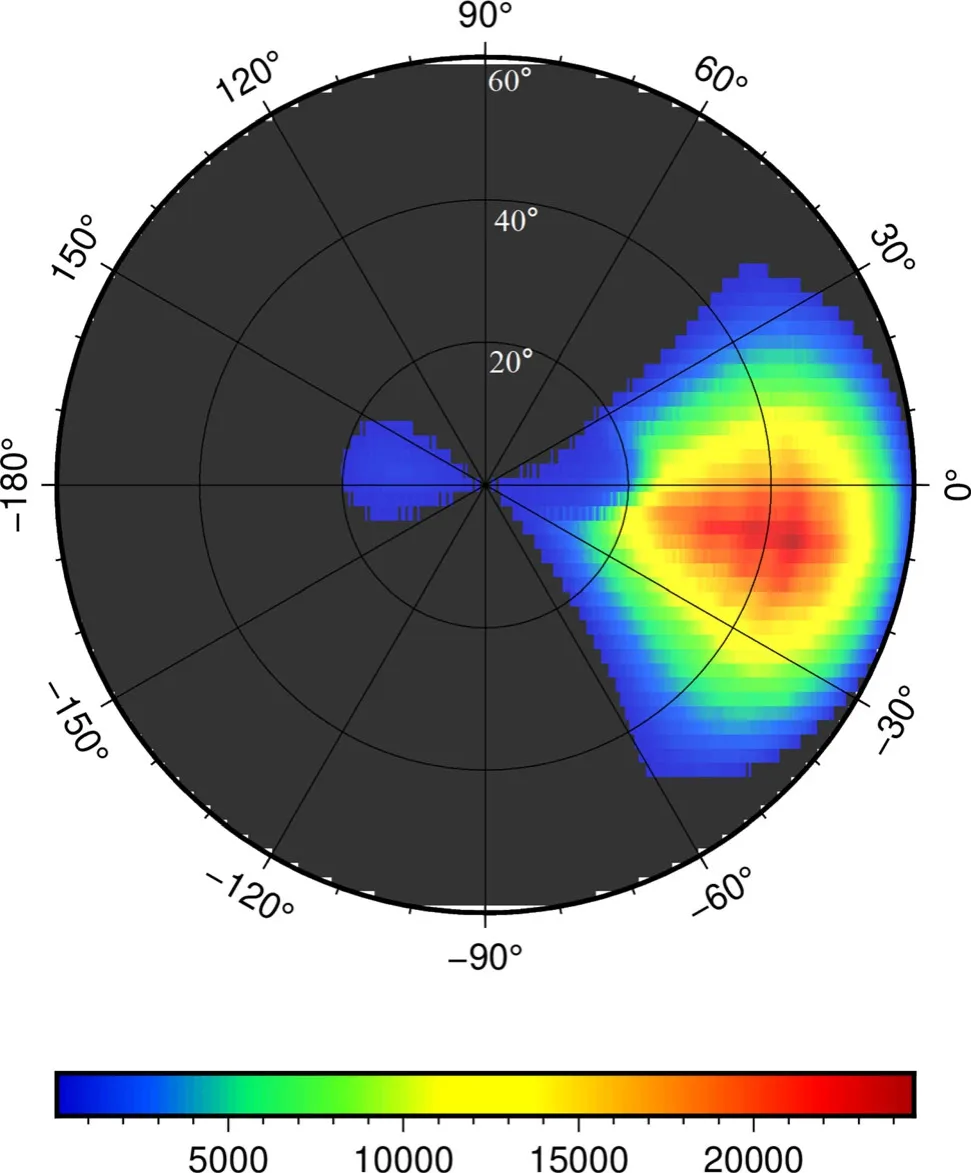
Fig.7 (Color online)θ,ϕ distribution of muons that can pass through all three detection panels
Using the simulation framework,we studied the charged particle background. The same analysis procedures were applied to the simulated events.The muon-only simulation results are shown as black crosses in Fig. 5a.The simulated muon-only flux agrees with the prediction results of the modified Gaisser formula.The calculated flux when muonlike particles such as electrons and protons were included in the simulation is represented by the green triangles in Fig. 5a. The results deviate from the modified Gaisser prediction and overlap with the measured flux data points(red points in Fig. 5a). Therefore, our detector received non-negligible amounts of charged particles,and the excess muon flux measured can be explained by the charged particle background.
5 Results and Discussions
In this study, we performed the first survey of muon transmission imaging of a volcano in China,and proved its capability to probe the internal density of large geological objects. The first muon radiography system based on plastic scintillator bars was constructed and demonstrated.A muon flux deficit in the elevation angle range covered by the volcano, i.e., 0-20°, could be clearly seen for the volcano case.We performed a relative ratio measurement and successfully obtained a profile image of the volcano. The boundary of the volcano is in good agreement with the drone-scanned image (Fig. 6a). We also used the relative density to inspect the inner structures of the volcano(Fig. 6b). The relative density map suggests the existence of significant spatial variation within the volcanic cone.Relatively higher densities were found near the surface of the volcanic cone, whereas relatively lower densities were found near the center of the volcanic cone. This is largely consistent with previous muon radiography results for the Showa-Shinzan lava dome in Japan [27].
Another finding is that the absolute internal density was contaminated by an overwhelming background.One of the major contributions to the background was the mimicking of muon events by charged particles such as electrons and protons (Fig. 5a). Systems with precise timing will be highly useful for suppressing the low-energy electron and proton backgrounds through particle identification based on time-of-flight differences. Radiography detectors with a higher momentum threshold, for example, 0.5 mm-thick aluminum sandwiched between detector layers, can stop the majority of electrons and protons below 1 GeV. In addition, the introduction of a lead plate between the scintillator layers is suggested. The lead plate can stop the passage of low-energy electrons or protons as well as deflect high-energy electrons and protons. Electrons and muons can then be discriminated by comparing their directions before and after the lead plate. These improvements will be implemented in future volcano imaging studies using muon radiography.
In summary,muon radiography is a promising technique for imaging internal density structures. Good background control and evaluation strategies are necessary to exploit the potential of muon radiography.
Acknowledgments We are quite grateful to Mr. Wang He for the tremendous help during the period of the Wudalianchi Experiment.He played an important role in the local logistics,it would be hard to get access to the experiment site without his help.
Author Contributions All authors contributed to the study conception and design. Material preparation, data collection and analysis were performed by Ya-Ping Cheng, Jing-Tai Li and Zhi-Wei Li. The first draft of the manuscript was written by Ya-Ping Cheng and all authors commented on previous versions of the manuscript. All authors read and approved the final manuscript.
杂志排行
Nuclear Science and Techniques的其它文章
- Determining absolute value of thermal neutron flux density based on monocrystalline silicon in nuclear reactors
- Transition edge sensor-based detector: from X-ray to γ-ray
- Graded composition and doping p-i-n AlxGa1-xAs/GaAs detector for unbiased voltage operation
- Commissioning of laser electron gamma beamline SLEGS at SSRF
- Silicon PIN photodiode applied to acquire high-frequency sampling XAFS spectra
- Improvement of machine learning-based vertex reconstruction for large liquid scintillator detectors with multiple types of PMTs