Response functions of a 4π summing gamma detector in β-Oslo method
2022-07-26GuoChunYangLeiMingHuaFeiLuJunSuZhiHongLiShiLunJinYangPingShenBingGuo
Guo-Chun Yang • Lei-Ming Hua • Fei Lu• Jun Su • Zhi-Hong Li •Shi-Lun Jin • Yang-Ping Shen • Bing Guo
Abstract The response functions of a 4π summing BGO detector were established using extensive experimental measurements and GEANT4 simulation. The partial and total efficiencies for all components of the γ-ray interaction with the BGO detector were also measured.These response functions and efficiencies will be used in the β-Oslo method experiments to study the neutron capture cross sections of radioactive heavy ions. The application of the response functions of the BGO detector under simulated continuum γ-rays and source measurement γ-rays proves that the method and response functions are reliable.
Keywords 4π Summing BGO detector ∙γ-Ray spectrum ∙Energy resolutions ∙GEANT4 simulation
1 Introduction
Understanding the origin of the elements from iron to uranium is one of the most important scientific questions for this century. The slow neutron-capture process (s-process) and rapid neutron-capture process (r-process) are the two most dominant processes accounting for the production of the majority of the heavy elements [1, 2]. However,there are many puzzles remaining in s-process nucleosynthesis, especially at the branch points where nuclei might live long enough to capture a neutron instead of β decay,owing to the difficulty of experimental measurements with radioactive targets [3–5]. Neutron star mergers were recently identified as the main site of the r-process[6–10]by combining astronomical observations with the detection of gravitational waves. It is impossible to directly measure the r-process cross sections,as they always relate to nuclei far from stability [11–13].
The Oslo method is an indirect technique for measuring neutron capture cross sections [14–16]. By measuring the sequential γ decay of the nuclei in highly excited states, it can simultaneously extract the nuclear level density(NLD)and γ-ray strength function (γ SF), which are the most significant properties of nuclei in the quasi-continuum region.The NLD replaces the discrete energy levels where the excited energy is high and the level spacing is too small to resolve the individual levels. Unlike experimental studies in low-exciting-energy regions [17–23], experiments to obtain information on the NLD are insufficient. γ SF is the average reduced radiation or absorption probability for any given photon energy. It contains information on pygmy resonances, giant electric dipole resonances, and scissors resonance [24].
The neutron capture cross sections can be reliably obtained using a Hauser-Feshbach reaction model and knowledge of γ SF, NLD, and the optical model potential(OMP) [25–28]. Moreover, the β-Oslo method is a newly developed Oslo method,in which nuclei populate the highenergy states through β decay. It can be applied to nuclei produced at low rates, allowing measurements of neutron capture rates far from stability [29,30].In addition to their importance in the study of nuclear structure and nuclear astrophysics, precise measurements of neutron capture cross sections are valuable for many new nuclear technologies [31, 32].
There are four main steps in the Olso method:unfolding the continuum γ-ray spectrum from nuclei at high excitation energies, extracting the first generation of γ-rays from the cascade γ decay, simultaneously extracting the NLD and γ SF, and then normalizing them with several known experimental data. There are various ways in which photons interact with γ-ray detectors, such as through the photoelectric effect, Compton scattering, and pair production.There is a non-negligible probability that not all of the photon energy is deposited in the detectors.Therefore,it is necessary to unfold the spectrum of γ-rays to obtain the real incident γ energy,that is,the true full energy γ spectrum.In the first step of the Oslo method, successful unfolding depends on accurate measurement of the response functions of the detectors [33, 34].
In this study,we deduced the response functions of a 4π summing BGO detector using the measurement data of several gamma sources, as well as GEANT4 simulation[35]with different incident γ energies.We also applied this response function to unfold the simulated γ spectra and γray source spectrum.
2 Experimental measurements and GEANT4 simulation
The 4π-summing BGO detector contains eight trapezoidal prismatic segments. Each of them is 250 mm long and 63 mm thick in the radial direction, and covers a 45 azimuthal angle. The model of the BGO detector is shown in Fig. 1. The inner red and yellow parts represent the BGO crystals and Cu shielding, respectively. The outer pink,yellow,and blue parts represent the flange,5 mm Cu shielding, and 100 mm Pb shielding, respectively, which can suppress the natural γ-ray background. During operation, the BGO crystals were maintained at approximately-10°C to improve the energy resolution.The spectra from all single BGO segments and that from the sum of the energies of all eight BGO segments were obtained. Both the single and summing spectra are critical in the β-Oslo method. This summing BGO detector was used in the Jinping underground nuclear astrophysics experiments [36, 37] and will be used in future β-Oslo experiments.

Fig. 1 (Color online) 3-D Model of the 4π summing BGO detector
The response function is a matrix R(E,Eγ), where Eγis the incident photon energy and E is the energy deposited in the detector. It is difficult to determine the efficiency of each component of the γ spectra, particularly in the highenergy region, because of the lack of high- and monoenergetic γ-ray sources.To establish the response matrix of the γ-ray detector, a method combining GEANT4 simulation and experimental correction was adopted. We measured the spectra of five γ-ray sources, namely241Am,137Cs,60Co,133Ba, and207Bi. All of the full energy peaks of these γ-rays can be considered as Gaussian distributions.After fitting the full energy γ peaks of the spectra,the peak positions and energy calibrations of each BGO segment were obtained.The calibration of a single BGO segment is shown in Fig. 2.It is close to a linear calibration,although there are a few deviations at the characteristic energy of some γ-ray sources.
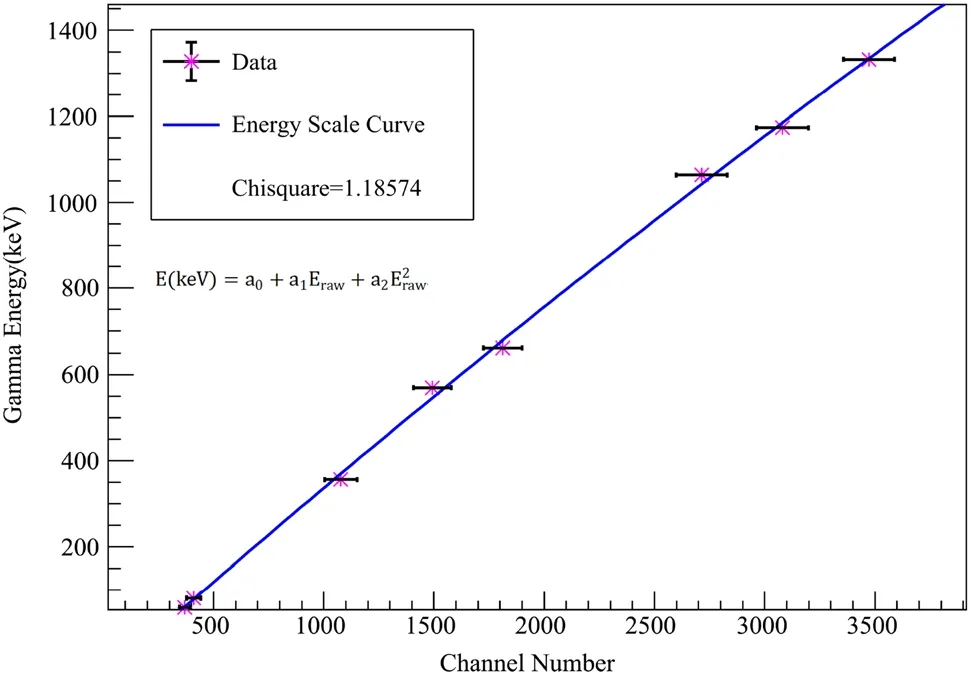
Fig. 2 The energy calibration of full energy peaks
The resolutions of all full energy peaks of these γ-ray sources were also obtained. The curve of the resolution versus the full deposited energy is shown in Fig. 3. The fitting function is a polynomial plus an exponential function, as shown in the figure. This information was used in the GEANT4 simulations.
The γ spectrum of60Co can be easily simulated using GEANT4. Owing to the lack of efficiency information in the60Co source measurement,we applied a special method to compare the experimental data and the simulation. The60Co provides two γ-rays in one decay, with energies of 1.173 MeV and 1.333 MeV.We chose the events gated on the high-energy γ-rays of60Co deposited in one BGO segment, as shown in Fig. 4a. We then plotted the lowenergy γ-ray peak spectra in the opposite detector segment,as well as in the other five segments that were nonadjacent to the chosen segment. We applied the same gate to both the data and simulation.After a detailed comparison of the full energy γ-ray peaks and the Compton continuum of the low-energy γ-ray, the GEANT4 simulation was corrected,and consistency between the measurements and simulation was achieved. Figure 4b and c show the simulation after correction and the experimental data. There is a slight difference between the peak positions because the energy calibration is slightly off at that point, as shown in Fig. 2.The minor correction of the simulation mainly involves efficiencies; this might be a result of the slightly wrong estimate of the solid angle that the BGO detector covers in the simulation. After the correction, we determined that GEANT4 simulation reproduced the measurements well.
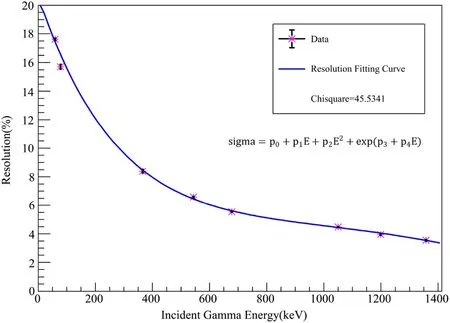
Fig. 3 Energy resolutions of the full energy peaks in one single segment of the BGO detector
To generate a response matrix corresponding to all possible incident γ energies,a special set of monoenergetic incident γ-ray events should be simulated. We selected the incident γ energies in the GEANT4 simulation to be the same as the decay energies of241Am,137Cs, and60Co. In addition, we chose 1600, 2000, 3000, 4000, 5000, 6000,7000 and 8000 keV as the other incident γ energies.In one β-Oslo experiment, high-energy excited nuclei undergo γ decay in different ways. The response function of the summing signal of the BGO differs according to the different average multiplicities of γ-rays. Here, we assume that the average multiplicity is equal to one as an example.
GEANT4 simulation was applied as a tool to obtain these single-energy incident γ spectra and obtain the response function of every component by fitting the γ spectra. A complete γ spectrum usually consists of the following components:a back-scattering peak,annihilation peak, single escape peak, full energy peak, and Compton continuum. Four examples of summing spectra fitting are shown in Fig. 5. Except for the Compton continuum, all other components of the γ spectra can be considered as Gaussian distributions. Backscattering is related to the γrays scattered back from the outside shield to the BGO crystals.When the incident γ-ray energy is twice as large as the rest mass of the electron,there is an annihilation peak at 0.511 MeV and a single escape peak at 0.511 MeV below the full energy peak. The efficiency of the double escape peak is too low to be observed.The fit of the single spectra is quite similar to that of the summing spectra, except that the full energy peak is relatively lower and the Compton continuum is relatively higher.
According to the resolutions, peak heights, and deposited energy positions of all Gaussian components obtained by fitting the γ spectra of several specific incident γ energies, the relationship between these three quantities of all components and the incident γ-ray energy can be obtained.The resolutions of each component of both the single spectra and the summing spectra are shown in Fig. 6.The resolutions of the full energy peaks are the best, while the resolutions of the single escape peaks are also good because here, the deposited energy in BGO is only 0.511 MeV smaller than that at the full energy peaks. The annihilation peaks are at 0.511 MeV; thus, the resolutions cannot be fine. Their efficiencies are extremely small, and even smaller when the incident γ-ray energy is low.Therefore, they cannot be observed in the low-energy region. The resolutions of the back-scattering peaks were out of order because of the complicated structure outside the BGO crystals.
3 Generation and application of the response functions

Fig. 4 Comparison of 60Co low-energy γ spectra in GEANT4 simulation and measurements. a The γ spectrum related to a single segment of the 4π summing BGO detector.b γ spectrum related to the opposite segment of the 4π summing BGO detector gated on the highenergy γ-ray in 60Co. c γ spectrum related to five segments of the 4π summing BGO detector gated on the high-energy γ-ray in 60Co

Fig. 5 (Color online) Fitting of all components of the summing spectra of the 4π BGO detector with several incident γ energies. a Fitting of all components of the summing spectrum with 59.5 keV incident γ energy. b Fitting of all components of the summing spectrum with 662 keV incident γ energy.c Fitting of all components of the summing spectrum with 1173 keV incident γ energy. d Fitting of all components of the summing spectrum with 6000 keV incident γ energy
The response function matrix of the detector is the key to unfolding the observed continuum γ-ray spectrum into a real full energy γ-ray continuum spectrum. The response function refers to the probabilities of different deposited energies with certain incident energies. Therefore, the response function of every component can be added to form the response function of the detector. The response functions of all Gaussian components can be easily calculated because their parameters have already been obtained.The threshold is set to 65 keV,the same that of as the real BGO detector. The remaining task is to generate the response function of the Compton continuum with any possible incident γ energy, knowing that of the Compton continuum of several sample incident γ energies.Once the incident energy of γ-ray is determined, the energy of the Compton background is related to the γ-ray scattering angle, according to Eq. (1).
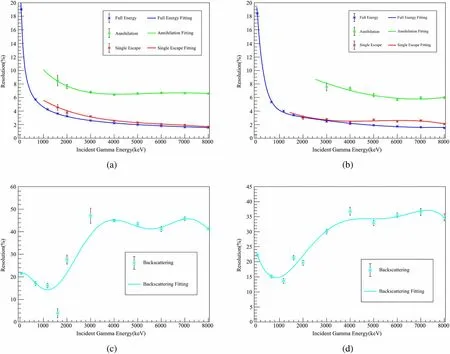
Fig. 6 (Color online) The resolutions of all components in the γ spectrum corresponding to incident γ energy in the 4π summing BGO detector. a The resolutions of all components except back-scattering in the γ single spectrum corresponding to incident γ energy in the 4π summing BGO detector. b The resolutions of all components except back-scattering in the γ summing spectrum corresponding to incident γ energy in the 4π summing BGO detector. c The back-scattering resolutions in the γ single spectrum corresponding to incident γ energy in the 4π summing BGO detector. d The back-scattering resolutions in the γ summing spectrum corresponding to incident γ energy in the 4π summing BGO detector
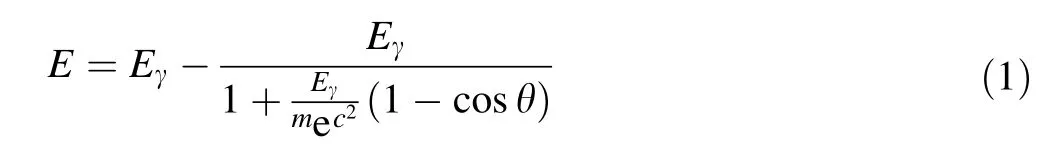
Thus, the Compton continuum should be interpolated between the channels corresponding to the same γ-ray scattering angle. Detailed equations can be found in Ref. [14].
The efficiencies of all components of both the single spectra and the summing spectra were obtained, as shown in Fig. 7. As we can see, the main components in the spectra are the full energy peaks and the Compton continuum. In the single spectra, the Compton continuum arises along with an increase in the incident γ energy because the probability of the γ-ray escaping from a single segment increases. In the summing spectra, with all BGO crystals together, the possibility of all γ energy being absorbed by the BGO is large,and the Compton continuum is suppressed. The total efficiencies of all eight BGO segments were much larger than the total efficiencies of a single segment.Furthermore,it is reasonable that the trends of the total efficiencies in the single and summing spectra are different. The partial and total efficiencies for all components of the γ-ray interaction are as important as the response functions in the Oslo method.
By adding the response matrix of all the components,we deduced the response function of a single segment of the BGO detector and 4π summing BGO detector for incident γ energies between 65 keV and 8000 keV with a step of 5 keV,as shown in Fig. 8.In the real β-Oslo experiments,we set the step size to 20 keV because of the low statistics.

Fig. 7 (Color online) The efficiencies of all components in the γ single and summing spectra corresponding to incident γ energy in the 4π summing BGO detector. a The efficiencies of all components in the γ single spectrum corresponding to incident γ energy in the 4π summing BGO detector.b The efficiencies of all components in the γ summing spectrum corresponding to incident γ energy in the 4π summing BGO detector

Fig. 8 (Color online) The response function matrices of a segment and the summing signal of the BGO detector. a The response matrix of a segment of the BGO detector. b The response matrix of the summing signal of the BGO detector
To verify the reliability of the response functions we created, we used GEANT4 to simulate randomly oriented γ-rays and injected them into the BGO detector. The original γ-rays are called u and the observed folded spectra are called f in Fig. 9a, b. The low-energy peak is larger in the single spectrum than that in the summing spectrum.This is because the efficiencies of the full energy peaks of a single BGO segment are low. The first step of the Oslo method was used to unfold f.We cannot directly multiply f with the inverse of the response matrix R,as the result will be incorrect because of the large oscillations. This is because the response function cannot be completely accurate.We can use the folding iteration method,which is part of the Oslo method, to unfold the observed spectra f.Consider Eq. (2):

where I is the identity matrix. We can increase n (the number of terms) in this equation one by one to approach the correct answer. However, n cannot be too large, or the unfolded spectra will result in large oscillations. The unfolded spectra we obtained are called u*,compared with the original u in Fig. 9a, b.
To reduce oscillations, the Compton subtraction method[14]was applied.The main idea of this method is to extract part of the f spectra that comes from the measured data of Compton scattering,according to the efficiencies of the other components corresponding to incident γ energy and the previous u*spectra.The extracted parts are called c and were smoothed with a resolution of 1.0 full wave half maximum (FWHM). The results are shown in Fig. 9c, d.We could choose another strong smooth method if the statistics were low. Finally, we used smoothed c#to calculate the unfolded spectra again, knowing the partial and total efficiencies for all components corresponding to the incident γ energy. The final results are called u#for comparison with the original simulated u in Fig. 9e, f. It can be observed that the deviations are very small. The unfolding from the observed continuum spectra to the fullenergy peak continuum spectra was successful. Both the signals in a single segment of the BGO detector and the summing BGO signals were involved in this simulation and verification.
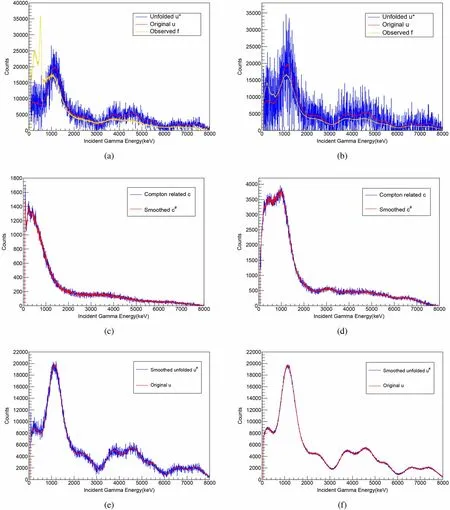
Fig. 9 (Color online) Application of the response function matrices of the 4π summing BGO detector. a The original incident energy distribution u and the resulting unfolded spectrum u* obtained with the folding iteration method of a single segment of BGO detector. b The incident energy distribution u and the resulting unfolded spectrum u* obtained with the folding iteration method of the summing signal of the BGO detector. c The Compton background spectrum c obtained with the Compton subtraction method of a single segment of the BGO detector.d The Compton background spectrum c obtained with the Compton subtraction method of the summing signal of the BGO detector. e The incident energy distribution u and the resulting unfolded spectrum u# obtained with the Compton subtraction method of a single segment of the BGO detector. f The incident energy distribution u and the resulting unfolded spectrum u# obtained with the Compton subtraction method of the summing signal of the BGO detector

Fig. 10 (Color online) The observed and the unfolded single spectrum of the 207Bi γ source in experimental measurement
To further verify our method, we unfolded the single spectrum of the207Bi source measurement, as shown in Fig. 10. The energies of γ-rays emitted from207Bi are 569.7 keV and 1063.6 keV. The unfolding of these two peaks was successful, and the events of the Compton continuum in the observed spectrum went into the full energy peaks in the unfolded spectrum. The low peak at 1600 keV refers to two γ-rays in one event that enter the same segment of the BGO detector. Thus, the unfolding result for this peak cannot be correct. Such events should be excluded in β-Oslo experiments. An increase in the granularity of the detector can also be considered to reduce such events. We proved that the response functions of the BGO detector and the first step of the Oslo method are reliable. The following steps of the β-Oslo method with this 4π-summing BGO detector will be discussed in our next paper.
4 Summary
The response functions, as well as the partial and total efficiencies for all components of γ-ray spectra, for the single segments of the BGO detector and the summing signal of the 4π BGO detector were established for future β-Oslo method experiments,which will indirectly measure the neutron capture cross sections of heavy ions far from stability. Experimental measurements and GEANT4 simulation were combined to determine the response functions.Based on the test results of simulated continuous incident gamma-rays and the measurement of γ-ray source data,the response functions and the first step of the Oslo method are proven to be practical and reliable.
AcknowledgementsThe authors would like to thank Prof. M. Guttormsen and his research group from the University of Oslo in Norway for their assistance with the Oslo method.
Author ContributionsAuthor contributions:All authors contributed to the study conception and design. Material preparation, data collection and analysis were performed by Guo-Chun Yang, Lei-Ming Hua,Fei Lu and Jun Su.The first draft of the manuscript was written by Guo-Chun Yang and Fei Lu. All authors commented on previous versions of the manuscript. All authors read and approved the final manuscript.
杂志排行

Nuclear Science and Techniques的其它文章
- The role of deformations and orientations in an alpha ternary fission of Thorium
- Feedforward compensation of the insertion devices effects in the SSRF storage ring
- A new radar stealth design excited by 210Po and 242Cm
- Development of an ultrafast detector and demonstration of its oscillographic application
- Low-radioactivity ultrasonic hydrophone used in positioning system for Jiangmen Underground Neutrino Observatory
- Study on analytical noise propagation in convolutional neural network methods used in computed tomography imaging