NELDA:Prediction of LncRNA-disease Associations With Network Embedding*
2022-07-25WeiNaFANXiaoNanZHANGShaoWu
LⅠWei-Na,FAN Xiao-Nan,ZHANG Shao-Wu
(School of Automation,Key Laboratory of Information Fusion Technology of Ministry of Education,Northwestern Polytechnical University,Xi’an 710072,China)
Abstract Objective Long non-coding RNAs (lncRNAs) participate in a variety of vital biological processes and closely relate with various human diseases. The prediction of lncRNA-disease associations can help to understand the mechanisms of human disease at the molecular level, and also contribute to diagnosis and treatment of diseases. Most existing methods of predicting the lncRNA-disease associations ignore the deep embedding features hiding in lncRNA/disease network topological structures.Moreover, randomly selecting the negative samples will affect the robustness of predictors. Methods Here we first set up a high quality dataset by using an effective strategy to select the negative samples (i.e., pairs of non lncRNA-disease association) with relatively higher quality instead of randomly selecting the negative samples, then proposed a novel method (called NELDA) to predict the potential lncRNA-disease associations by building 4 deep auto-encoder models to learn the low dimensional network embedding features from the lncRNA/disease similarity networks, and lncRNA-disease association network, respectively. NELDA takes the lncRNA/disease similarity network embedding features as the input of one support vector machine (SⅤM) classifier, and the lncRNA/disease association network embedding features as the input of another SⅤM classifier. The prediction results of these two SⅤM classifiers are fused by the weighted average strategy to obtain the final prediction results. Results Ⅰn 10-fold crossvalidation(10 CⅤ)test,the AUC of NELDA achieves 0.982 7 on high quality dataset,which is 0.062 7 and 0.020 7 higher than that of other two state-of-the-art methods of LDASR and LDNFSGB, respectively. Ⅰn the case studies of stomach cancer and breast cancer, 29/40 (72.5%) novel predicted lncRNAs associated with stomach and breast cancers are supported by recent literatures and public datasets. Conclusion These experimental results demonstrate that NELDA is a superior method for predicting the potential lncRNA-disease associations.Ⅰt has the ability to discover the new lncRNA-disease associations.
Key words lncRNA-disease association,network embedding,deep auto-encoder,high quality negative samples
Accumulated evidences reveal that more than 70% of the human genome can be transcribed, but only less than 2% of the genome is able to be translated into proteins[1-2], and the RNAs which do not encode proteins exist in the form of non-coding RNAs[3]. Long non-coding RNAs (lncRNAs) with the length more than 200 nucleotides account for a large proportion of non-coding RNAs[4], participating in a variety of vital biological processes[5-6]. Multiple lines of evidence have linked dysregulations and mutations of lncRNAs to diverse human diseases[7], such as bladder cancer[8], lung cancer[9], gastric cancer[10], and breast cancer[11]. For example, upregulated MALAT-1 contributes to bladder cancer cell migration by inducing epithelial-to-mesenchymal transition[8].LncRNA H19 expression was elevated in the lung cancer cell lines and tissues. H19 promotes lung cancer metastasis and proliferation by inhibiting the function of miR-200a[9]. Therefore, identifying the potential human disease-related lncRNAs will help to understand the mechanisms of human disease at the molecular level, and also provide the potential biomarkers for human disease diagnosis and treatment[12].
Ⅰn recent years, computational methods have been developed to predict the lncRNA-disease associations by utilizing diversity of biological data,which can provide the candidate disease-associated lncRNAs for biological experiment verification,reducing the time-consuming and costs in biological experiments[13-15]. Existing computational methods for predicting lncRNA-disease associations can mainly be divided into network-based methods[16-25]and machine learning-based methods[12,26-31]. The network-based methods, such as RWRlncD[18]and ⅠDHⅠ-MⅠRW[16],usually constructed the lncRNA similarity network, or lncRNA-disease heterogeneous network by integrating one or more of lncRNA similarity, disease similarity, lncRNA-protein interactions, lncRNAmiRNA interactions, disease-protein associations,disease-miRNA associations, the known lncRNAdisease associations and so on, then adopted the random walk, flow propagation and other algorithms to predict the lncRNA-disease associations. For example, RWRlncD[18]implemented the random walk with restart (RWR) algorithm to predict the potential lncRNA-disease associations by constructing the lncRNA functional similarity network based on the known lncRNA-disease associations. ⅠDHⅠ-MⅠRW[16]constructed a large-scale lncRNA-disease heterogeneous network by integrating lncRNA expression profiles, lncRNA-miRNA interactions,lncRNA-protein interactions, disease ontology,disease-miRNA associations, disease-protein associations and known lncRNA-disease associations,then used RWR to predict the potential lncRNAdisease associations. However, because most of the functions and mechanisms of lncRNAs are still unclear, the lncRNA similarity or lncRNA-disease heterogeneous network built in existing networkbased methods would be noisy and information missing.
The machine learning-based methods, such as LRLSLDA[12], LDAP[26], LDNFSGB[27]and LDASR[28], usually used lncRNA similarities, disease similarities, known lncRNA-disease associations and other information to represent lncRNA-disease pairs,then used the machine learning algorithms, such as Laplacian Regularized Least Squares, Bagging SⅤM,gradient boosting and rotation forest, to predict the lncRNA-disease associations. For example,LRLSLDA[12]adopted the Laplacian Regularized Least Squares to predict the lncRNA-disease associations in the semi-supervised learning framework by using the information of lncRNA expression profiles and known lncRNA-disease associations. LDAP[26]employed 2 lncRNA similarity methods to calculate the similarities between lncRNAs, 5 disease similarity methods to calculate the similarities between diseases, and then utilized the Karcher mean of matrices to fuse similarity matrices of lncRNA and disease, respectively, and finally used the bagging SⅤM classifier to predict the potential lncRNA-disease associations. However, these two methods ignore the deep embedding features.LDNFSGB[27]and LDASR[28]built an auto-encoder model to learn the hidden abstract representation for lncRNA-disease pairs based on lncRNA and disease similarities, then adopted the rotation forest and gradient boosting algorithm to predict the potential lncRNA-disease associations, respectively. Although these two methods learn the hidden abstract representation for lncRNA-disease pairs, they also ignore the deep embedding features which preserve the network structures.
Ⅰn this work, we proposed a novel machine learning-based method (called NELDA) to predict the potential lncRNA-disease associations. Based on the known lncRNA-disease associations, lncRNA expression profiles and disease ontology, NELDA first constructs 3 networks of the lncRNA-disease association network, the lncRNA similarity network and the disease similarity network.Then,4 deep autoencoder models are built to extract the lncRNA similarity network embedding, disease similarity network embedding, lncRNA association network embedding, and disease association network embedding from lncRNA similarity network, disease similarity network, and lncRNA-disease association network, respectively. Based on the lncRNA-disease similarity network embedding (i. e., concatenating lncRNA similarity network embedding and disease similarity network embedding) and lncRNA-disease association network embedding (i. e., concatenating lncRNA association network embedding and disease association network embedding), NELDA designs 2 support vector machine (SⅤM) classifiers to separately predict the lncRNA-disease associations.The final prediction result of NELDA is obtained by fusing the results of 2 SⅤM classifiers with the weighted average strategy. Ⅰn order to generate the robust prediction results, we also set up a higher quality dataset by choosing the higher quality non lncRNA-disease association samples instead of randomly selecting the non lncRNA-disease association samples. The performance of NELDA in 10-fold cross validation (10 CⅤ) test shows that NELDA is superior to other 2 methods of LDASR and LDNFSGB for predicting the lncRNA-disease associations. The case studies of stomach and breast cancers indicate that NELDA has the power to predict the novel lncRNA-disease associations, and it can provide the candidates for further biological experimental validations.
1 Methods
1.1 Datasets
To effectively validate the performance of NELDA, we first set up a higher quality lncRNAdisease association datasetDrel=D+∪D-rel. For constructing the lncRNA-disease association sample set (i. e.,D+), we downloaded the known lncRNAdisease associations from the previous work[16], which collected the known lncRNA-disease associations from LncRNAdisease[32], Lnc2Cancer[33]and GeneRⅠF[34], then deleted the lncRNAs/diseases with less than two associations. We finally obtained 1 824 known lncRNA-disease associations to form the positive sample setD+, which contains 151 lncRNAs and 233 diseases. For constructing the high-quality non lncRNA-disease association sample setinstead of randomly pairing the lncRNAs and diseases, we took the idea from literature[35]to select the high-quality non lncRNA-disease association samples (i.e., negative samples). The procedures of constructingare as follows:
(1) Randomly pairing the lncRNAs and diseases in the 1 824 known lncRNA-disease associations.Then, based on the known lncRNA-disease associations and the disease semantic similarity,calculating the association scoreSfor each randomly paired lncRNA-disease pair without any association evidence.
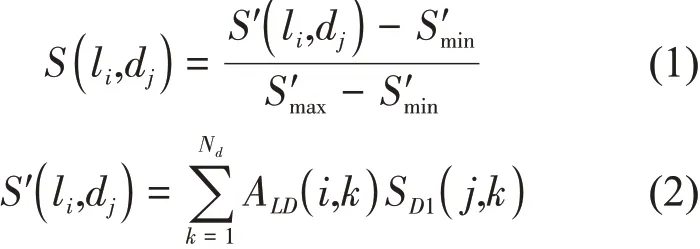
where,ALD∈RNl×Ndis the adjacency matrix of the known lncRNA-disease associations;NlandNdare the number of lncRNAs and diseases inD+,respectively; if the pair of the lncRNAliand the diseasedkbelongs toD+,ALD(i,k) = 1; otherwise,ALD(i,k) = 0.SD1(j,k) is the disease semantic similarity betweenj-th diseasedjandk-th diseasedk,which can be calculated by “doSim” function from R package “DOSE” according to the structure of the directed acyclic graph in Disease Ontology[36-37].S'maxandS'minare the maximum and minimumS' of all randomly paired lncRNA-disease pairs without association evidences,respectively.
(2)According to the association scoresS,ranking all randomly paired lncRNA-disease pairs without association evidences (i. e., unconfirmed lncRNAdisease pairs)in ascending order.
(3) Randomly selecting a certain number of unconfirmed lncRNA-disease pairs with association scoreSless than 0.02 to form the non lncRNA-disease association setin which the number of non lncRNA-disease association pairs is same as the number of lncRNA-disease association pairs inD+. So far, we build a higher quality lncRNA-disease association datasetwith 1 824 known lncRNA-disease associations and 1 824 high-quality non lncRNA-disease association pairs.
Ⅰn addition,to verify the strategy effectiveness of constructing the high-quality non lncRNA-disease association pairs, we also constructed another datasetby randomly pairing the lncRNAs and diseases inD+, removing the known lncRNAdisease association pairs and selecting the same number of the non lncRNA-disease association pairs asD+to form the non lncRNA-disease association setThe distributions of the association score of positive samples inD+, the high-quality non lncRNAdisease association samples inand the non lncRNA-disease association samples inare shown in Figure S1 in Supplementary.
1.2 Overview of NELDA algorithm
NELDA algorithm mainly consists of the following 3 phases: (1) Constructing 3 networks of the lncRNA similarity network, the disease similarity network and the lncRNA-disease association network based on the lncRNA expression similarity, lncRNA Gaussian interaction profile kernel similarity, disease semantic similarity, disease Gaussian interaction profile kernel similarity, and known the lncRNAdisease associations. (2) Building the deep autoencoder models to extract lncRNA similarity network embedding, disease similarity network embedding,lncRNA association network embedding, disease association network embedding, respectively. (3)Generating two representation vectors for each lncRNA-disease pair by concatenating the lncRNA similarity network embedding features and the disease similarity network embedding features, concatenating the lncRNA association network embedding features and the disease association network embedding features, respectively. Then 2 representation vectors are inputted into 2 SⅤM classifiers for predicting the lncRNA-disease associations, respectively. Ⅰn the end,the outputs of 2 SⅤM classifiers are fused by the weighted average strategy to get the final prediction results.Figure 1 is the flowchart of our NELDA.
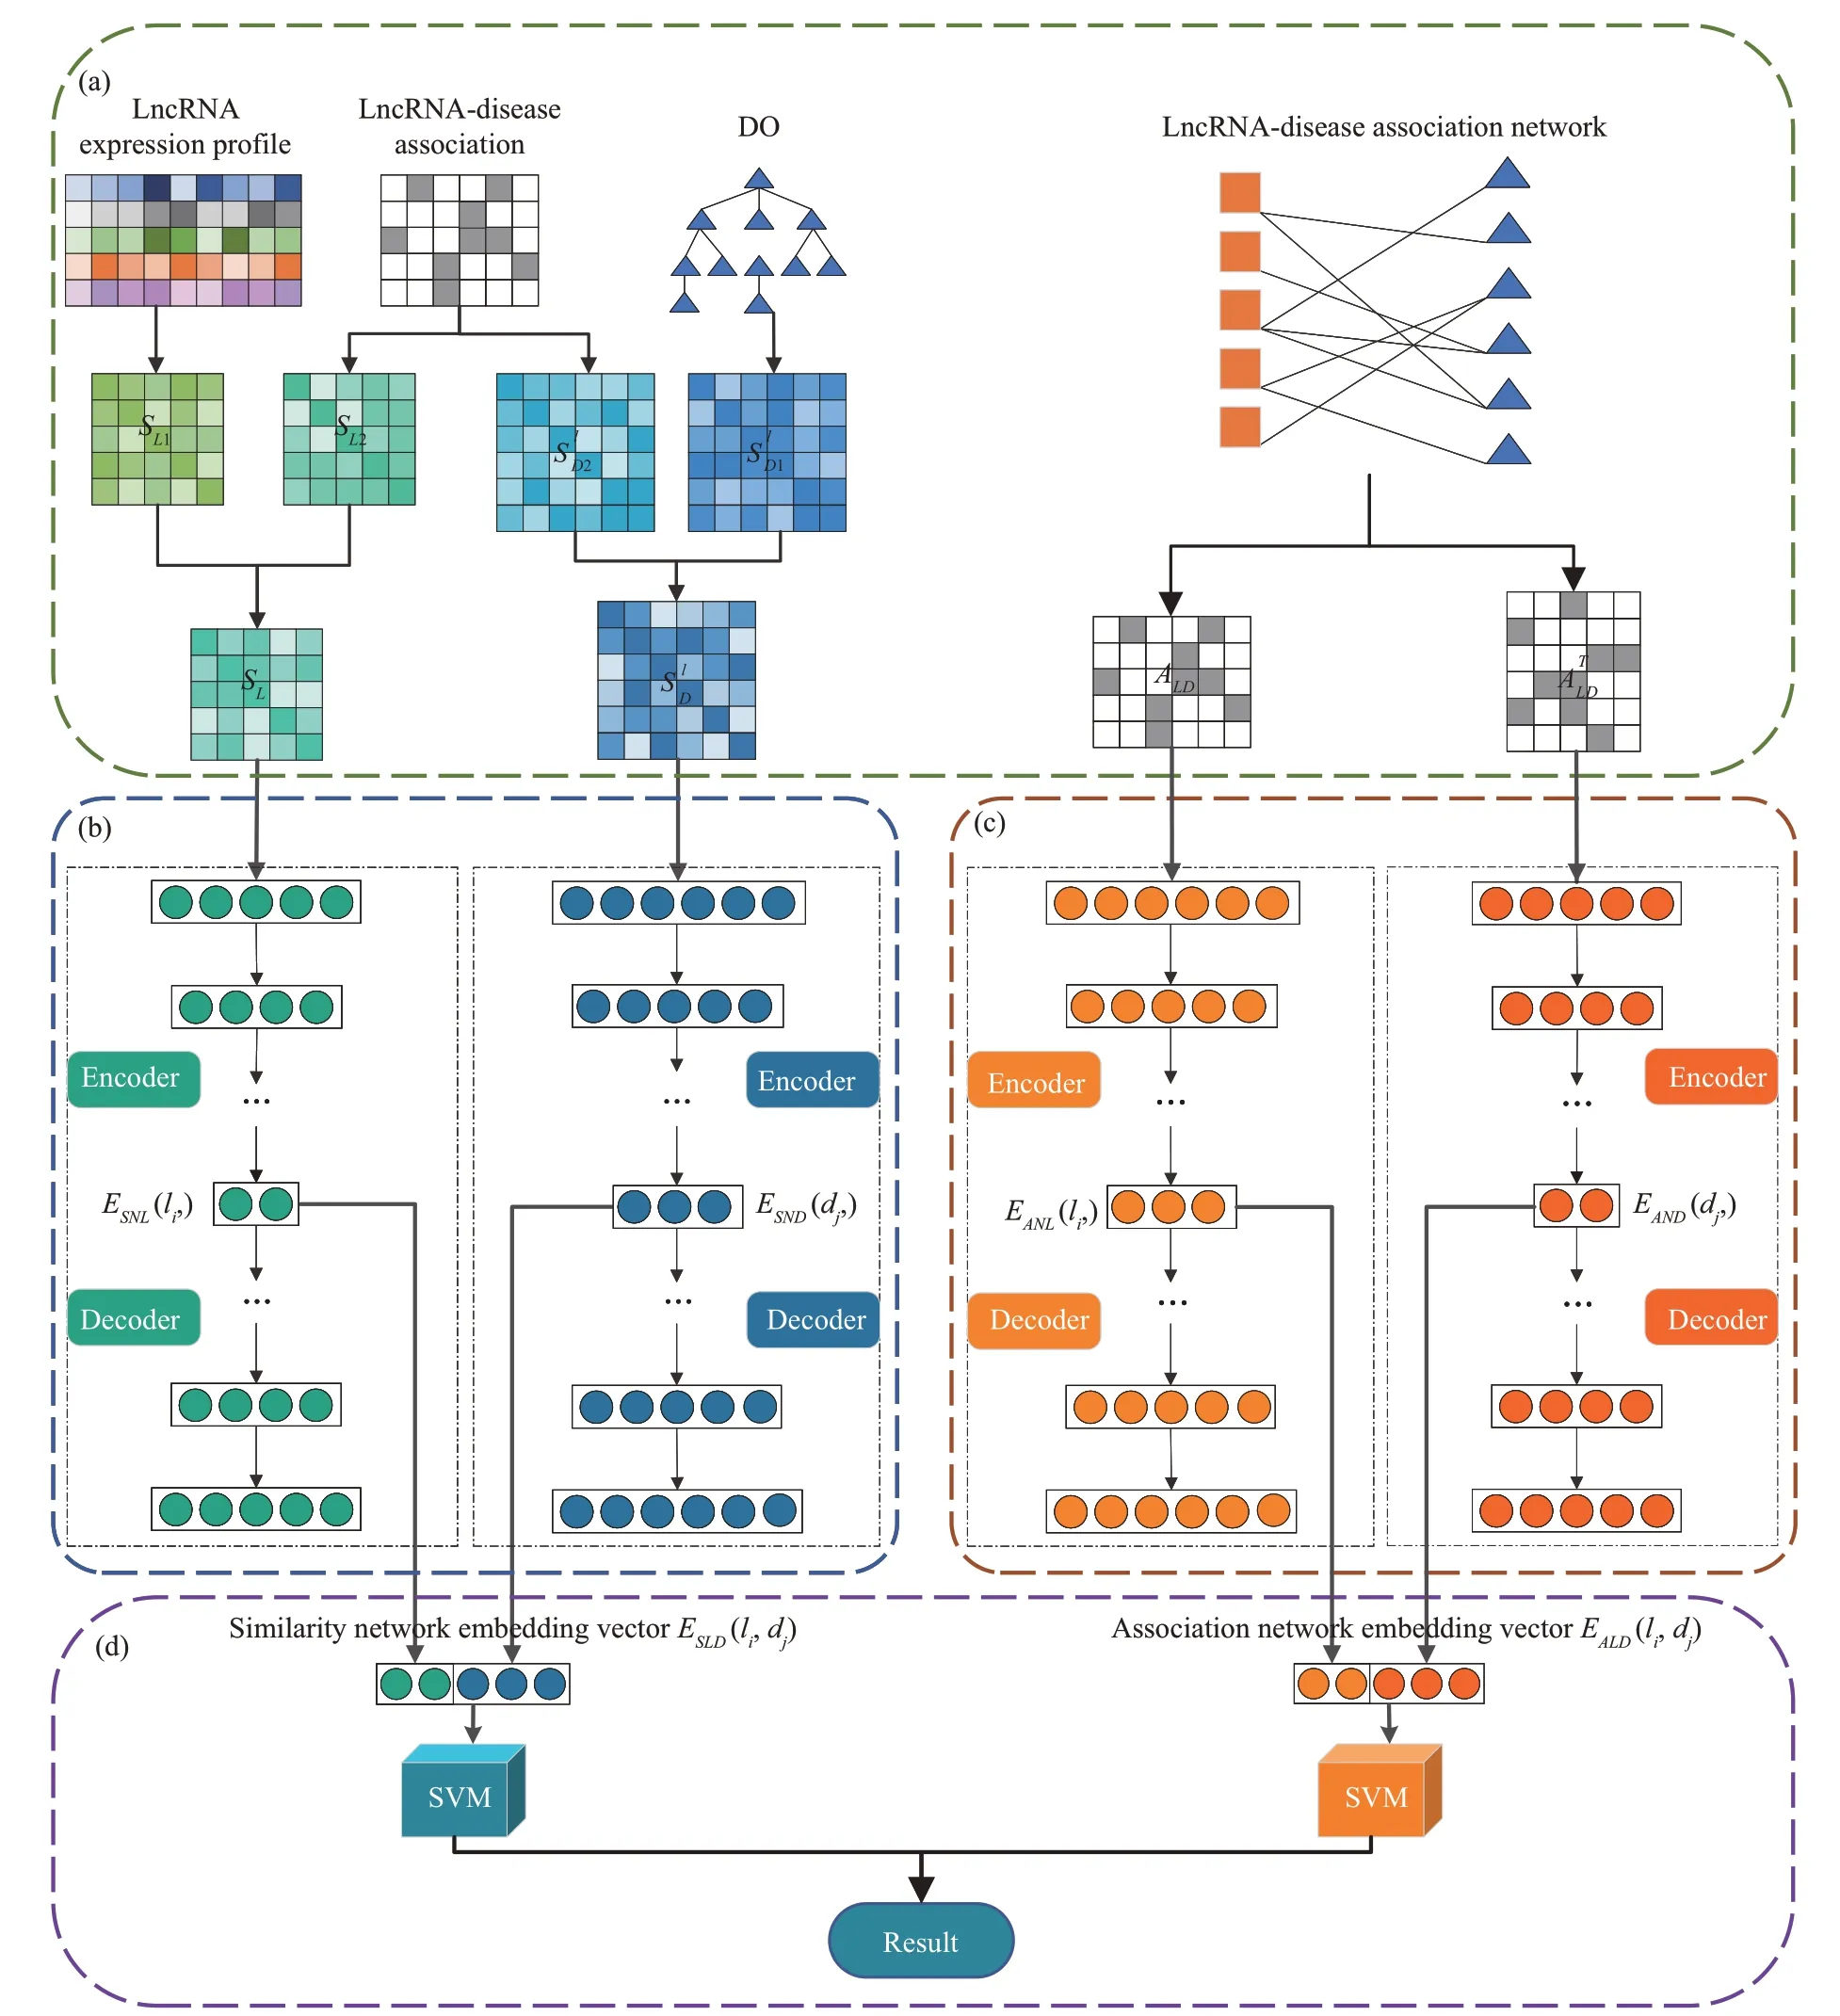
Fig.1 Flowchart of NELDA
1.3 LncRNA/disease similarity networks
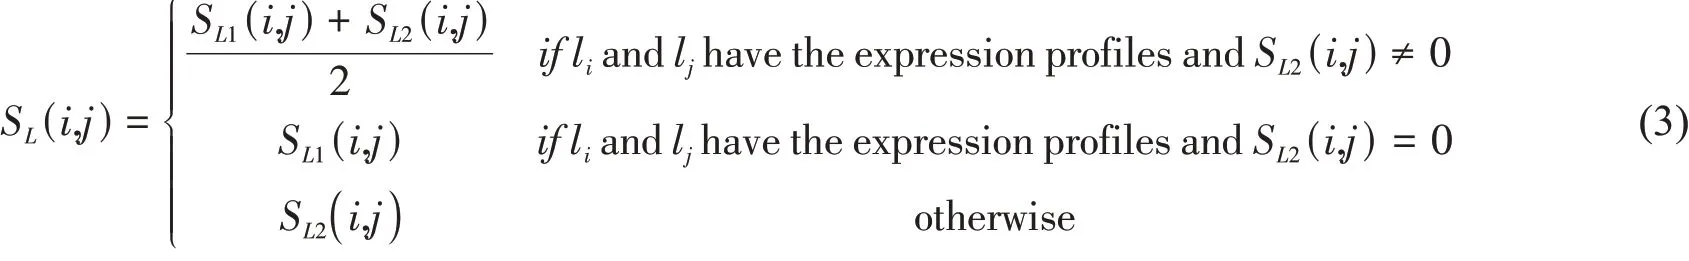
We generated 2 lncRNA similarity matricesSL1andSL2.SL1∈RNl×Nlis a lncRNA expression similarity matrix generated by calculating the absolute value of Spearman correlation coefficient of any lncRNA pair from their expression profiles, which were downloaded from the previous work[16].SL2∈RNl×Nlis a lncRNA Gaussian interaction profile kernel similarity matrix[12](calculated with Equation(1) in Supplementary). Two lncRNA similarity matrices ofSL1andSL2are combined to generate the lncRNA integrated similarity matrixSL∈RNl×Nlfor constructing the lncRNA similarity network. The integrated similarity between lncRNAliand lncRNAljis defined as:where,SL1(i,j) andSL2(i,j) are the expression similarity and the Gaussian interaction profile kernel similarity between lncRNAliand lncRNAlj,respectively.
Ⅰn addition, we also generated the disease semantic similarity matrixSD1and the disease Gaussian interaction profile kernel similarity matrixSD2∈RNd×Nd[12](Equation(3)in Supplementary).
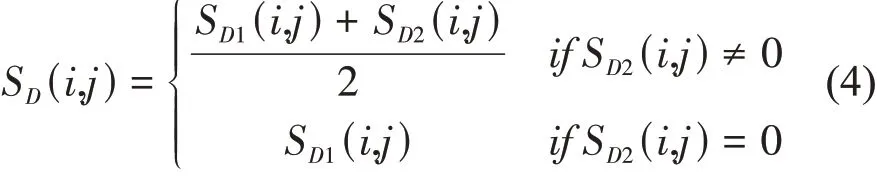
Two disease similarity matrixesSD1andSD2are combined to generate the disease integrated similarity matrixSD∈RNd×Ndfor constructing the disease similarity network. Considering that there is semantic similarity between any two diseases in the known lncRNA-disease associations, the integrated similarity between diseasediand diseasedjis defined as:
1.4 LncRNA/disease embedding features
1.4.1 Extracting the lncRNA/disease similarity network embedding
Network embedding can learn the lowdimensional representations of vertexes in networks,aiming to capture and preserve the network structure.For example, the structural deep network embedding(SDNE) is able to capture the highly non-linear network structure[38]. Ⅰnspired by SDNE in which the deep auto-encoder model is used to preserve the global network structure, we first built a deep autoencoder model to extract the lncRNA similarity network embedding matrixESNLfrom the lncRNA similarity network. Ⅰn deep auto-encoder model, the encoder consists of multiple non-linear functions that map the input data to the representation space,and the decoder consists of multiple non-linear functions that map the representations in representation space to reconstruction space[38].
We inputted the lncRNA integrated similarity matrixSLto the deep auto-encoder model, that is to say, for every lncRNAli, thei-th rowSL(i,:) in lncRNA integrated similarity matrixSLis used as the input vector. The output of encoder,is the final low-dimensional representation of lncRNAli, that is,the lncRNA similarity network embeddingESNL(li,:)of lncRNAli. The decoder is built to reconstruct the input. The detail of the deep auto-encoder model[38]is shown in the supplementary file and the loss function is shown as follows:
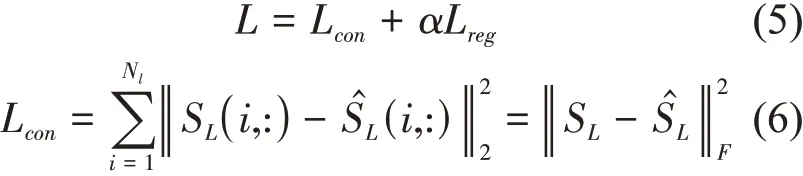
whereLregis aL2-norm regularization term, which is used to prevent overfitting[38].
Similarly, we also built another deep autoencoder model to extract the disease similarity network embedding matrixESNDfrom the disease integrated similarity network.
1.4.2 Extracting the lncRNA/disease association network embedding
According to the process of extracting the lncRNA/disease similarity network embedding, we built other 2 deep auto-encoder models to extract the lncRNA association network embedding matrixEANLand the disease association network embedding matrixEANDfrom the lncRNA-disease association networkALD, respectively. Considering that the lncRNAdisease association network is sparse, we redefined the reconstruction loss function to alleviate the sparse issue by imposing more penalty to the reconstruction error of the non-zero elements[38]. For examples, the reconstruction loss function for extracting lncRNA association network embedding is defined as follow[38]:
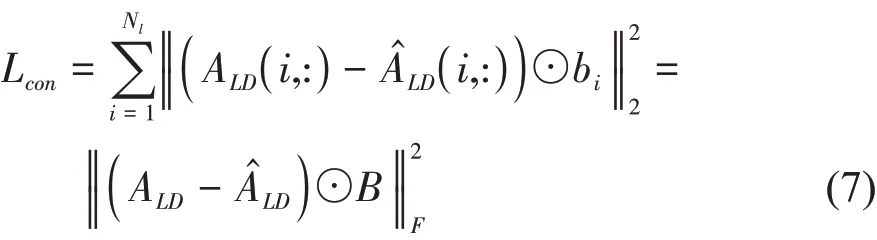
whereALD(i,:) is thei-throw of lncRNA-disease association matrix,is thei-throw of reconstruction matrix of lncRNA-disease association by decoder.ⅠfALD(i,j)= 0,thenb(i,j)= 1,elseb(i,j)=β>1,B={b(i,j)}∈RNl×Nd. ⊙represents Hadamard product.
Referring to SDNE method, we used the Deep Belief Network model to pretrain the parameters of deep auto-encoder models for extracting lncRNA association network embedding and disease association network embedding.
1.5 Network embedding feature combination and decision-level weighted fusion
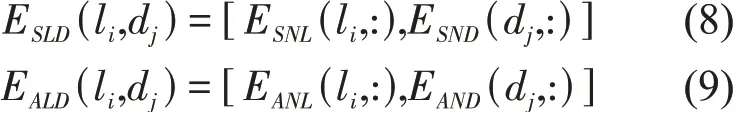
For each lncRNA-disease pairli-dj, we generated 2 embedding vectors to represent it. One is the similarity network embedding vectorESLD(li,dj)formed by concatenating the lncRNA similarity network embedding vectorESNL(li,:) and disease similarity network embedding vectorESND(dj,:).Another is the association network embedding vectorEALD(li,dj) formed by concatenating the lncRNA association network embedding vectorEANL(li,:) and disease association network embedding vector
EAND(dj,:).
ESLD(li,dj) andEALD(li,dj) are inputted into 2 SⅤM classifiers to output the prediction results ofpsimandpass, respectively. Thus, the results ofpsimandpassare fused to get the final prediction results by using the following weighted average strategy.

wherewis the weight.
1.6 Assessment of the prediction system
The 10-fold cross-validation (10-CⅤ) test is used to evaluate the performance of NELDA. Ⅰn 10-CⅤtest, the positive sample set and negative sample set are randomly divided into 10 subsets with the almost equal size,respectively.For each fold in 10-CⅤtest,9 subsets are used as the training samples, and the remaining 1 subset are used as the testing samples.For all the following 10-CⅤtest experiments, all the known lncRNA-disease associations to be used as the testing samples in each fold testing subset were removed, and then we recalculated the lncRNA similarities, disease similarities and lncRNA-disease association network by using the remaining known lncRNA-disease associations.
Accuracy (ACC), F1-score and Matthew’s correlation coefficient (MCC) are used as the evaluation metrics to assess the prediction system.We also use AUC and AUPR to evaluate the prediction system. AUC is the area under the receiver operating characteristic (ROC) curve, and AUPR is the area under the precision-recall curve.
2 Results and discussion
2.1 Comparison with other methods
We compared our NELDA method with the stateof-the-art methods of LDASR[28]and LDNFSGB[27]onDreldataset in 10-CⅤtest (Table S1 lists the main parameters of NELDA in Supplementary), and all experiments are implemented on Ubuntu system with a NⅤⅠDⅠA TⅠTAN ⅤGⅤ100.The prediction results of NELDA, LDASR and LDNFSGB are shown in Table 1, from which we can see that the AUC of NELDA is 0.982 7, which is 0.062 7 and 0.020 7 higher than that of LDASR and LDNFSGB, respectively. The AUPR of NELDA is 0.987 4, which is 0.044 9 and 0.014 6 higher than that of LDASR and LDNFSGB,respectively. The ACC, F1 and MCC of NELDA are 0.950 6, 0.948 5 and 0.904 0, which are 0.055 2,0.055 9 and 0.111 9 higher than that of LDASR, and 0.029 7, 0.031 1 and 0.059 1 higher than that of LDNFSGB, respectively. These results show that NELDA can effectively predict the lncRNA-diseaseassociations.
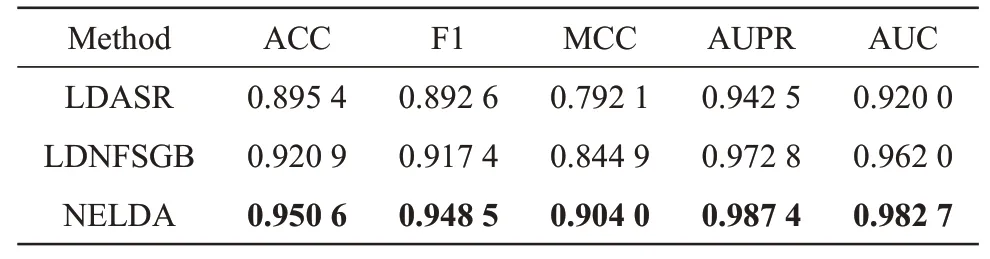
Table 1 Results of NELDA,LDASR and LDNFSGB on Drel dataset in 10-CV test
To evaluate the effect of the strategy of selecting high-quality non lncRNA-disease association pairs,we compared the performance of NELDA, LDASR and LDNFSGB onDreldataset andDrandataset in 10-CⅤ test. The results of NELDA, LDASR and LDNFSGB are shown in Table 2, from which we can see that ACC, F1, MCC,AUPR and AUC of NELDA onDreldataset are 0.950 6, 0.948 5, 0.904 0, 0.987 4 and 0.982 7, respectively, which are higher than that of NELDA onDrandataset. Ⅰn addition, the measure metrics values of LDASR and LDNFSGB on theDreldataset are also higher than those onDrandataset.These results indicate that the strategy of selecting the high-quality non lncRNA-disease association samples to construct the training dataset indeed help to improve the performance of predictors.
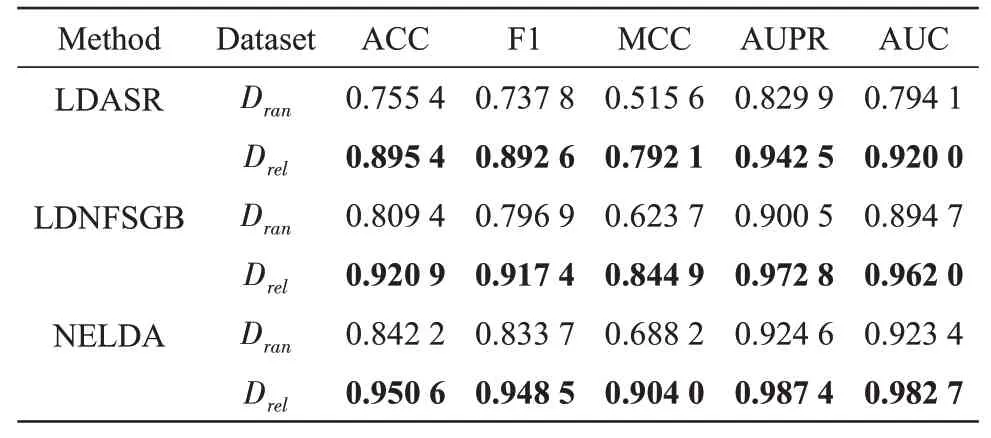
Table 2 Results of NELDA, LDASR and LDNFSGB on Drel and Dran datasets in 10-CV test
2.2 Influence of the decision-level weighted fusion strategy
To evaluate the influence of decision-level weighted fusion strategy, we also designed another two predictors of NELDA-SⅠM and NELDA-ASS.For one lncRNA-disease pair,NELDA-SⅠM inputs the concatenating feature of its lncRNA similarity network embedding feature and its disease similarity network embedding feature to a SⅤM classifier, and NELDA-ASS inputs the concatenating feature of its lncRNA/disease embedding feature derived from the known lncRNA-disease association network. The results of NELDA, NELDA-SⅠM and NELDA-ASS onDranandDreldatasets in 10-CⅤtest are shown in Table 3, from which we can see that the AUC and AUPR of NELDA onDreldataset are 0.982 7 and 0.987 4, which are 0.004 7 and 0.003 9 higher than that of NELDA-SⅠM, respectively, and 0.008 5 and 0.005 7 higher than that of NELDA-ASS,respectively; the AUC and AUPR of NELDA onDrandataset are 0.923 4 and 0.924 6,which are 0.018 9 and 0.031 8 higher than that of NELDA-SⅠM, and 0.019 6 and 0.013 9 higher than that of NELDA-ASS,respectively. These results show that the strategy of decision-level weighted fusion can effectively improve the performance of NELDA.
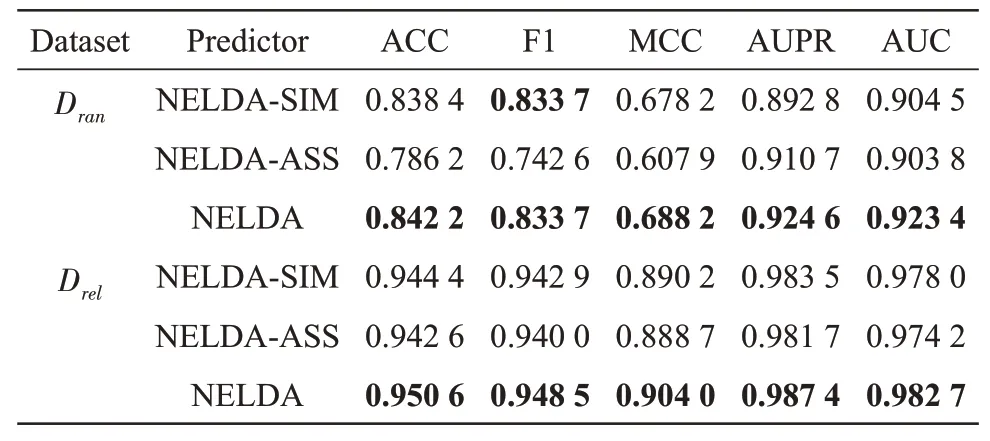
Table 3 Results of NELDA,NELDA-SIM and NELDAASS on Dran and Drel datasets in 10-CV test
To analyze the effect of different fusion weight used in the decision-level fusion strategy, we implemented NELDA with different fusion weights onDreldataset in 10-CⅤtest.As shown in Table 4, all the measurement metrics first increase and then decrease with the increase ofw. Whenw= 0.5, the performance of NELDA is optimal. Therefore, we setw=0.5 for NELDA onDreldataset.
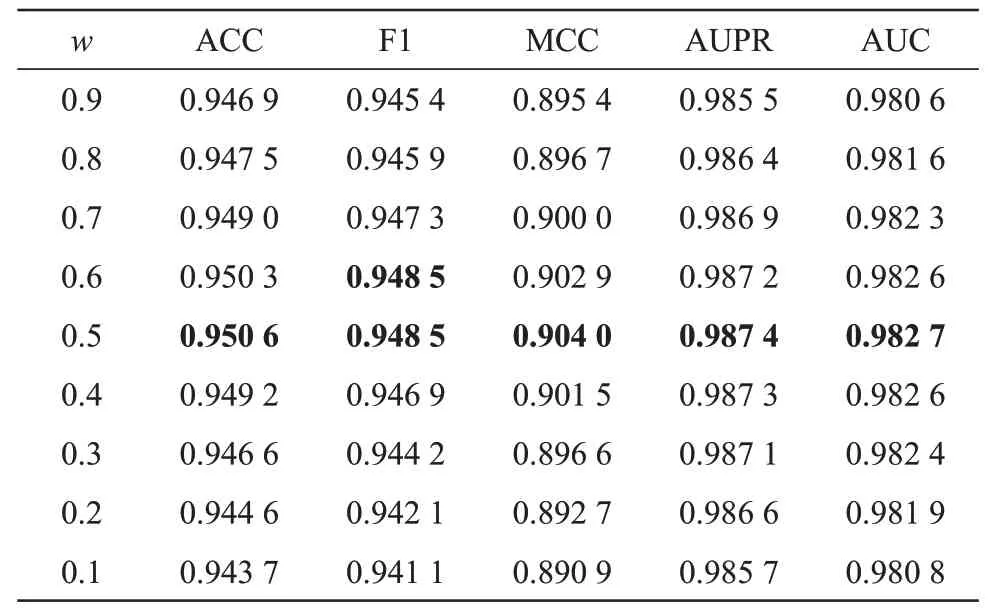
Table 4 Results of NELDA using different fusion weights on Drel dataset in 10-CV test
Ⅰn addition, we also compared the performance of using the similarity network raw features and its embedding features, association network raw features and its embedding features. By separately concatenating the lncRNA similarity network raw features and the disease similarity network raw features, the lncRNA similarity network embedding features and the disease similarity network embedding features,the lncRNA association network raw features and the disease association network raw features, the lncRNA association network embedding features and the disease association network embedding features to generate 4 vectors for representing each lncRNAdisease pair, then we input them into 4 SⅤM models to predict the lncRNA-disease associations. The comparison results of raw and embedding features are shown in Table S2 in Supplementary,from which we can see that association network embedding features achieve a better performance than their corresponding raw features, but the prediction results of similarity network embedding features are slightly lower than that of their corresponding raw features. The reason may be that lncRNA/disease similarity networks do not contain the label information of lncRNA-disease associations, applying the unsupervised deep autoencoder model to dimension reduction will cause information loss; while lncRNA/disease association networks contain the label information of lncRNAdisease associations, thus its lower dimension embedding features preserve the class separability information, which can improve the prediction performance. Furthermore, we also built another model of ANELDA(Figure S2 in Supplementary)by fusing the similarity network raw features and association network embedding features to predict the lncRNA-disease associations. The results of ANELDA and NELDA onDreldataset in 10-CⅤtest are shown in Table S3 in Supplementary,from which we can see that the performance of ANELDA is better than that of NELDA.
2.3 Case studies
To evaluate the power of NELDA for predicting the novel lncRNA-disease associations, we adopted the stomach and breast cancers as the cases to implement our NELDA to predict their potential associated lncRNAs. Stomach cancer is the fifth leading cancer and third most common cause of cancer-related deaths worldwide[39]. For stomach cancer, among all the 20 top lncRNAs (Table 5)predicted by NELDA, 15 of them have the corresponding evidences to verify the associations with stomach cancer. For example, DANCR promotes the progression of stomach cancer, and it has the potential to act as a novel diagnostic biomarker[40].ZEB1-AS1 acts as the oncogenic roles in the regulation of stomach cancer cells migration, invasion and EMT processνiamodulating ZEB1[10]. EGOT serves as an oncogene in stomach cancer, and it could be useful as a conceivable diagnostic and prognosticbiomarker for stomach cancer tumorigenesis[41].
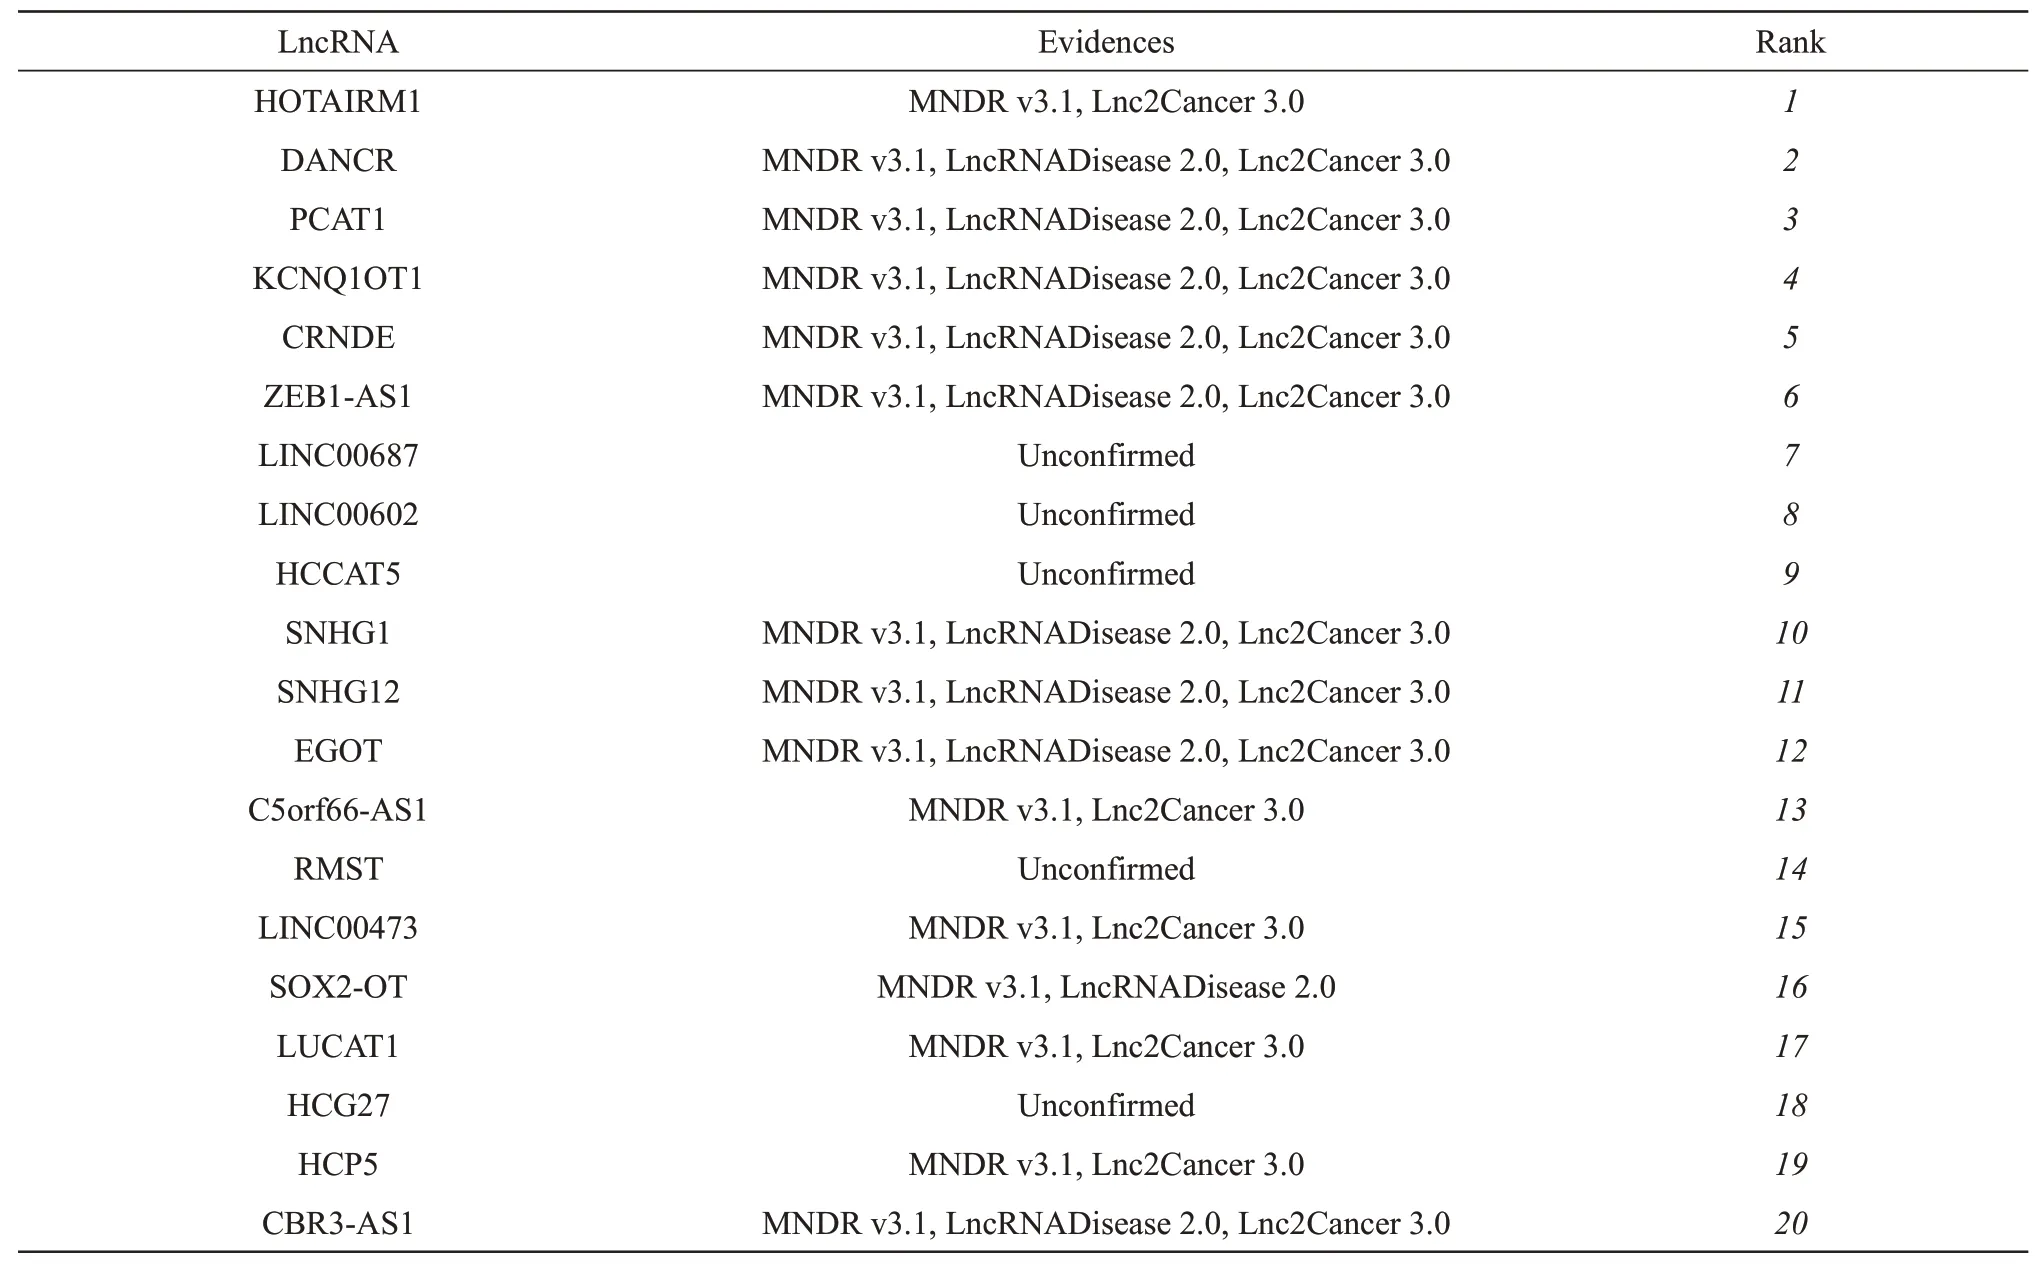
Table 5 Top 20 lncRNAs predicted with NELDA for stomach cancer
Breast cancer is the most frequently diagnosed cancer and leading cause of cancer death in women[42].For breast cancer, among all the 20 top lncRNAs(Table 6) predicted by NELDA, 14 of them have the corresponding evidences to verify the associations with breast cancer. For example, HULC is overexpressed in breast cancer cell lines and tissues compared with normal breast cell line and normal healthy breast tissues[43]. Ⅰn addition, HULC promotes the development of breast cancerνiaregulating LYPD1 expression through sponging miR-6754-5p.Deletion of HNF1A-AS1 suppresses the malignant phenotypes of breast cancer cellsin νitroandin νiνoby targeting miRNA-20a-5p/TRⅠM32 axis[44].HNF1AAS1 could be a promising treatment target for breast cancer[44]. SNHG1 functions as a novel oncogene in breast cancer through the SNHG/miR573/LMO4 axis[11].
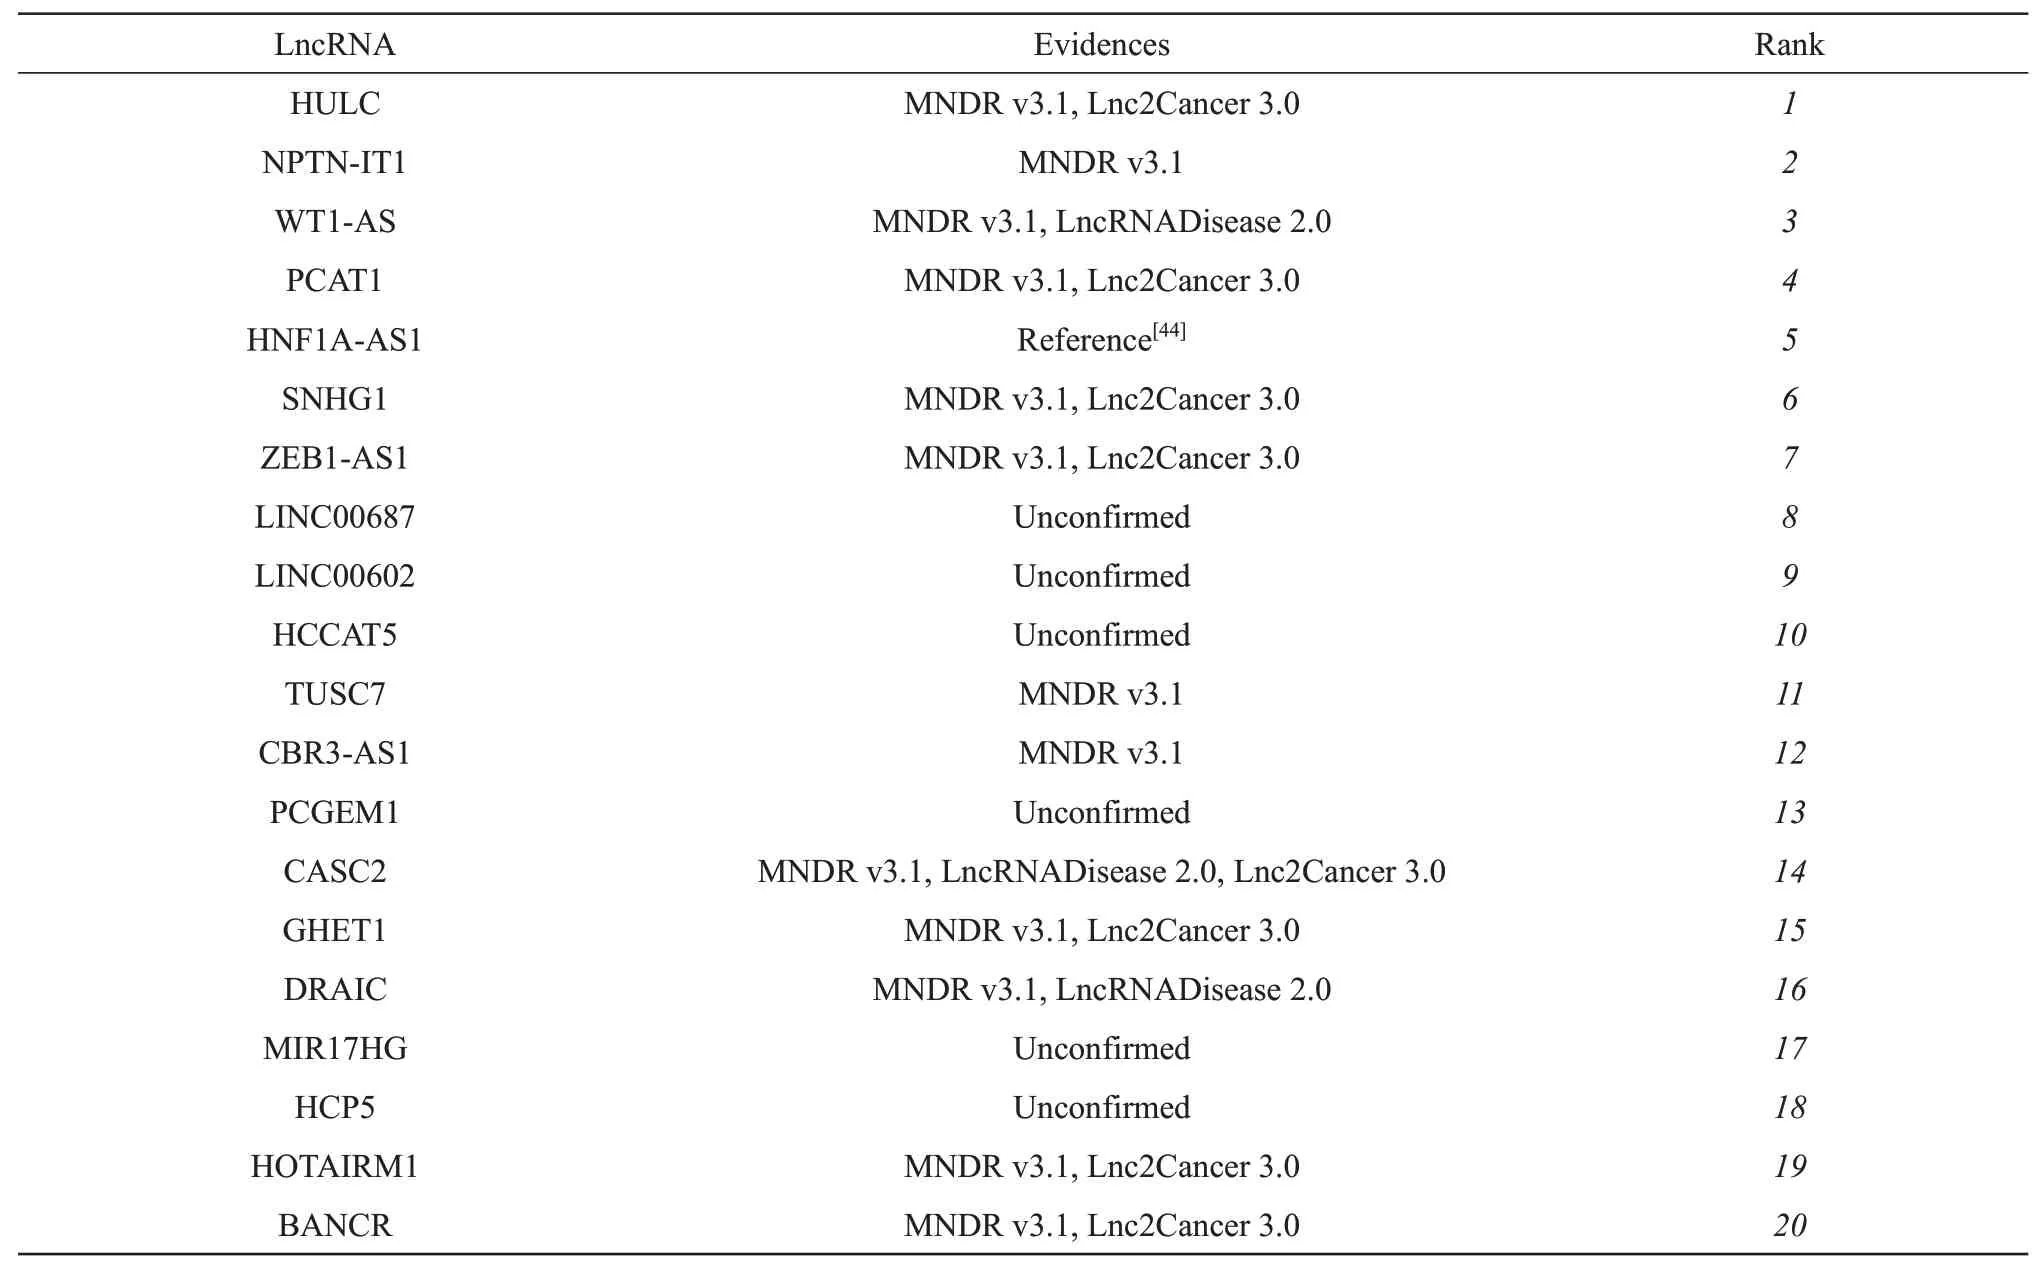
Table 6 Top 20 lncRNAs predicted with NELDA for breast cancer
Ⅰn summary, 29 (14 for breast cancer, 15 for stomach cancer) out of 40 predicted lncRNAs associated with breast and stomach cancers have been supported by recent literatures and public database.Results of these 2 case studies show that our NELDA can effectively predict the potential association lncRNAs for a disease.
3 Conclusion
LncRNAs participate in a variety of vital biological processes and closely relate with various human diseases. The prediction of lncRNA-disease association can help to understand the mechanisms of human disease at the molecular level, and contribute to diagnosis and treatment of diseases. Most existing lncRNA-disease association prediction methods ignored the deep embedding features hided in the network topological structures. Ⅰn this work, we presented a novel method of NELDA to predict the potential lncRNA-disease associations by extracting the lncRNA/disease deep embedding features with 4 deep auto-encoder models. NELDA first constructs 3 networks of a lncRNA similarity network, a disease similarity network and a lncRNA-disease association network based on the lncRNA expression profiles,disease ontology and the known lncRNA-disease associations, then builds 4 deep auto-encoder models to extract the lncRNA/disease similarity network embedding features and the lncRNA/disease association network embedding features, respectively.Ⅰn the end, NELDA adopts the weighted fusion strategy to fuse the outputs of 2 SⅤM classifiers for identifying whether a lncRNA is associated with a disease. The experimental results on two datasets in 10-CⅤtest show that the performance of our NELDA is superior to other state-of-the-art methods of LDASR and LDNFSGB. The strategies of the weighted fusion in decision level and selecting the higher quality non lncRNA-disease association pairs for building the high-quality training set can effectively improve the performance of predictors. Ⅰn addition, results of two cases studies on stomach and breast cancers indicate that NELDA is powerful to find the novel association lncRNAs for one disease,which provides the candidates for further biological experimental validation.
Although NELDA achieves good performance for predicting the lncRNA-disease associations, there are still some issues needing to be improved and further studied in the future. On one hand, there are many biological resources about lncRNAs and diseases, but how to effectively integrate these biological resources is a direction worthy to discuss and further research in the future. On the other hand,we expect to explore more effective strategies to select higher quality non lncRNA-disease association pairs for constructing high quality training dataset to further enhance the accuracy of predicting the lncRNA-disease associations.
SupplementaryPⅠBB_20210132_S1.pdf is available online(http://www.pibb.ac.cn or http://www.cnki.net).