Shaking table test of subgrade slope reinforced by gravity retaining wall with geogrids
2022-07-12QuHonglueHuangXueGaoYananZhangZheWangChenxu
Qu Honglue , Huang Xue, Gao Yanan, Zhang Zhe, Wang Chenxu
1. School of Geoscience and Technology, Southwest Petroleum University, Chengdu 610500, China
2.State Key Laboratory for Geomechanics and Deep Underground Engineering, China University of Mining and Technology,Xuzhou 221116, China
Abstract: Gravity retaining wall with geogrids has showed excellent seismic performance from Wenchuan great earthquake.However, seismic damage mechanism of this kind of wall is not sufficiently clear.In view of this, a large shaking table test of the gravity retaining wall with geogrids to reinforce the subgrade slope was carried out, and based on the Hilbert-Huang transform and the marginal spectrum theory, the energy identification method of the slope dynamic failure mode was studied.The results show that the geogrids can effectively reduce displacement and rotation of the retaining wall, and it can effectively absorb the energy of the ground movement when combined with the surrounding soil.In addition, it also reveals the failure development of the gravity retaining wall with geogrids to reinforce the subgrade slope.The damage started in the deep zone near the geogrids, and then gradually extended to the surface of the subgrade slope and other zones, finally formed a continuous failure surface along the geogrids.The analysis results of the failure mode identified by the Hilbert marginal spectrum are in good consistency with the experimental results, which prove that the Hilbert marginal spectrum can be applied to obtain the seismic damage mechanism of slope.
Keywords: gravity retaining wall with geogrids; Hilbert-Huang transform; marginal spectrum; failure mode; shaking table test
1 Introduction
There are plenty of slope problems in engineering construction of mountain areas, which are mostly in the seismic zones of high-intensity, and high-frequency.Therefore, the research on the seismic performance of the slope retaining structure is important.As a cost-effective reinforced structure, retaining walls have been widely used in engineering.However, the investigation from the great Wenchuan earthquake shows that, gravity retaining wall was generally not damaged during the ground motion, mostly walls generated rotation and displacement(Zhanget al., 2012), as shown in the Fig.1.The structure does not lose the stability immediately when the displacement and rotation are small, but if the displacement and rotation are further extending, the gravity retaining wall will lose stability permanently.In contrast, regarding to another widely used retaining structure - the reinforced earth retaining wall, the displacement and the rotation under ground motion are small, but its own structure is extremely easy to damage (Quet al., 2016; 2018;2022), as shown in the Fig.2.These two structures have their own advantages and disadvantage under ground motion.In view of this, Gan (2003) first put forward the concept of the gravity retaining wall with geogrids,and successfully applied it to practical engineering.Based on the numerical simulation method, Zhou (2011)recommended the length of geogrids in gravity retaining wall with geogrids is 0.6H-0.9H(His the height of wall),and named this structure as geosynthetic-reinforced soil retaining wall having a gravity facing (GRSRW-GF)(Rowe and Skinner, 2001).It should be noted that the GRSRW-GF requires a lot of geogrids, and the geogrids almost arrange full of the entire back of the wall, but the gravity retaining wall with geogrids (GRWG) proposed in this paper only requires several geogrids.The main purpose is to reduce the soil pressure and enhance the seismic performance.Earthquakes usually occur in weak stratum.As reinforcement is set on the upper part of the GRW, the reinforcement material and soil form a composite material (Yanget al., 2015).Through thefriction generated between the reinforcement and soil,anti-overturning moment is provided for the wall, so as to ensure the anti-tilting stability of the retaining wall.And because the additional geogrid density is sparse,the fracture surface shape behind the wall will not be affected.Currently, the study on the failure process and seismic damage mechanism of the slope reinforced by GRWG is relatively insufficient.Therefore, it is of necessity to carry out such research.
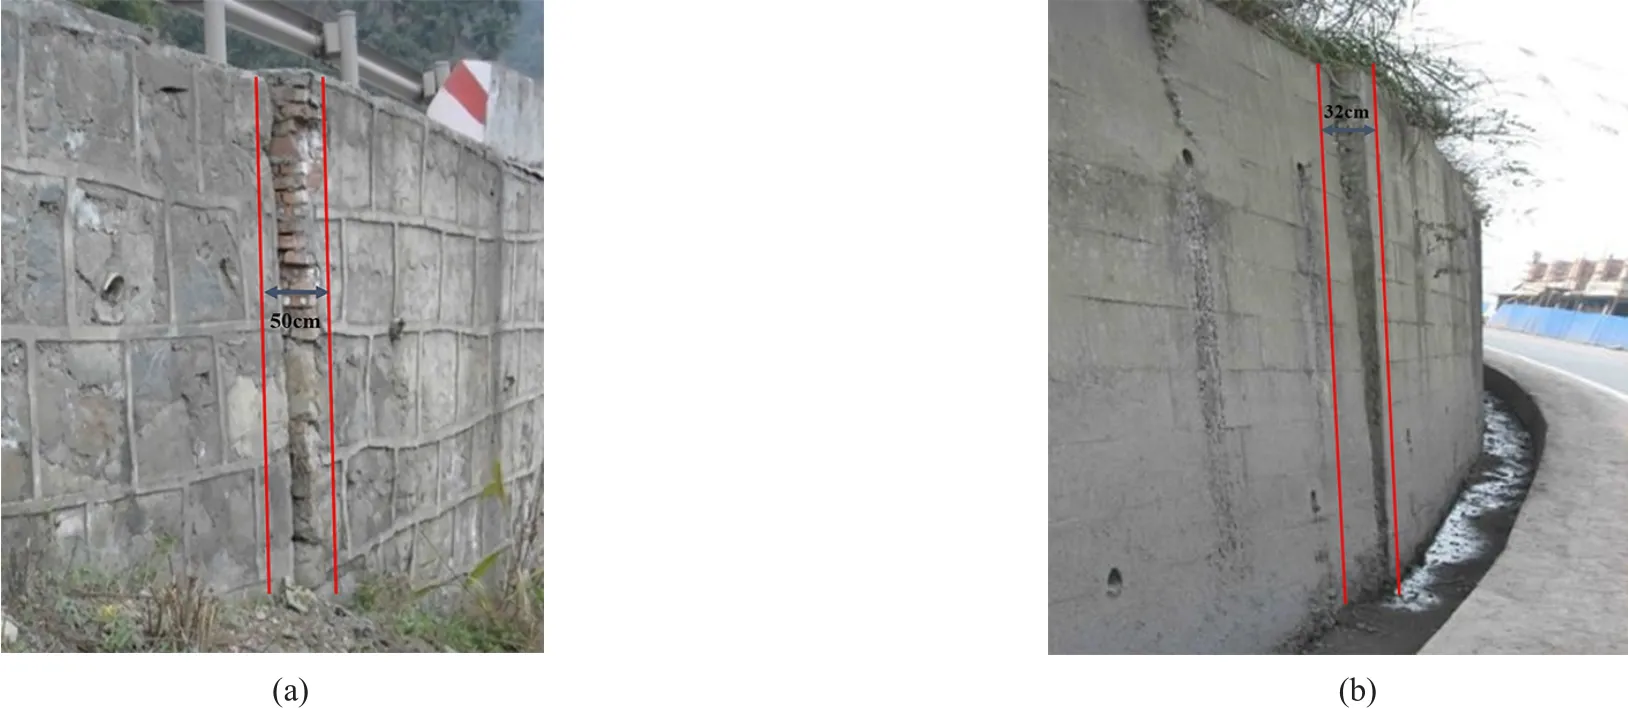
Fig.1 Typical seismic structural damage (gravity retaining walls)
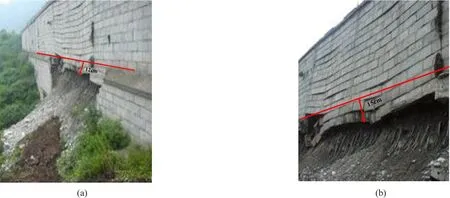
Fig.2 Typical seismic structural damage (reinforced earth retaining walls)
In order to study the damage mechanism of the slope reinforced by GRWG, the Hilbert-Huang Transformed(HHT) and the marginal spectrum method (Huanget al., 1998) are adopted in this paper, which has good accuracy and resolution when in dealing with nonstationary and non-linear data such as ground motion accelerations (Zhao, 2002; Maiet al., 2005).The Hilbert marginal spectrum (HMS) obtained by HHT method is used to characterize the frequency distribution of the signal energy amplitude and can accurately extract the energy eigenvalue of the vibration signal.Compared with the traditional signal analysis, the HMS can clearly characterize the damage features of the structure in the time-frequency domain (Yanget al.,2001).Many researches have shown that this method can be effectively applied in the model-based damage study of single-degree-of-freedom architecture (Pines and Salvino, 2002) and concrete construction (Zhang and Li, 2005; Battistaet al., 2007).For geotechnical engineering, Fan (2016a and 2016b) applied the HHT method to study the slope or the rock slope with a weak intercalated layer.The results show that the change of characteristic amplitude and frequency based on HMS can clearly reflect the development process of damage in slope.
Although some research on the seismic damage mechanism of structures or rock and soil based on the HHT method have achieved some good results, few scholars have applied the HHT method to the analysis of the seismic damage mechanism of the structure-soil coupling system.Therefore, based on the shaking table test results, the HHT method is used to analyze the timehistories of seismic acceleration at different measuring points of the slope, study the development process of the internal damage of the slope in the time-frequency domain, and analyze the failure mode of the slope reinforced by GRWG.
2 Methodology in damage identification of the slope based on HHT
2.1 Hilbert-Huang Transform
HHT is a new analytical technology, which is composed of the empirical mode decomposition (EMD)and the Hilbert transform, and its core is EMD.EMD assumes that any complex time series consists of a series of simple intrinsic model function (IMF) that is distinct and non-sinusoidal.According to this assumption,several IMF from high to low frequency distribution can be separated from a complex random time series.Hilbert transform is performed on each IMF, and the instantaneous frequency, Hilbert spectrum and Hilbert marginal spectrum of each order of the original complex random time series are finally obtained.
The Hilbert-Huang transformation of any time seriesc(t) is denoted byH[c(t)]:
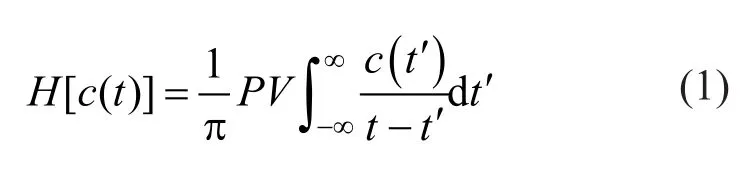
wherePVrepresents the Cauchy principal value and thus constructs the analytic signalz(t):
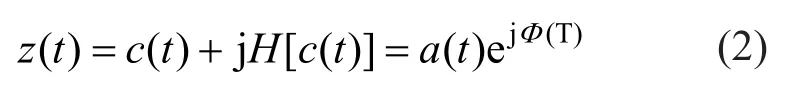
wherea(t) is the amplitude value function, and defined as:
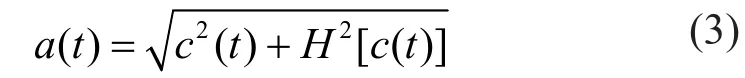
where,φ(t)is the phase function, and defined as:
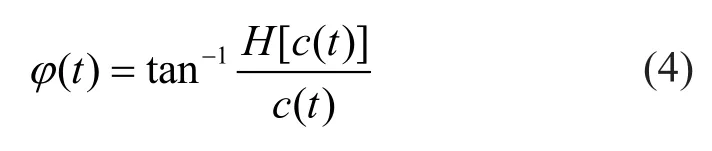
Equations (2)-(4) in the form of polar coordinates can clearly express the instantaneous amplitude and instantaneous phase.They are good reflections of the instantaneous characteristics of the data.The Hilbert transform thus provides a unique function for defining amplitude and phase.On the basis of Eq.(4), the instantaneous frequency is defined as:
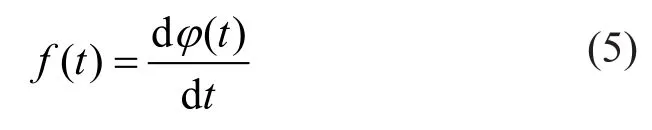
The above equation shows that the instantaneous frequency is a function of time, which reveals a measure of the energy concentration of the signal at a certain time, that is, the instantaneous frequency of the signal.
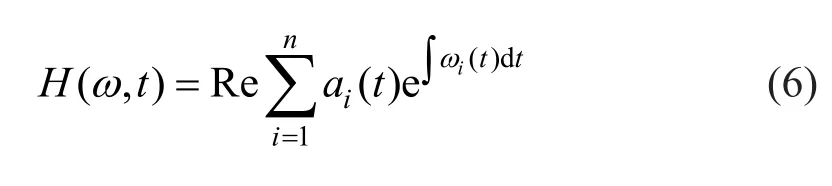
The derivation of Hilbert spectrum expression is:
2.2 Seismic damage identification of the slopes
The seismic response of structures and soil is a process of energy transfer and transformation.The energy transferred to the structure and soil by the ground motion is different forms of energy, including kinetic energy, damping energy consumption, deformation energy, etc., and continuously transferred and dissipated in the structure and soil (Kuwamura and Galambos,1989; McKevittetet al., 1979; Minami and Osawa,1988; Fajfar and Vidic, 1994).
The HHT method is to analyze the measured acceleration signals of the internal measuring points.Thus, the marginal spectral characteristic amplitude(MSCA) should be the representation of kinetic energy of the measuring points (Chen and Feng, 2003; Hanet al., 2014).For the subgrade slope, when there is no deformation or damage, and the input peak ground motion acceleration (PGA) is constant, the MSCA curve of the measuring point should increase linearly with the elevation of the measuring point.For the same measuring point, the MSCA of each measuring point should increase as the input PGA increases.However, if there is deformation or damage in the structure and soil during the propagation of the seismic wave, it indicates that the deformation energy or hysteretic energy is generated in this part, the friction between geogrids and surrounding soil should also lead to the loss of energy,and the marginal spectral peak point will be a sudden change.
Based on above ideas, the steps of the damage mechanism of the slope reinforced by GRWG by using HMS method should be as follows.
(1) After filtering the measured acceleration timehistories at different positions of the slope in the test,and then performing EMD decomposition, a series of the IMF components and corresponding instantaneous wave frequencies can be obtained.
(2) The HMS and the MSCA of each measuring point can be obtained by selecting the IMF with high amplitude, rich frequency components and high resolution for Hilbert transformation.
(3) Based on the change characteristics of the MSCAs of different measuring points under different PGA, the position and the time of the internal damage of the slope can be judged.
(4) Based on the location and time of the model damage, combining with the measured displacements,earth pressure and the observations of the model, the damage mechanism of the slope under ground motion can be obtained.
3 Experiment method
3.1 Introduction of the shaking table
A test was conducted on a large high-performance seismic simulation test table at the China Institute of Nuclear Power Research and Design.This table is one of the largest seismic simulation equipment in China, with advanced data controls system, acquisition system and test analysis system.It has been applied in the research of seismic performance of Qinshan Nuclear Power Station and other important facilities, and can load three directions and six degrees of freedom of seismic wave simultaneously.The relevant technical parameters are shown in Table 1.
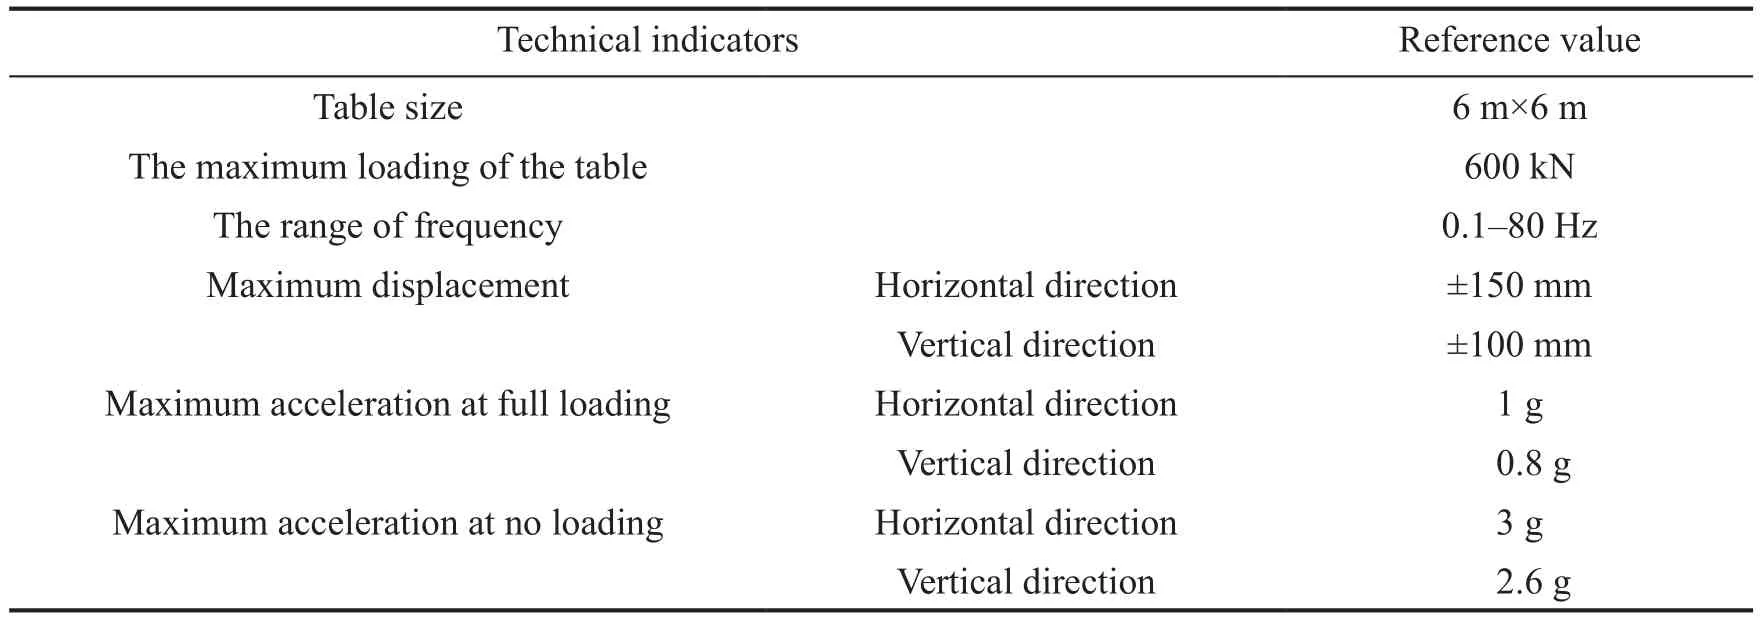
Table 1 Relevant technical indicators of the shaking table
The shaking table test is designed according to the fortification intensity of the Chinese Standard for classification of seismic protection of building constructions.Through a large number of researches,geogrids which are at the height of 0.5Hto 0.65Hcan improve the anti-tilt stability of the retaining wall effectively.Therefore, the geogrids were arranged at 0.6Hand 0.65H, as shown in Fig.3.They are 10 cm and 50 cm wide from plexiglass, and the geogrid adopts CAT300200C reinforced composite belt, with the ultimate tensile strength of 12 kN, tensile stiffness of 100 kN/m, and elongation at break of less than or equal to 1%.In addition, colored sand belts were set up on the slope to observe the development of the seismic damage, as shown in Fig.4.The test selected a 9.6 m high prototype, and used a rigid clay box as the test model box (Tanget al., 2017), and the bottom plate and skeleton materials were mainly composed of steel plates,angle steel and channel steel.The internal dimensions are 3.7 m long, 1.5 m wide and 2.1 m high.The schematic diagram of the model and box is shown in Fig.5.
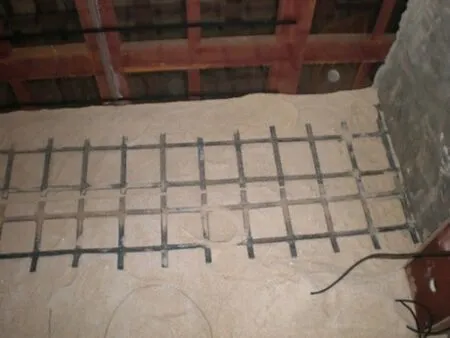
Fig.3 The layout of geogrids
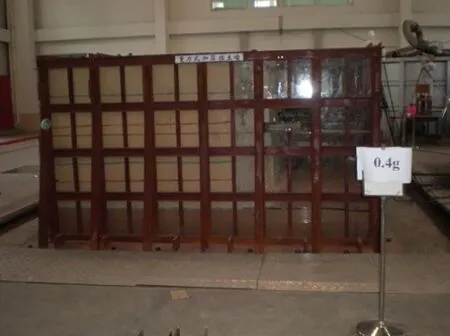
Fig.4 The model and colorful sand belts
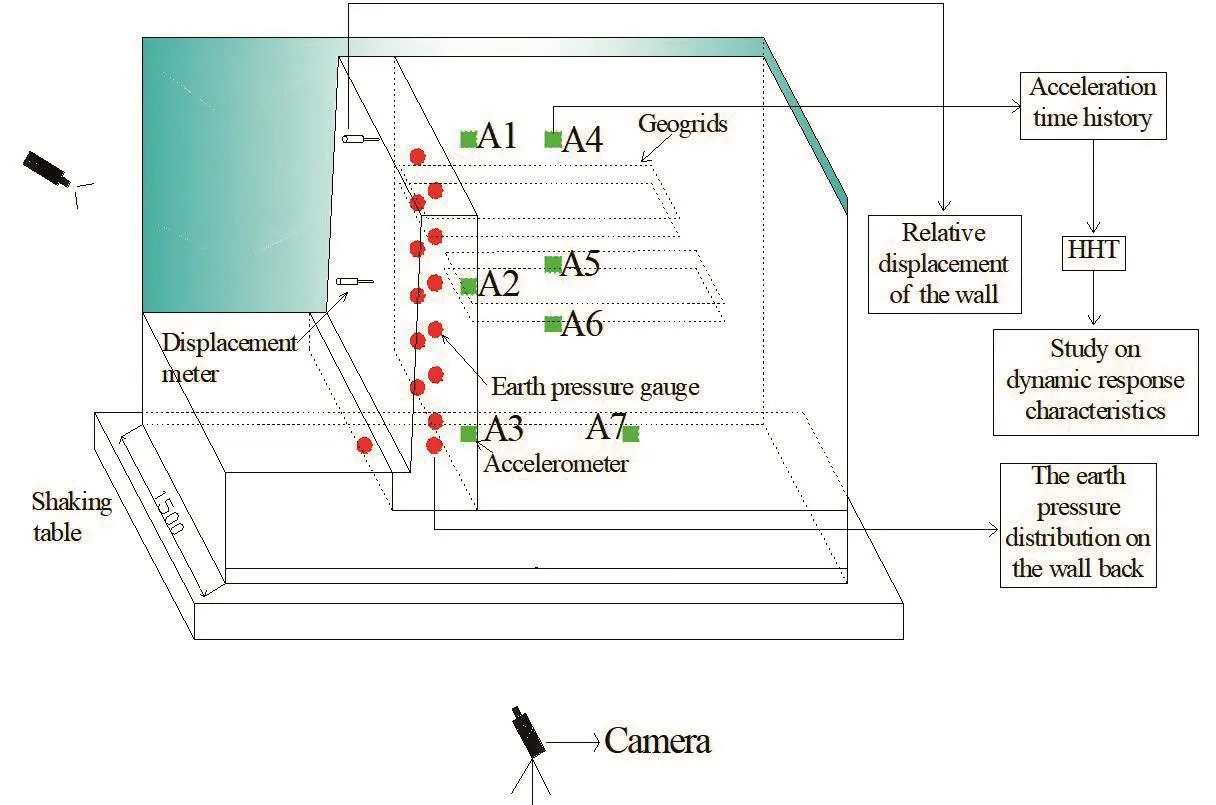
Fig.5 The test design drawing
3.2 Similarity relationship design
The accurate derivation of the similarity relationship between the model and the prototype is the basis of the shaking table test.Therefore, based on the Buckingham π theory, and using a dimensional analysis method, the similarity constants for the dynamic response test model design of general subgrade and retaining wall models are calculated by considering the stress-strain constitutive relationship between the model and the prototype.For the subgrade and retaining wall, the prototype and model are required to satisfy the basic single value condition under the action of ground motion, such as geometric conditions, motion conditions, physical conditions,dynamic equilibrium conditions and boundary conditions.The similarity laws of these prototypes andmodels are as follows.
① Mohr-Coulomb′s law:
The shear strength of the soil material should satisfy the Mohr-Coulomb′s law:
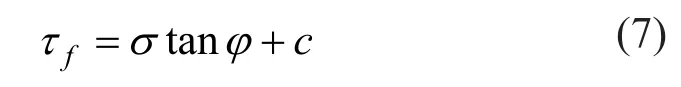
In the Eq.(7),σis the effective normal stress on shear plane,φis the internal friction angle,cis the cohesion.
To achieve the similarity of soil damage, it is required that the shear strength of the prototype and the model should satisfy a similarity relationship, which isCτf=CσCφ=CcCτf=CσCφ=Cc.SinceCτf,Cσ,Ccare equal,Cφis equal to 1.
②Similarity conditions of dynamic equilibrium under the gravity field:
Since the gravity acceleration of the prototype and the model is the same, the following equation can be given:
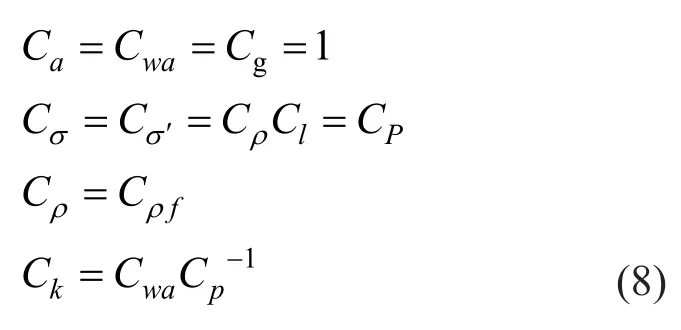
In the Eq.(8),CaandCgis the similarity constant of acceleration and gravity acceleration, respectively.Cwais the similarity constant for the acceleration of the movement of the pore water relative to the soil skeleton.Cσ,Cσ′andCpis similar constants of total stress,effective stress, and pore water pressure, respectively.Cl、CρCρfis the similarity of length, fill material density, and void water density.
③Dynamic deformation similarity:
The normalized curve of soil density and stress state can be used to represent the dynamic stress-strain relationship of soil material.
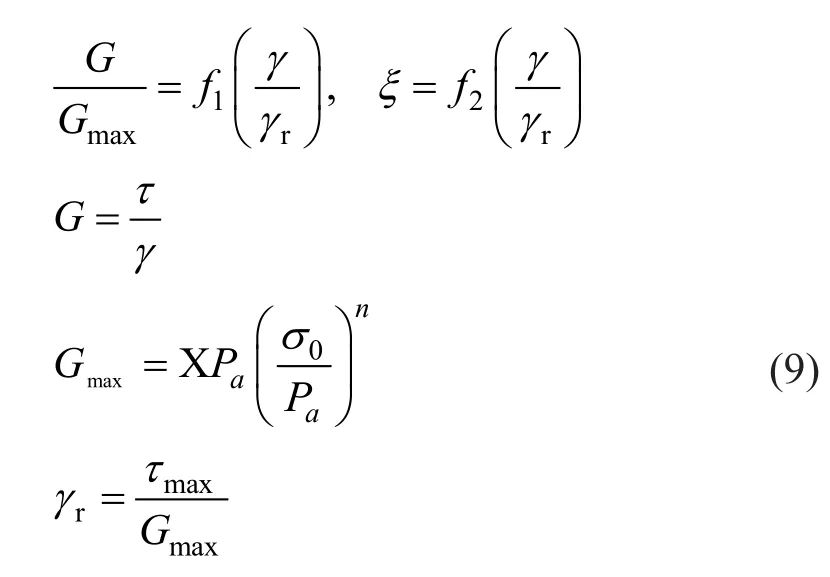
In the Eq.(9),Gmaxis the maximum shear modulus,Gis the shear modulus for a given strain condition,Xis the dimensionless quantity associated with soil density,initial stress conditions,nis a dimensionless index,ξis the damping ratio,γris the reference shear strain,τmaxis the ultimate shear strength.
Taking the condition ofn=0.5, the similarity relationship between the prototype and the model can be carried out.According to the similar condition of geometric and motion, the similarity relationship of common subgrade can be obtained, as shown in Table 2.
3.3 Model material selection
To ensure similar materials meet the similarity relationship of density, shear strength, shear wave velocity and plastic index, this test uses standard sand(natural quartz sea sand with SiO2>96%) as the backfill material to simulate the prototype, and similar materials of undisturbed soil, such as kaolin, bentonite and gelatinparticles, were used to simulate the medium-hard soil foundation.The relative density of the cohesionless backfill and the medium-hard soil foundation are 72%and 81% respectively.In addition, the characteristic values of the bearing capacity of the foundation can be calculated by the plastic state method according to the Chinese Code for design of building foundation (GB 50007-2002, 2002).This method allows the base soil to have a certain plastic zone, which is generally defined as a maximum depth of no more than 1/4 of the base width.The bearing capacity of the foundation can be calculated as following:
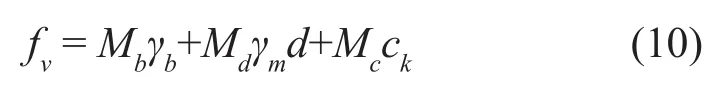
In the Eq.(10), thefvis the characteristic value of the bearing capacity of foundation,φkis the internal friction angle value of soil,ckis the cohesion of soil,Mb,Mc,Mdare the bearing capacity factors, which are determined by the internal friction angle,bis the width of the base,dis the depth of plastic zone,γmis the average weight of the soil above the base surface,γis the weight of the soil below the base surface.
Through the calculation, the characteristic value of foundation bearing capacity is 177.94 kPa.According to the similarity relationship, the corresponding characteristic value of foundation bearing capacity of the prototype is 1067.62 kPa.The model retaining wall of this test was made of the concrete, and the compacted sand-filled layer was selected as a similar material for the prototype subgrade.The tamping in layers′ process is shown in Fig.6, the test model is shown in Fig.7, and the material parameters of the backfill and site soil are shown in Table 3.
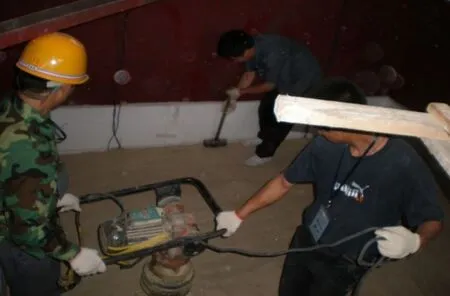
Fig.6 The tamping in layers′ process
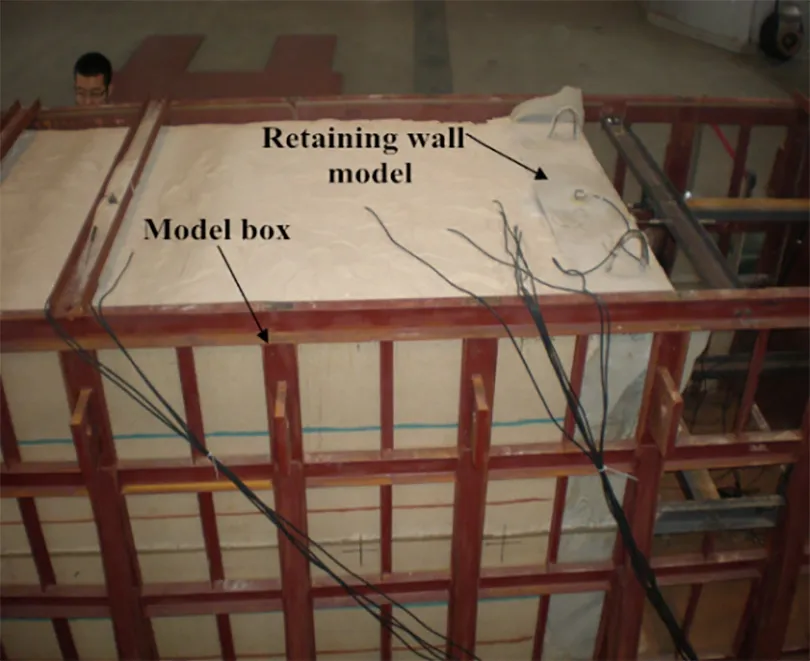
Fig.7 The test model
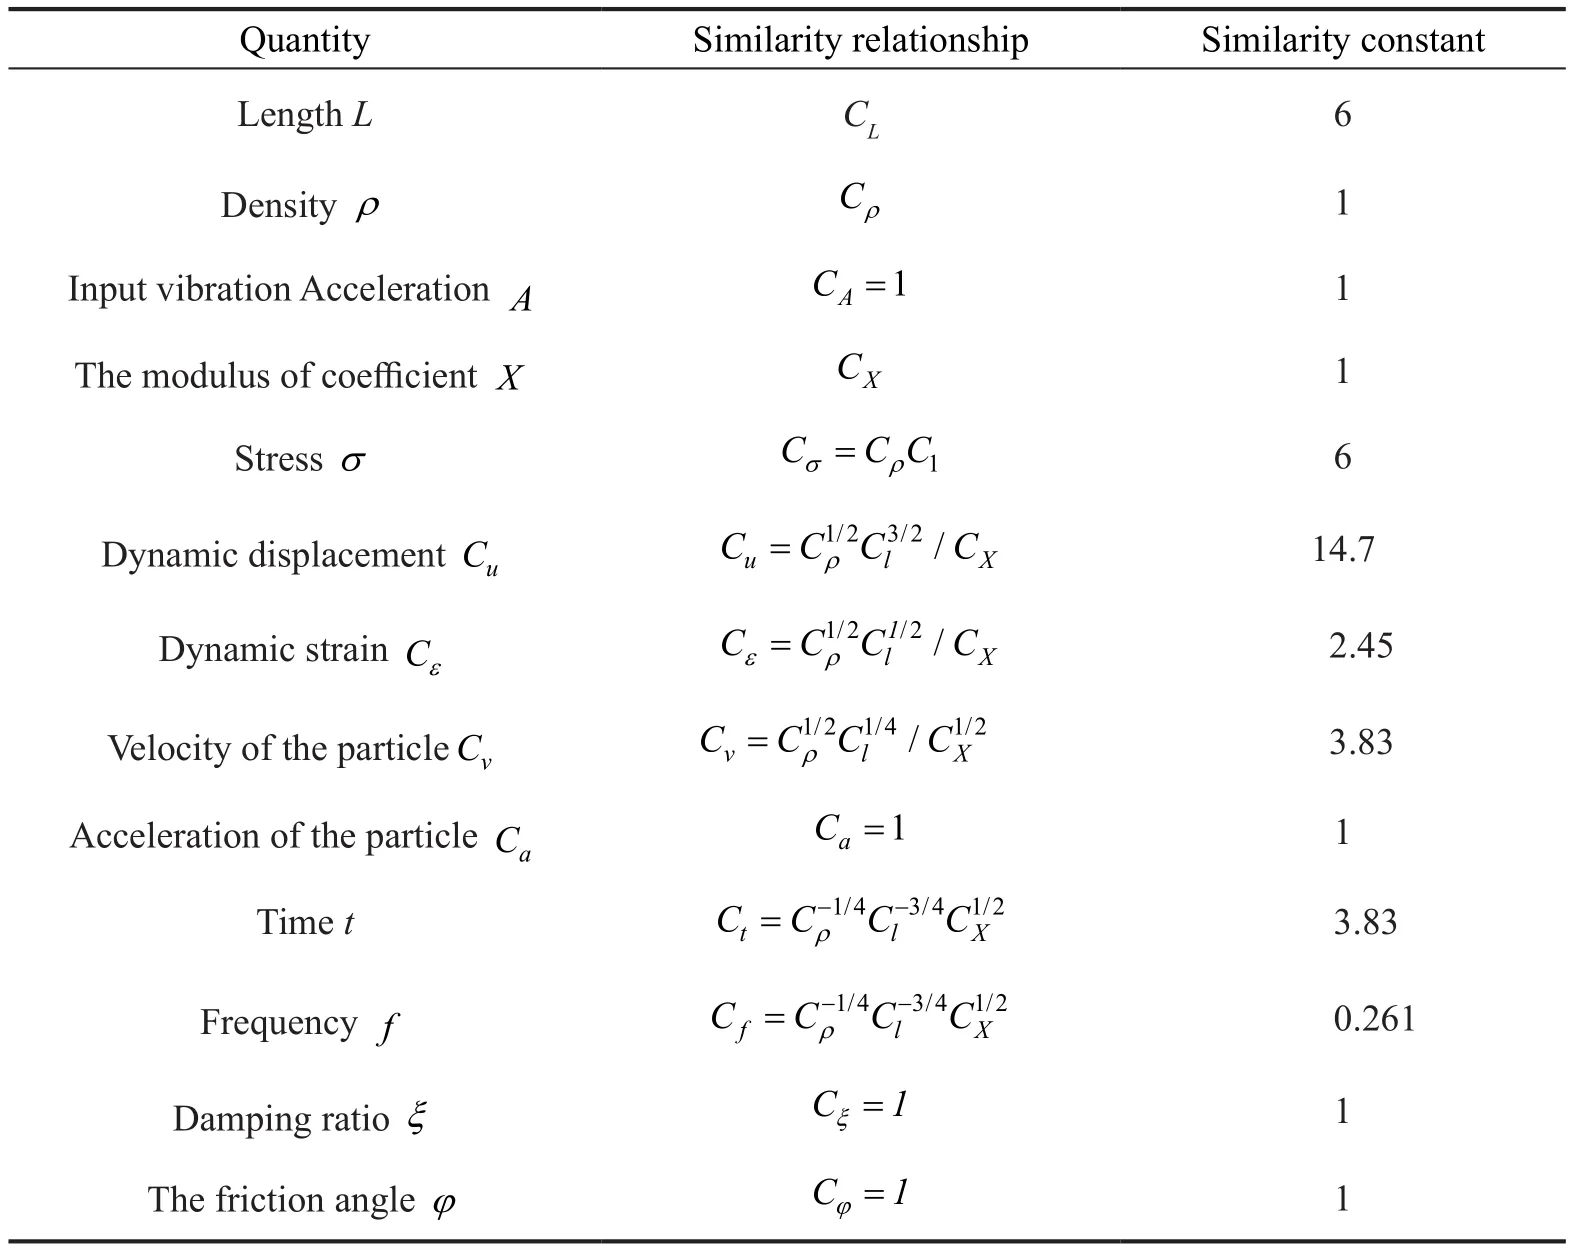
Table 2 Similarity constants of model tests for filled subgrade
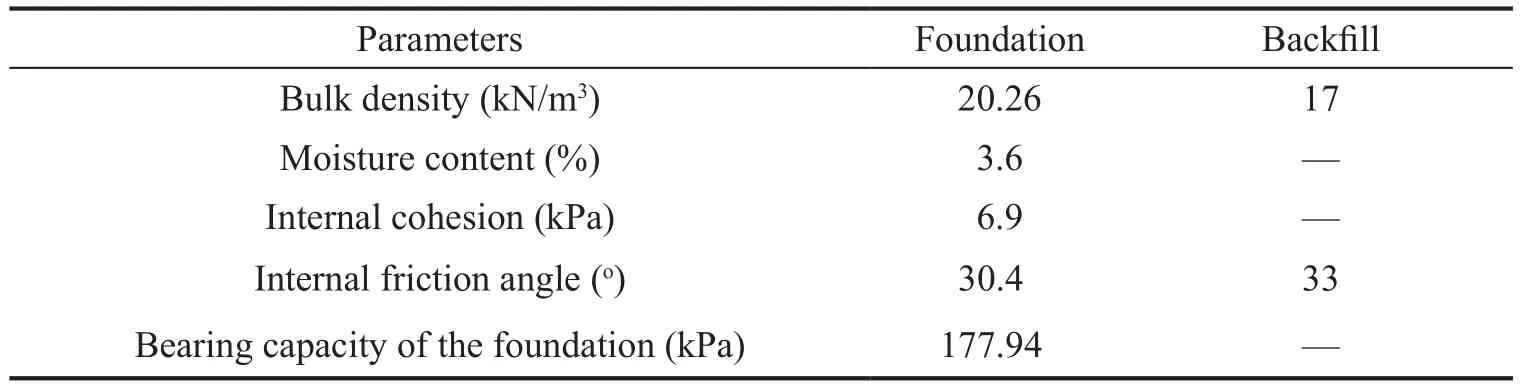
Table 3 The parameters of the model material
3.4 The test loading
The test selects the strong seismic record of the Wenchuan Wolong station with similar conditions to the site where the prototype is located, and compressed according to the law of similarity.The time compression ratio is 1: 2.45, and the processed seismic wave duration is 65.3 s, as shown in Fig.8.The dynamic characteristic test was white noise, and it is considered to input the fivestage acceleration time-histories of the PGA normalized by the Wolong wave from the horizontal direction and the vertical direction to 0.1 g, 0.2 g, 0.4 g, 0.7 g, and 0.9 g,respectively.
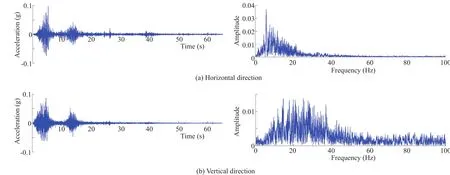
Fig.8 Acceleration time history after compression when the PGA is 0.1 g
3.5 Model material selection
The 128-channel data acquisition system is used for data collection, the maximum reference error ≤ 0.5%.And the signal conditioning instrument is connected to the charge converter to convert voltage signals, the maximum reference error ≤ 1%.Data acquisition,detection signals and online analysis are carried out simultaneously, as shown in Fig.9.
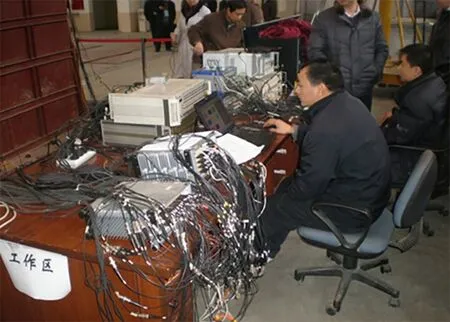
Fig.9 Systems of computer number control (CNC), data acquisition and analysis
Displacement sensor, earth pressure gauge and acceleration sensor is arranged in the test.The displacement sensor adopts two types of differential displacement gauge (accurate to 0.001 mm) and pulltype displacement gauge (accurate to 0.01 mm); the earth pressure box is a strain gauge and piezoelectric earth pressure box with different ranges, which are used to test the total earth pressure and dynamic earth pressure strength of the wall back, all of their nonlinearities are ≤1%.The accelerometer uses three-term accelerometers,the charge sensitivity is about 247 mV/ms-2, the installed resonance frequency is ~2.5 kHz, the frequency range is 0.03 Hz-0.8 kHz, the maximum transverse sensitivity ≤ 5%,the working temperature is -20-80 degrees Celsius, the weight is about 230 g, and the maximum measuring range 20 ms-2.The spatial test arrangement of the sensor is shown in Fig.10.
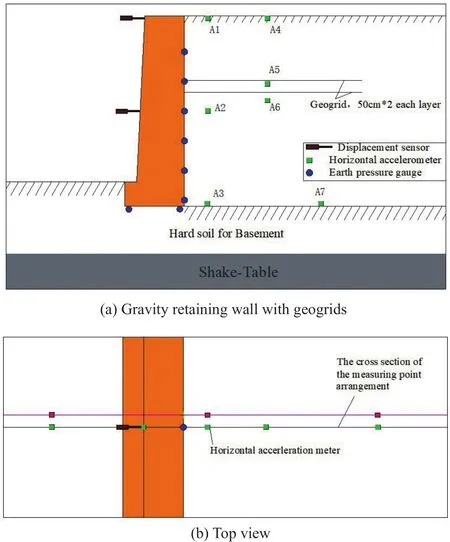
Fig.10 Instrument configutation for test models
4 Identification of the slope seismic damage
4.1 Application of the HHT
This study was based on the acceleration timehistories of 7 measuring points at different locations in the slope.A1-A3 measuring points (the first group) were20 cm away from the wall, while A4-A7 measuring points (the second group) were 70 cm.The acceleration time-histories measured in shaking table test were decomposed by EMD, and then a series of IMFs were obtained.The results revealed that the first four orders of the IMFs nearly included most amplitude components of the original signal.When the PGA equals to 0.1 g, the IMFs with first four orders of A1 are shown in Fig.11.
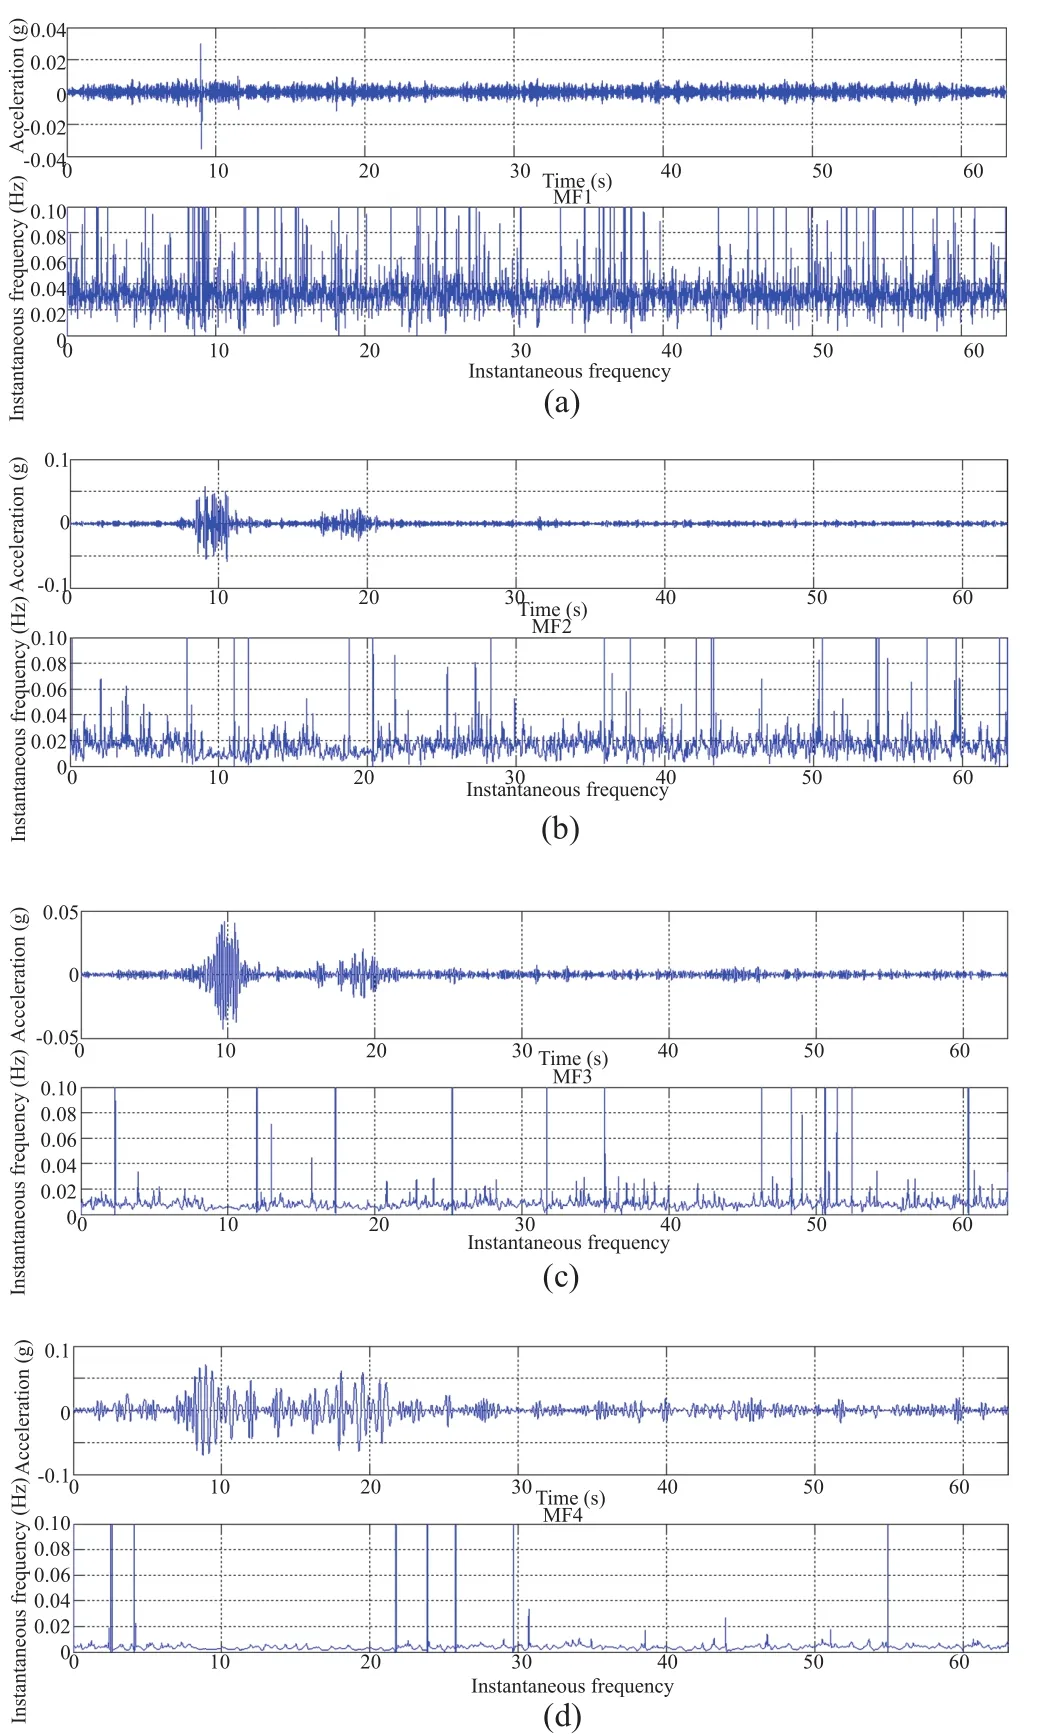
Fig.11 The IMF and instantaneous frequency of the first four order
By comparing the results of the first four orders of the IMF, it can be found that the IMF2 component has high amplitude, rich frequency information and uniformity distribution of the instantaneous frequency.Therefore,this component was selected for the HMS analysis.
When the PGA is 0.1 g, the HMS of the IMF2 components of A1-A3 measuring points were obtained by the HHT, as shown in Fig.12.
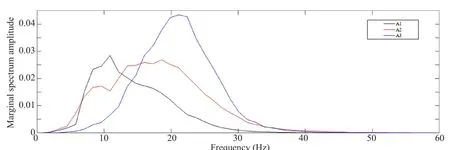
Fig.12 The marginal spectrum of measuring points A1-A3
4.2 Damage analysis based on HMS identification
Based on the damage identification principle of the HHT, the marginal spectrum of the acceleration timehistories of each measuring point of the slope is analyzed.If the marginal spectral peaks of each measuring point in a sequence of measuring points from the toe of the slope to the top of the slope basically meet the law of linear growth and the amplitude changes are small, it means that the slope has not broken during this process; under a certain magnitude seismic loading, the characteristic value of the marginal spectrum changes greatly, and the characteristic values of some measuring points are similar, from the perspective of damage analysis, it was shown that seismic damage occurred in a certain part of the slope.Therefore, this paper calculates the MSCAs of the IMF2 component at all measuring points in the GRWG reinforced subgrade slope, as shown in Figs.13-14.
Through the analysis of the above figures, it can be found that the MSCA at each measuring point of the subgrade slope reinforced by GRWG has the following change.Firstly, the MSCAs of the measuring points(e.g., A2, A3, A5, A6, A7) locating near and below the geogrids are significantly smaller than those of the measuring points locating above the zone (e.g., A1, A4);Secondly, the MSCAs of A3 and A7 measuring points are not affected by the intensity of ground motion, and decreased after PGA 0.4 g; Thirdly, when the PGA is less than or equal to 0.4 g, the difference of MSCAs of the measuring points at different elevations is not great.However, when the PGA is greater than 0.4 g,the difference of the MSCAs of the measuring points at different elevations is increasing sharply.At last, the MSCAs of A2, A5, and A6 measuring points which are located near the geogrids are strongly influenced by the intensity of the ground motion, and change abruptly with the increase of intensity of the ground motion.However,it can be clearly seen that the MSCAs of A5, A6, which are in the interior of the slope, are changed at the 0.4 g, but for A2, which is near the surface of slope, the MSCA is changed at PGA 0.7 g.The results of the above analysis process are summarized, as shown in Table 4.
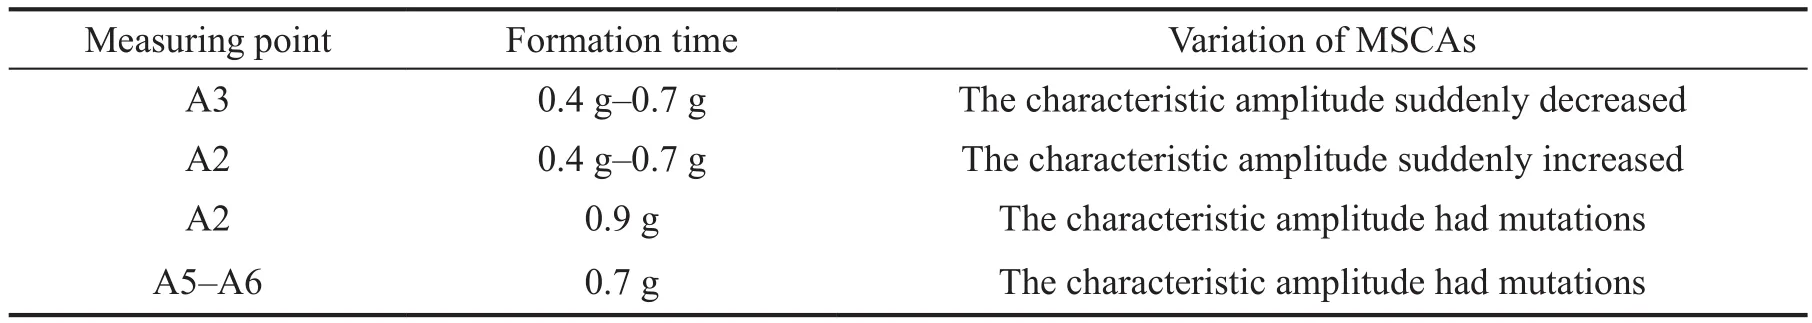
Table 4 The summary of damage development parts and features
Therefore, the change law of MSCAs of each measuring point can be explained.First of all, the existence of the geogrid makes the energy of ground motion cannot be transferred completely in the region between the two layers of geogrids, the geogrid can effectively absorb the energy of ground motion.Secondly, when the PGA is low (less than or equal to 0.4 g), the effect of the geogrids is not obvious, the MSCAs of the regions on both sides of the geogrid is not very different.With the increase of PGA, the interaction between the geogrid and surrounding soil is intensified,and the damage first occurs inside the slope, and then gradually develops to the surface of the slope.
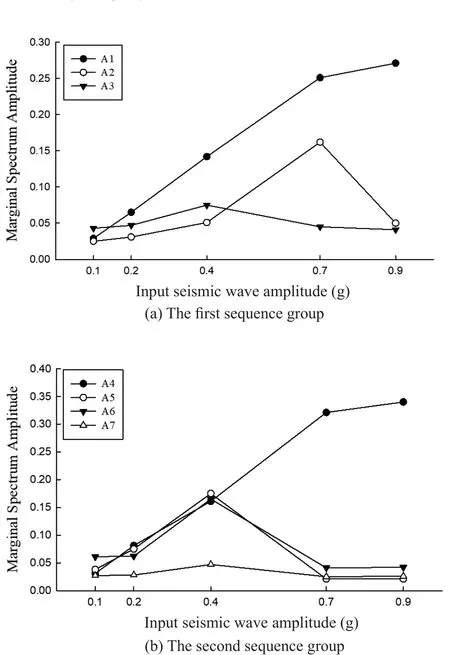
Fig.13 MSCA of measuring points with different PGAs
5 Seismic mechanism of subgrade slope reinforced by GRWG
Displacement meters were arranged in the middle and the top of the GRWG to measure the displacements.The gravity retaining walls were prone to rotation under ground motion.However, for the subgrade slope reinforced by GRWG, the friction between the geogrid and the soil increases the anti-rotation and antidisplacement ability.Displacement monitoring results show that the displacement of the GRWG is relatively small, and the growth trend is also gentle, as shown in Figs.15-16.
From the perspective of wall displacement, in areas where the seismic intensity is Ⅷ and below, the seismic performance of GRWGs and GRWs is not much different, according to the current seismic code design of GRW can meet the aseismic requirements.For Ⅷdegree and above in seismic intensity area, the GRW has obvious tilt displacement, and the top displacement and rotation of the wall increase sharply with the increase of PGA, which seriously affects the seismic stabilityof the retaining wall.At the same time, GRWG should be adopted for seismic design.Similarly, the seismic earth pressure of the retaining wall can also prove this conclusion, as shown in Fig.17.
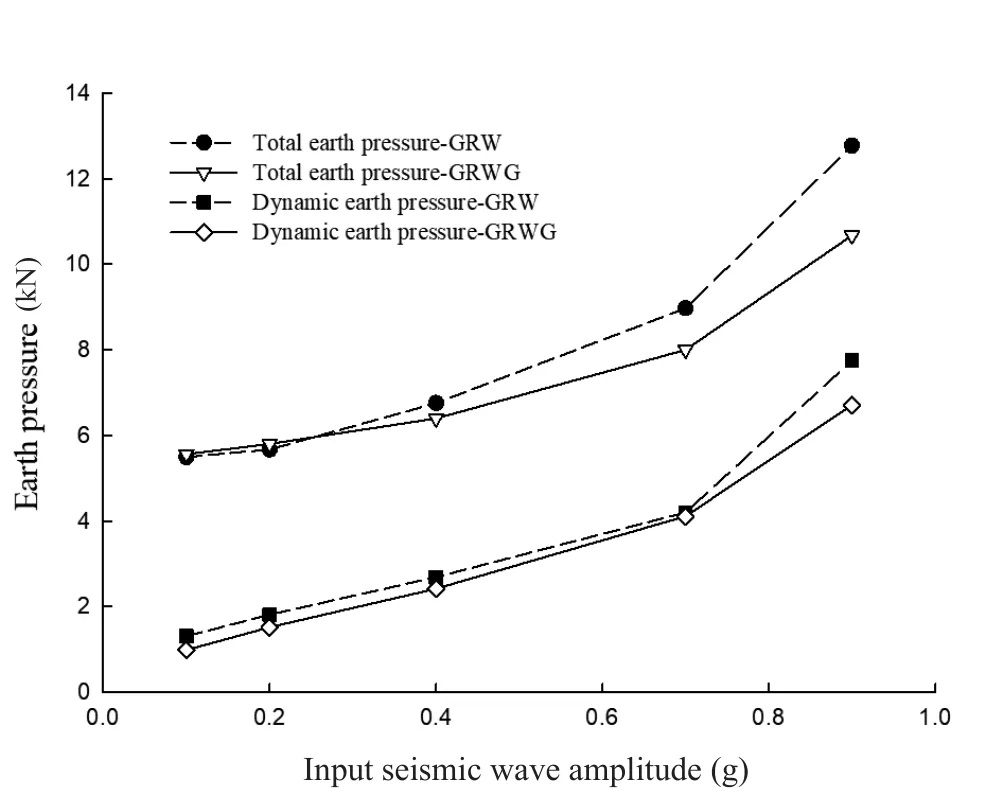
Fig.17 Wall back earth pressure changes with PGA
The retaining wall-soil mass constitutes a non-linear dynamic interaction system under the action of ground motion, experimental research shows that the earth pressure distribution and its change are related to the wall displacement.Therefore, the state of the slope can be inferred based on the change of the earth pressure.The monitoring results are shown in Fig.18.
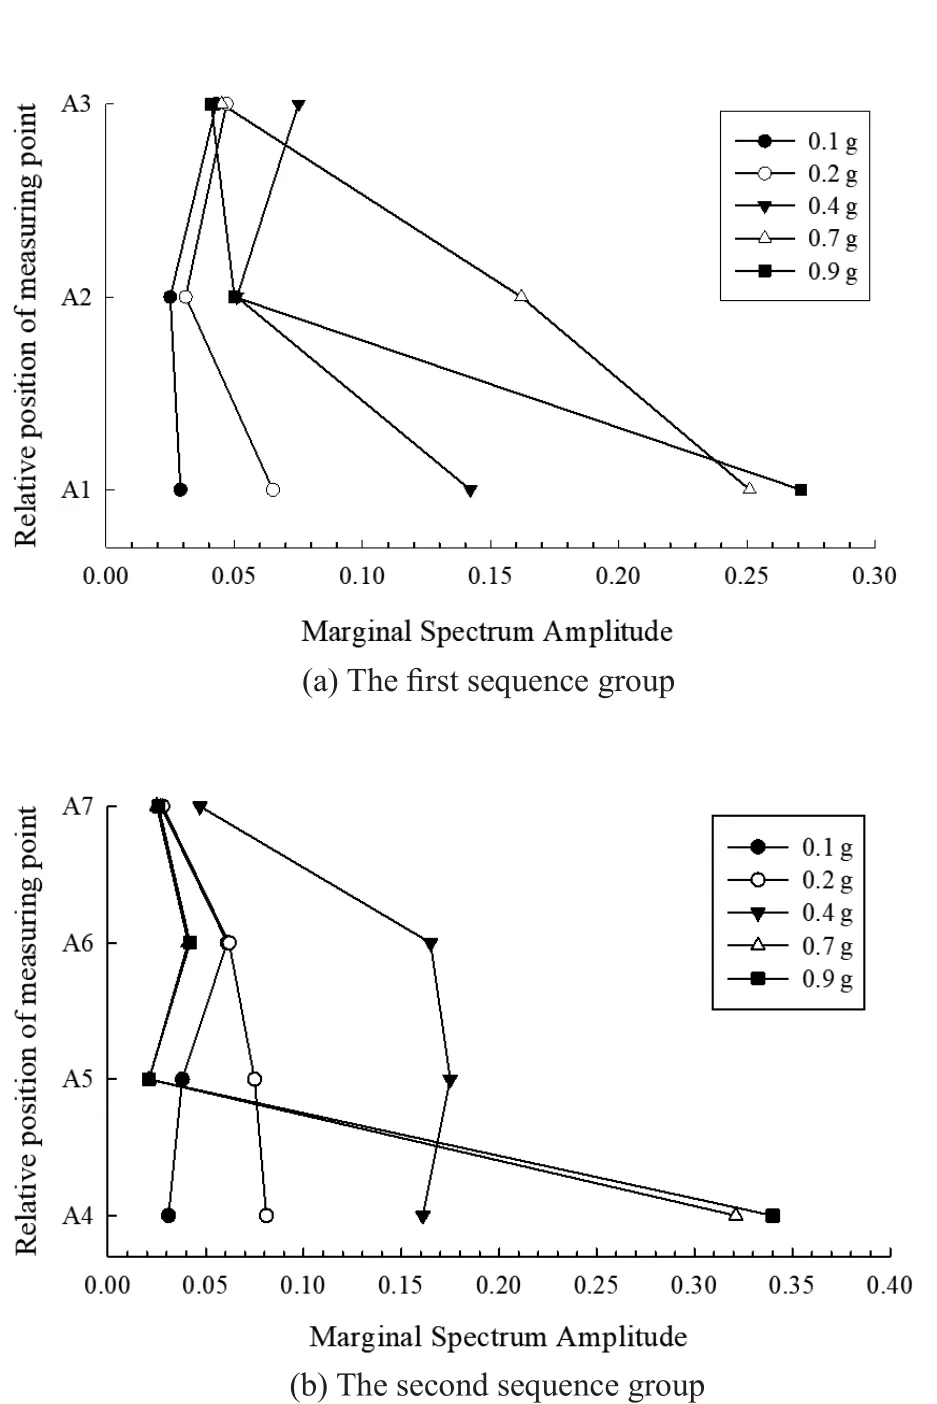
Fig.14 MSCA of measuring points with different elevations
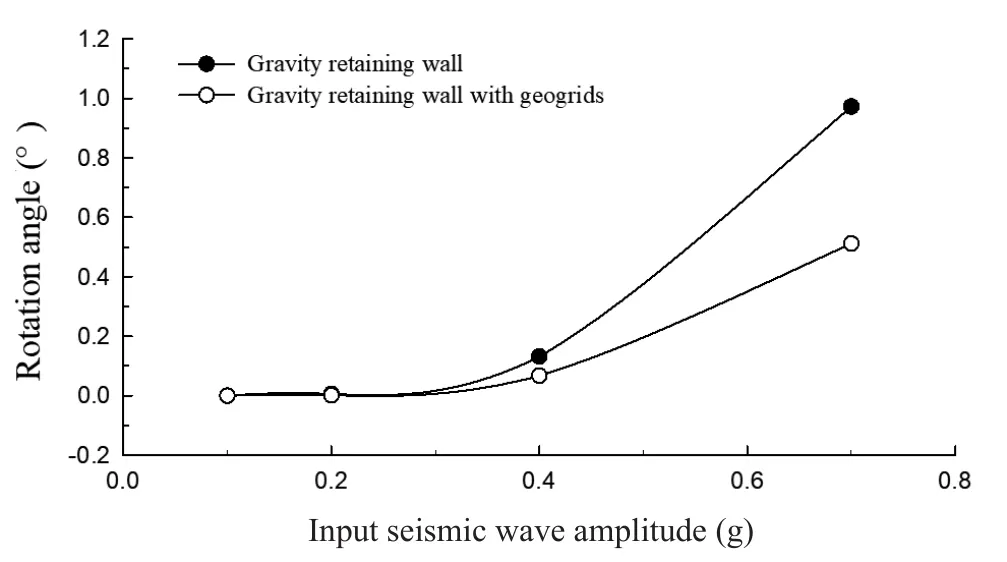
Fig.15 Rotational angle of the GRWG varies with PGA
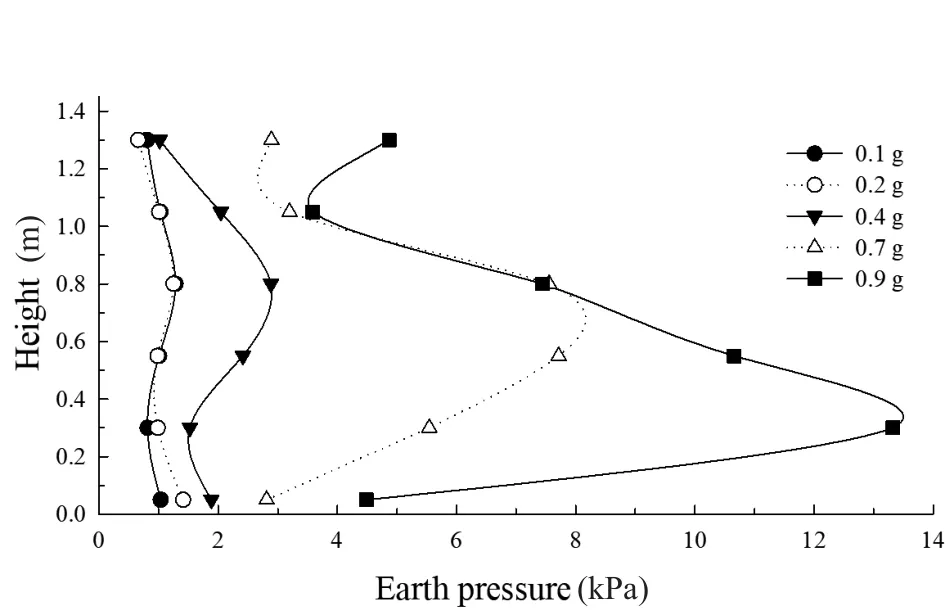
Fig.18 Earth pressure distribution
It can be seen from the diagram that the earth pressure is proportional to the acceleration of ground motion.From the distribution law of the entire earth pressure,the larger the acceleration of ground motion, the closer it is to the triangular distribution.When the PGA is small (0.1 g-0.2 g), the distribution of earth pressure is relatively balanced.When the PGA increases gradually to 0.4 g or 0.7 g, the earth pressure on the height close to the geogrid (0.5H-0.65Hfrom the top of the wall) tends to increase.With the increase of PGA, the earth pressure in this area further increased, which was caused by the geogrid being pulled outwards owing to the rotation of the retaining wall, and then the soil around the geogrid was pressed against the wall back.
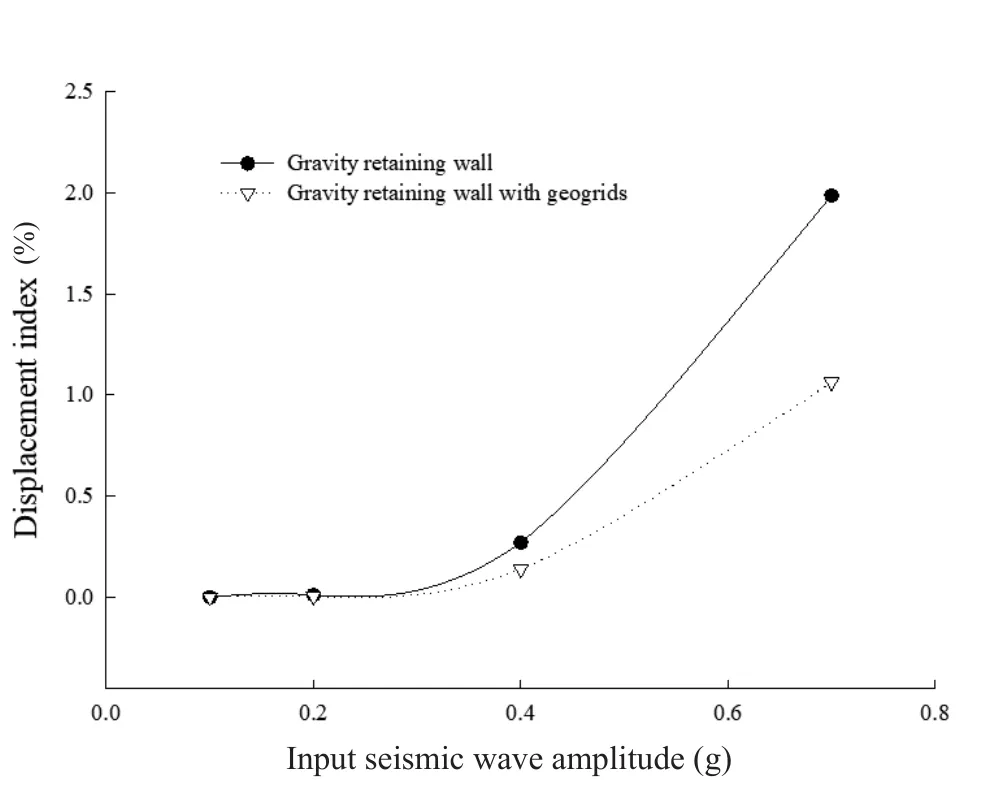
Fig.16 Horizontal displacement and rotation of the GRWG
The studies have shown that the location and formation process of the slip surface depends to a large extent on factors such as soil properties, seismic intensity,and wall displacement patterns.In order to facilitate the observation of the soil slip surface behind the wall, five layers of colored sand layers were thinly laid in the fill behind the wall, each layer was about 3 cm thick, and a dial indicator was installed on the top of the backfill to measure the settlement of different parts.The wrinkle deformation of the colored sand belt and the settlement difference of the dial indicator can be used to determine the position of the slip surface of the backfill.When the PGA is large, the deformation and sedimentation difference of the colored sand belt is obvious.Taking PGA 0.7 g as an example, the position of the measured slip surface is shown in Fig.19.
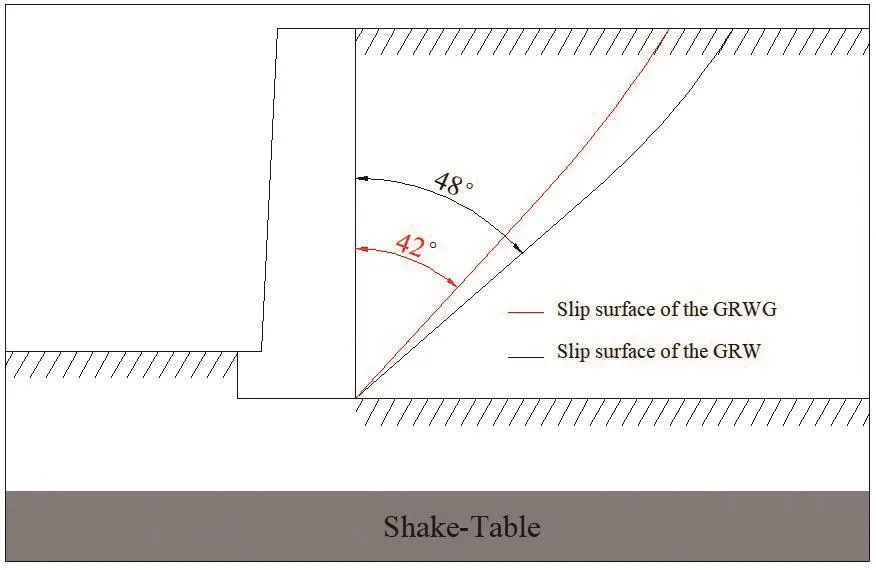
Fig.19 The slip surface of the filler behind the wall at PGA=0.7 g
It is not difficult to see that the setting of the geogrid can play a good role in limiting the wall under the action of ground motion, and can also cause the fracture angle of the filler behind the wall to become smaller, and will act a good part in blocking the acceleration amplification.Under the action of ground motion, the earth pressure behind the wall is generated by the inertial force of the soil behind the wall, and the inertia force of the soil behind the wall is proportional to the acceleration amplification ratio, which means that the GRWG can effectively reduce the inertia force of the soil behind the wall.Especially the seismic inertial force of the upper filling soil greatly reduces the seismic earth pressure on the upper part of the wall back, and improves the antioverturning ability of the retaining wall.The combined effect of the two causes the back soil pressure of the GRWG to be reduced compared to the ordinary gravity retaining wall, which is one of the reasons why the back soil pressure of the reinforced wall decreases.Therefore,combined with the displacement of the GRWG and the change of the earth pressure distribution, this failure development process is well proved.
Based on the identification results of the MSCA amplitude changes in the acceleration time-histories,combined with the monitoring results of displacement and earth pressure, the following inferences can be drawn about the failure development of the GRWG reinforced slopes.Firstly, when the PGA is less than 0.4 g, the retaining wall will produce horizontal or rotational displacements under ground motion, but the displacements are relatively small.The friction force between the geogrid and the soil is not fully exerted, so that the soil above the geogrid is less affected by ground movement and has less damage.When the PGA is less than or equal to 0.4 g, the MSCA of measurement points at different heights is not much different.Secondly, when the PGA is greater than 0.4 g, the rotation and horizontal displacement of the retaining wall increase, which results in an increase in the limit action of the geogrid and the surrounding soil, and the traction movement of the geogrid causes the soil around the geogrid and the back of the retaining wall to squeeze out.At the same time, in the region where the geogrid penetrates into the interior of the slope, the friction of the geogrid occurs first, while the MSCA of A5 and A6 suddenly changes at 0.4 g of PGA.Third, when the PGA is greater than 0.7 g, the retaining wall has a further displacement, and the effect of the geogrid exerts continuously.At the same time, the damage of the soil around the geogrid gradually developed to the slope surface, and extended to the entire area of the geogrid.The MSCA of A2 changed abruptly when the PGA is 0.7 g.In addition, the peak earth pressure of the wall moves downwards from the middle, because the slip surface along the geogrid has been created inside the slope, and the stress is released.
6 Conclusions
In this paper, HHT marginal spectrum analysis of the acceleration time-histories of shaking table is carried out, and the failure mode of subgrade slope reinforced by GRWG is analyzed.The analysis results are compared with measurements of displacement and earth pressure from the shaking table test.Based on the research results in this paper, the following conclusions can be obtained.
(1) The geogrid has good vibration isolation effect,and the soil above the geogrid is less affected by ground motion.When the intensity of ground motion is low, the magnitude of the dynamic response of the zone above the geogrid is smaller than the area below the geogrid,but the difference is not significant.When the intensity of ground motion increased to 0.4 g, the magnitude of the dynamic response characteristics of the zone above the geogrid is greater than the zone below the geogrid.It indicates that the isolation effect of geogrid on the ground motion increases with the increase of PGA, and the connection between geogrid and retaining wall can play a good role in limiting the displacement of wall.Therefore, the geogrid is considered to have isolation effect in terms of displacement and acceleration.
(2) With the increase of the PGA, the displacement of the retaining wall also increases, and it leads to the increase friction between the geogrid and its surrounding soil.When the PGA is increased to 0.4 g, the soil aroundthe geogrid of the interior of the slope is damaged.Then,with the increase of PGA, the damage gradually develops from the internal part to the surface of the slope, and finally forms a coherent rupture along the geogrid.The change of the earth pressure distribution on the back of the wall and the slip surface also proved this conclusion well.
(3) Through the above comparative analysis, we recommend that when the MSCA value of any point inside the slope changes between the existing trend and the horizontal limit of the point, it can be considered that the point is only deformed, but there is no damage; if the MSCA value of the point begins to trend below the horizontal limit of the point, the part is considered to be damaged, and the rest of the changes are considered to be stable without deformation or damage.
(4) The method of judging the seismic damage characteristics based on MSCA is applied to the subgrade slope reinforced by GRWG.The results of this method are in a good consistency with the monitoring results of the shaking table test.It proves that this method has good accuracy and effectiveness in the study of the failure mode of the subgrade slope with retaining structure.It is of significance to study the dynamic failure mode of subgrade slope reinforced by other retaining structures.
Acknowledgement
This study was supported by the Strategic International Science and Technology Innovation Cooperation Project ‘Research on On-line Monitoring and Evaluation Technology of Safety Status of Highspeed Railway Track-subgrade System’ from the National Key R&D Program of China (Grant No.2018YFE0207100),and the National Natural Science Foundation of China(Grant No.41602332).
杂志排行

Earthquake Engineering and Engineering Vibration的其它文章
- Property estimation of free-field sand in 1-g shaking table tests
- Dynamic p-y curves for vertical and batter pile groups in liquefied sand
- Underground blast effects on structural pounding
- An analytical model for evaluating the dynamic response of a tunnel embedded in layered foundation soil with different saturations
- Controlled rocking pile foundation system with replaceable bar fuses for seismic resilience
- Seismic ground amplification induced by box-shaped tunnels