Behavior of Crude Oil Leakage from Underwater Damaged Hole of Oil Tank in Waves
2022-06-18,-,-,-
,-,-,-
(School of Naval Architecture and Marine Engineering,Jiangsu University of Science and Technology,Zhenjiang 212100,China)
Abstract:A numerical model for simulation of crude oil leakage from a damaged tank in waves was es⁃tablished based on viscous fluid dynamics, multi-phase flow model and free surface capturing meth⁃od—volume of fluid(VOF)method.Firstly,two-dimensional oil leakage from a tank in calm water was simulated for verification of the numerical model,and the results are in good agreement with the exper⁃imental data.Then a three-dimensional numerical wave tank (NWT)with wave-making and wave-ab⁃sorbing function was constructed with velocity inlet wave-making method through user defined func⁃tion(UDF)programs based on CFD method.Finally,the oil leakage from a damaged tank in waves was modelled using a three-dimensional numerical method. The influence of wave height and wavelength on leakage was numerically analyzed,and it is found that the leakage and leakage rate of oil tank with bottom hole increase with the increase of the wave height. Meanwhile, the more intense the heave is,the greater the leakage rate and leakage are under different wavelengths. The leakage rate and the re⁃sidual oil volume in the tank were calculated for the damaged hole facing and following the incident waves respectively.The results show that the damaged hole facing the incident wave results in more leakage.
Key words:damaged oil tanker;oil leakage;wave;VOF method;numerical simulation
0 Introduction
In recent years,the oil spill accidents still abound,causing enormous losses to the marine eco⁃logical environment and the economy[1]. How to predict the oil spill from damaged oil tankers and make sound decisions in the early stage of accidents to reduce the harm has attracted much atten⁃tion in the field of naval architecture and ocean engineering.Chang and Lin(1994)[2]experimentally studied the leakage from the damaged oil tank with a 1/30 scale model of a 280 000 DWT oil tanker and a full-scale 40 000 DWT double-hull tanker. Computational fluid dynamics (CFD) program was applied to establish a two-dimensional numerical model to describe the oil leakage. The reli⁃ability of the model for simulating the oil leakage from a damaged tank in calm water was verified.However,fluid viscosity and flow turbulence were not considered in their numerical simulation.Ta⁃vakoli(2011,2012)[3-4]performed experimental tests to investigate the influence of hole location and size, the double-bottom and the double-sided design on the leakage from the damaged oil tank in calm water.It is found that the double-sided design has the best performance,and the gravitational force has the majority influence on the condition of the damaged holes on the bottom. Lu and Liu(2014,2015)[5-6]designed a test model for the oil leakage process analysis.The influences of oil phys⁃ical properties, damaged hole specification and the hull structure type of ship on leakage were con⁃sidered in the model test. The unsteady Bernoulli’s equation for viscous fluid was applied to verify the experimental data.The VOF method was used to realize the three-dimensional numerical simu⁃lation of oil, gas and water, and the phased analysis method was proposed, which established a methodological basis for the analysis of multiple effects in the oil leakage process. Yang (2016,2018)[7-8]combined the VOF method and dynamic grid technology to construct a full-scale model of crude oil leakage for a rolling tanker in calm water. The results show that the resistance-leakage of double-hull structure in a static tank and the law of crude oil leakage in a static tank have limita⁃tions in predicting the process of crude oil leakage under actual sea conditions.
In the present study, a mathematical model of oil leakage in waves is established based on the theory of viscous flow. Firstly, the numerical simulation of oil leakage in calm water is carried out and compared with the experimental results to verify the feasibility of the numerical method. With the assumption that two degrees of freedom of the tank, heave and roll are released, a numerical model for oil leakage in external environmental waves is established. Then a comparative analysis of the transient speed of oil leakage from the underwater damaged holes of a tanker and the volume fraction of the remaining oil in the tank under different wave directions is conducted to obtain the law of oil leakage from the underwater damaged holes of oil tanks in waves.
1 Theoretical background
1.1 Governing equations
(1)Continuity equation
The continuity equation for incompressible fluid is

whereFis the force per unit mass,ρis the fluid density,pis the pressure,μis the dynamic viscosi⁃ty coefficient.
1.2 Turbulence model
The violent flow of oil and water during the crude oil leakage from the underwater damaged holes of a tank is the turbulent motion of oil-water-air interaction[7], the standardk-εturbulence model is employed to describe the turbulent fluid flow.
kequation:


1.3 Multi-phase flow model
The VOF method is very suitable for capturing free surface fragmentation or wave breaking and identifying the interface between different phases.The volume fraction of Phaseiis defined asαiin the VOF method:

whereViis the volume of Phaseiin the grid cell, andVis the volume of the grid cell. The sum of the volume fractions of all phases in a grid cell must be 1:

whereNis the number of phases in the calculation domain.The existence of Phaseiin the grid cell can be judged according to the value ofαi. Whenαi= 0, no Phaseiexists in the grid cell. Whenαi= 1, only Phaseiexists in the grid cell. When 0 <αi<1, there is an interface between Phaseiand other phases in the grid cell.αialso needs to satisfy the equation:

1.4 Numerical wave tank
The wave-making of the numerical tank adopts the user-defined function (UDF) of FLUENT software to realize the wave-making function.The velocity entrance wave-making of FLUENT is se⁃lected. The basic principle is to define the velocity distribution at the entrance according to the ve⁃locity of water particles in waves.For linear waves,the velocity of fluid particles at the inlet inx-di⁃rection is

whereais the wave amplitude,ωis the wave frequency,k1is the wave number,zis the vertical height at the average water level,the periodT= 2π/ω,and wave lengthλ= 2π/k1.
Force zone at the velocity-inlet boundary is used to absorb waves. Wave forces are obtained by adding source terms to momentum equations in the following form:

whereλis the wave length,x0andxLare thexcoordinate values of the left and right boundaries of the wave-absorbing zone,respectively.The factorctakes different values under different parameter conditions.In this study,the value ofcis set to be 10 according to the trial calculation value.
2 Verification of numerical simulation method
2.1 Comparison between simulation and experiment of leakage in calm water
Assumptions: (1) The three phases of flows (oil, gas, water) are incompressible and there are free interfaces between them; (2) The leakage process is completely adiabatic, there is no heat ex⁃change among the three phases(oil,gas,water);(3)In the process of leakage,the oil does not evapo⁃rate and the gas above the tank is pure air. The standard atmospheric pressure is selected for tank pressure,which isp0=101325 Pa.The densities of water,air and oil are 1000 kg·m-3,1.29 kg·m-3and 860 kg·m-3respectively. And crude oil viscosity is 0.01 Pa·s. For verification of the validity and accuracy of the numerical model, a physi⁃cal model experiment corresponding to the nu⁃merical calculation is designed. The dimen⁃sions of the experimental model are shown in Fig.1. Fig.2 displays the comparison between the results of the oil leakage test and the calcu⁃lation.In Fig.2,the red and yellow colors repre⁃sent oil and water while the blue color repre⁃sents air.The results of the numerical simulation and test are consistent.
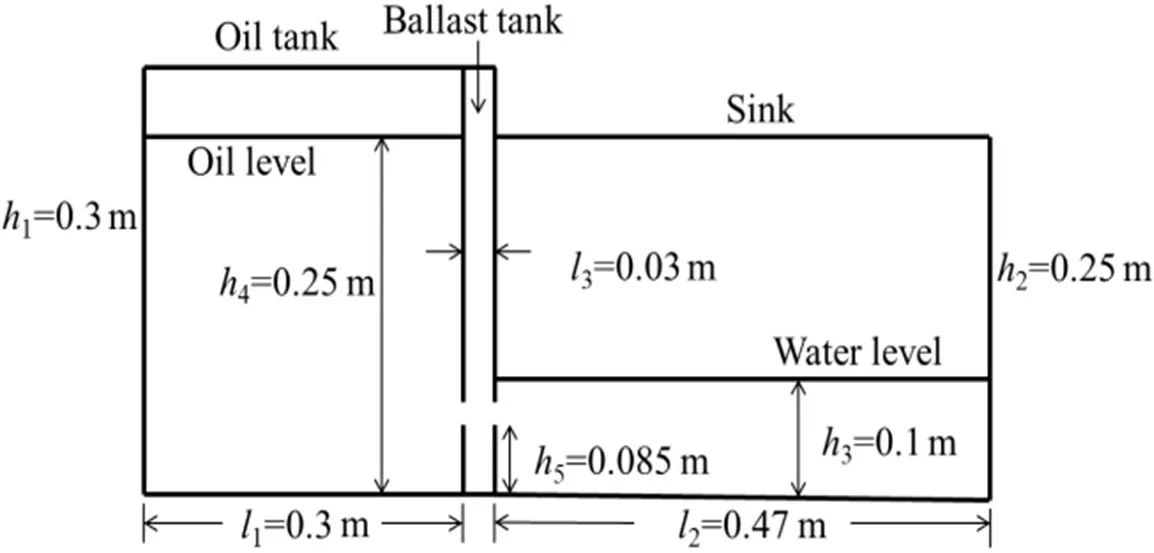
Fig.1 Damaged tank model

Fig.2 Comparison of oil spill between experiment and two-dimensional numerical simulation
2.2 Wave making verification
The wave with a height of 0.04 m and a length of 2 m is chosen as the target wave of numerical simulation. The numerical tank is 14 m in length,3.744 m in width, with a water level of 2.15 m. The length of the wave-absorbing zone is double the wavelength, and the length of the force zone is one wavelength. The volume fraction of air is set to be 0,and the volume fraction of water is 1. According to Ref.[9], 16 grids are set in wave height direction, the grid aspect ratio is 1:4, and the time step is 0.003 s.The result between 30 s and 40 s is shown in Fig.3,and the simulation results can meet the accuracy re⁃quirements.
3 Numerical simulation of crude oil leakage for rolling tank in waves

Fig.3 Comparison of numerical simulation results and theoretical values
A model of the leakage from the damaged holes at the bottom and side of the oil tank in waves is established. Two degrees of freedom, namely heave and roll, are released. The wave parameters are shown in Tab.1.Seven cases (in Tab.1)are selected to study the influence of wavelengths and wave heights on oil leakage from the damaged holes of the tank when the initial water level is the same.

Tab.1 Wave parameters under different conditions
3.1 Oil leakage model of the oil tank in waves
The tank type is of a 74 500 DWT product oil tanker[10], whose main dimensions are listed in Tab.2.

Tab.2 Ship type parameters of oil tanker
The scale of the numerical model is 1:50.The length of the model is taken as 624 mm because a section of liquid tank is to be studied. There are two empty cabins and an oil tank, the length of the oil tank is 0.4 m. According to Ref.[11], the function of the empty cabin is to make the gravity and buoyancy equal. The width of the model is 0.65 m, and the thickness of the bulkhead is 0.012 m. The height of the model is taken as 0.425 m. The opening at the top is set to connect the tank with the external environment and eliminate the influence of tank pressure on the leakage process.To prevent water from entering the oil tank through the opening, a cover is added on the opening.The top opening size is 0.25 m×0.376 m. The opening size of the two empty compartments is 0.626 m×0.1 m. The diameter of the hole is 0.06 m. The opening position is shown in Fig.4. The liquid filling ratio of the tank is 50%, namely the liquid level in the tank is 0.2 m. The oil density is 915 kg/m3[5-6]. The density of oil tank material is 1180 kg/m3, which is the density of acrylic. The oil tank draft is 0.179 m.

Fig.4 Model size
Fig.5 shows the mesh generation of the leakage model.The total number of grids in the fluid do⁃main of this numerical model is 2.18 million. The distance from the tank to the entrance boundary is twice the wavelength.Fig.6 displays a contour of the numerical model.

Fig.5 Meshing
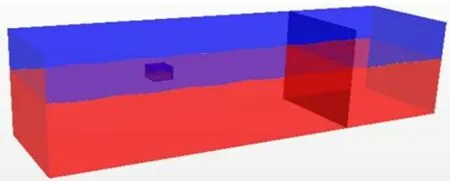
Fig.6 Contour of numerical model
3.2 Influence of wave height on oil leakage from the bottom hole of an oil tank
The fixed wavelength is 2 m, and the wave heights of three different wave conditions are 0.04 m, 0.05 m and 0.06 m. The influence of wave height on the leakage characteristics is analyzed by comparing the mass flow through the damaged hole at different time and the volume fraction of the remaining oil in the tank.
3.2.1 Influence of wave height on tank motion
It can be concluded from Figs.7-9 that the higher the wave height is, the greater the ampli⁃tude of heave and roll motion is. Due to the oil leakage in the tank, the liquid in the oil tank de⁃creases.Therefore the heave motion tends to move the equilibrium position upward. The leakage of the liquid leads to the reduction of the draught of the oil tank and changes the balance position of the oil tank. The heave curve is divided into three sections for Fourier transform.The specific reasons are explained in Section 3.2.2.In Fig.8,by Fou⁃rier transform of heave motion curve,it can be found that heave is affected by wave frequency.And there is also a slow drift frequency,which is caused by the upward shift of the balance position.
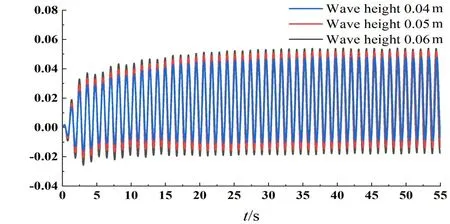
Fig.7 Time domain curve of heave motion of oil tank under different wave heights

Fig.8 Fourier transform of heave under different wave heights
The roll curve in Fig.9 shows an envelope shape in the early stage of the leakage, indicating that other frequencies affect the roll motion be⁃sides the wave frequency. As shown in Fig.10, in addition to the wave frequency, the natural fre⁃quency of the initial liquid sloshing in the oil tank affects the rolling at the beginning of the leakage. Moreover, there is a response amplitude at a frequency close to 0, which is the slow drift frequency of the roll curve. The degree of free⁃dom of sway is not released in this study.When the oil tank is hit by the wave crest,there will be an inclination angle between the oil tank and the water surface. With the increase of the wave height,the inclination angle increases. In addition, oil leakage, oil-water mixing and oil-water sloshing have caused this change in inclination, so the roll curve will have a slow drift frequency. Through the above analysis,it can been seen that the higher the wave height is,the larger the heave and roll are.

Fig.9 History of roll motion of oil tank under different wave heights

Fig.10 Fourier transform of roll under different wave heights
3.2.2 Influence of wave height on mass flow
The influence of wave height on the leakage rate is shown in Fig.11. A positive value of mass flow represents oil leaking from the tank,and a negative value represents oil backflow into the tank.The oil tank has periodic movement under the action of the waves,resulting in a periodic oscillation of the oil mass flow rateQoat the hole.At the beginning of the leakage,there is no significant differ⁃ence inQo, indicating that the leakage is not affected by wave height. After 2.5 s, the higher the wave height becomes,the greater amplitude ofQois.The trend shows that the increase in the ampli⁃tude of the movement of the tank leads to an obvious difference in oil leakage under the action of the waves. The leakage rate is affected by gravity, and the effect of gravity gradually disappears af⁃ter 20 s.Qobecomes stable after 40 s,and the pulsation law does not change.Fig.11 cannot fully re⁃flect the impact ofQoon leakage at different wave heights. Therefore, it is necessary to perform mean filtering on theQocurve in Fig.11 to obtain the average value ofQo. As shown in Fig.12, be⁃fore 15 s the higher the wave height becomes, the smallerQois. And after 15 s the higher the wave height becomes,the greaterQois.This is because in the early stage of leakage,gravity is dominant,and the pulsating pressure caused by the movement of the tank is relatively weak.With the increase of the tank movement amplitude, the momentum loss of the oil increases during leakage, and the leakage rate decreases. According to Fig.11,Qois analyzed in stages: the first stage is 0-20 s, in which gravity is dominant; the second stage is 20-40 s, in whichQogradually stabilizes; the third stage is 40-55 s, in which the motion pattern does not change while the wave action is dominant.Fig.13 shows the Fourier transform ofQo. In Fig.13(a), the main frequency affectingQoin 0-20 s is the frequency close to 0. Compared with Fig. 11, it can be concluded that this frequency comes from gravity. After 20 s, the effect of waves is dominant. In addition, there is a small amplitude at twice the wave frequency,which is caused by the sloshing of the oil-water interface at the damaged hole and the sloshing of the liquid in the tank.

Fig.11 Time domain curve of oil mass flow under different wave heights

Fig.12 Average filtering curve of oil mass flow under different wave heights

Fig.13 Fourier transform of oil mass flow under different wave heights
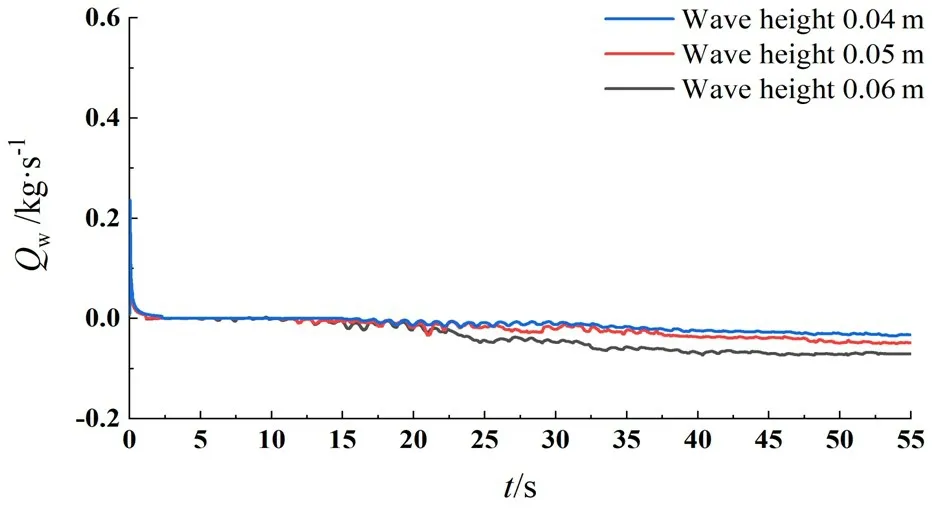
Fig.14 Average filtering curve of water mass flow under different wave heights
The curve in Fig.14 is obtained by filtering theQwcurve. It can be seen from Fig.14 that the higher the wave height is, the earlier the water enters. With the decrease of gravitational effect, the pressure difference between the inside and outside of the oil tank decreases, and theQwincreases.And the higher the wave height is, the larger the average value ofQwand the water inflow are. As shown in Fig.15, the Fourier transform of theQwcurve shows thatQwis only affected by waves. In addition, due to the sloshing of the oil-water in⁃terface at the damaged hole, a small amplitude appears at twice the wave frequency.In summary,the wave height affects mass flow at the damaged hole.ForQo,when gravity is dominant,the higher the wave height is, the smaller the average value ofQoand the leakage rate are. When the effect of gravity disappears and wave action is dominant, the higher the wave height, the greater value ofQo,and the faster the leakage.ForQw,the higher the wave height,the earlier the water inflow time,and the larger theQw,the more the water inflow.

Fig.15 Fourier transform of water mass flow under different wave heights
3.2.3 Influence of wave height on the leakage volume fraction
It can be seen from Fig.16 that the three curves coincide at the initial stage of the leakage, indicating that the wave has little effect on the leakage at this time, and gravity is the dominant factor. After 2.5 s,the curve has obvious fluctuations, and the leakage is affected by the waves. At 2.5-27 s, the higher the wave height, the less the oil leakage. After 27 s, the higher the wave height, the more the oil leakage. This corresponds to the result ofQo. To sum up, the influ⁃ence of wave height on leakage is very obvious wheth⁃er it is instantaneous or total.
3.3 Influence of wavelength on oil leakage from the bottom hole of an oil tank
The fixed wave height is 0.04 m,and the wavelengths of 5 different wave conditions are 1.50 m,1.75 m, 2.00 m, 2.25 m and 2.5 m. The influence of wavelength on leakage characteristics is ana⁃lyzed by comparing the mass flow through the damaged hole at different time and the volume frac⁃tion of the remaining crude oil in the tank.
3.3.1 Influence of wavelength on tank motion

Fig.16 Volume fraction of remaining oil in the tank under different wave heights
Since the periods of 5 waves are different, the same time interval cannot be directly taken for analysis. Therefore, we refer to the time of gravity action and the time of wave action to re-divide the heave curve: the first stage is 0T-18T; the second stage is 18Tto 35T; the third stage is 35Tto 47T.Tis the period of the wave.As shown in Fig.17,each wavelength has a drift frequency close to 0. This frequency is due to the decrease of liquid in the tank during leakage, which makes the oil tank draught decrease and the center of gravity upward. There is a response amplitude at the fre⁃quency corresponding to each wavelength. The heave response amplitude is the largest when the wavelength is 2.25 m, and the smallest when the wavelength is 1.5 m. Fig.18 is the Fourier trans⁃form of the oil tank rolling motion. From the figure, it is known that the rolling response of the oil tank is the maximum when the wavelength is 1.75 m, and its wave frequency is the closest to the natural frequency of the oil tank’s initial liquid sloshing. In Fig.18, with the natural frequency of the initial carrier liquid sloshing taken as the boundary, both sides show a tendency that the longer the wavelength becomes, the larger the roll response is, and the larger the rolling response on one side with small wavelength.

Fig.17 Fourier transform of heave under different wavelengths

Fig.18 Fourier transform of roll under different wavelengths
3.3.2 Influence of wavelength on mass flow
As shown in Fig.19,the gravity effect is obvious at the beginning of the leakage,and between 7 s to 15 s,Qois the largest at the wavelength of 1.5 m, and the smallest at the wavelength of 2.25 m.Fig.20 shows that the result of the Fourier transform is the opposite. According to the conclusion in Section 3.2, it can be seen that in the gravity-dominated stage, the movement of the oil tank is large, the momentum loss of oil and theQodecrease. By combining Fig.17(a) and Fig.18(a), we can see that the change ofQoin Fig.20 is related to the heave because the hole is opened at the bottom.After 18T,the wave action is dominant,and the average value ofQois the largest at 2.25 m and the smallest at 1.5 m,and its value is close to 0,so the leakage almost stops.This result corresponds to the result of the heave Fourier transform,indicating that when the damaged hole is at the bottom,in the wave action stage, the more intense the heave motion of the oil tank is, the greater the leakage velocity is.Fig.20 is the Fourier transform ofQo.The amplitude ofQocannot reflect the influence of oil mass flow on the leakage,because the water inflow at the later stage of leakage and the oil-water flow at the damaged hole will affect the fluctuating amplitude ofQo.

Fig.19 Average filtering curve of oil mass flow under different wavelengths

Fig.20 Fourier transform of oil mass flow under different wavelengths
Fig.21 displays the average filtering curves ofQw,it can be seen that the larger the heave response is,the earlier the water inflow starts, and the larger the heave response is,the larger the average value ofQwis.When the wavelength is 1.5 m,Qwis also close to 0, which means that the water does not flow into the oil tank and the water inflow is completely stopped. The curves ofQwis subjected to Fourier transform. As shown in Fig.22, the amplitude ofQwcorresponding to the wave

Fig.21 Average filtering curve of water mass flow under different wavelengths

Fig.22 Fourier transform of water mass flow under different wavelengths
length of 1.5 m is almost negligible.So it means that the oil seal should happen at the damaged hole for the wave length of 1.5 m.In summary,the mass flow of the oil tank with the damaged hole at the bottom is related to the heave motion.The more intense the heave motion,the larger the average val⁃ues ofQoandQw.
3.3.3 Influence of wavelength on the leakage volume fraction
It can be seen from Fig.23 that the greater the heave response becomes,the less the leakage in the gravity stage is. Although the frequency of 1.75 m wave is close to the natural frequency when the initial liquid is loaded, the tank movement has no great in⁃fluence in the early stage. Instead, when the gravity effect is weakened and the tank movement is domi⁃nant in the later stage, the effect of the movement of the tank is obvious. Static analysis shows that the fre⁃quency of 2 m wave is close to the natural frequency of liquid sloshing in the tank when leakage is stable,and the remaining oil volume curve has a tendency to intersect with the remaining oil volume curve at the 1.75 m wavelength in the later period, indicating that the leakage rate is greater than the leakage rate at 1.75 m.When the wavelength is 1.5 m,the leakage almost stops in the stable stage.From the slope of the curve in the stable stage, the leakage rate at the wavelength of 2.25 m is the largest,which is consistent with the analysis results in Section 3.3.1.
3.4 Influence of wave direction on oil leakage from the damaged hole on the sidewall
There is a certain angle between the ship's course and the direction of wave incidence, called the wave direction angle. The incident wave is selected with a wave height of 0.04 m and a wave⁃length of 2 m. The influence of wave direction on the crude oil leak from the damaged hole on the sidewall of the oil tank is studied numerically under the conditions of the damaged hole facing the incident wave(in Fig.24)and the damaged hole facing away from the incident wave (in Fig.25).The leakage condition of the damaged hole facing the incident wave is called Condition 1,and the other is called Condition 2.

Fig.23 Volume fraction of remaining oil in the tank under different wavelengths
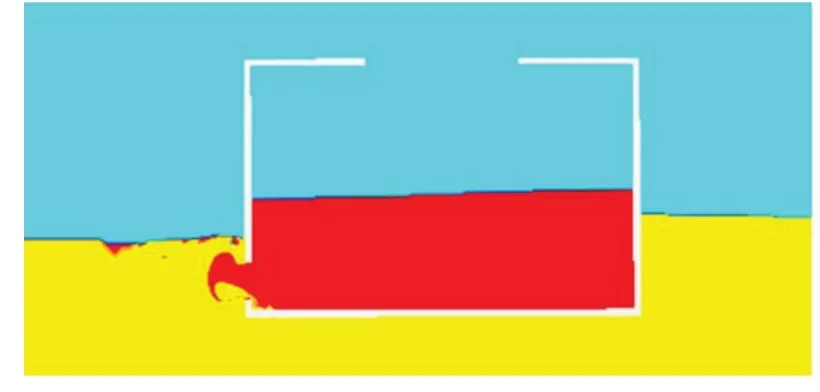
Fig.24 Contour of free surface in Condition 1
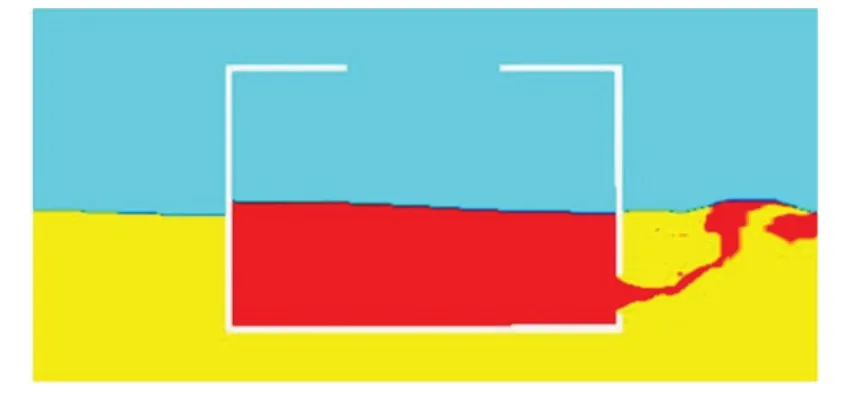
Fig.25 Contour of free surface in Condition 2
3.4.1 Influence of wave direction on tank motion
The leakage process is divided into two stages because the time of side hole leakage is too long to be stable.The first 20 s is the gravity stage,and the period after 20 s is the wave action stage.In Fig.26, the Fourier transform of heave motion shows that the response amplitude at the wave fre⁃quency is the same because the incident wave conditions are the same.By Fourier transformation of the rolling curve, we get Fig.27. As shown in the figure, the first 20 s rolling motion is not only af⁃fected by waves but also by the natural frequency of the tank during initial liquid loading. In con⁃trast to the damaged hole at the bottom, the wave has a greater impact on the rolling motion when the damaged hole is on the side. After 20 s, the natural frequency of liquid sloshing in the tank changes, so only the wave affects the rolling motion. Therefore, when the damaged hole is on the side,the influence of different wave directions on the tank movement cannot be ignored.

Fig.26 Fourier transform of heave under different wave directions
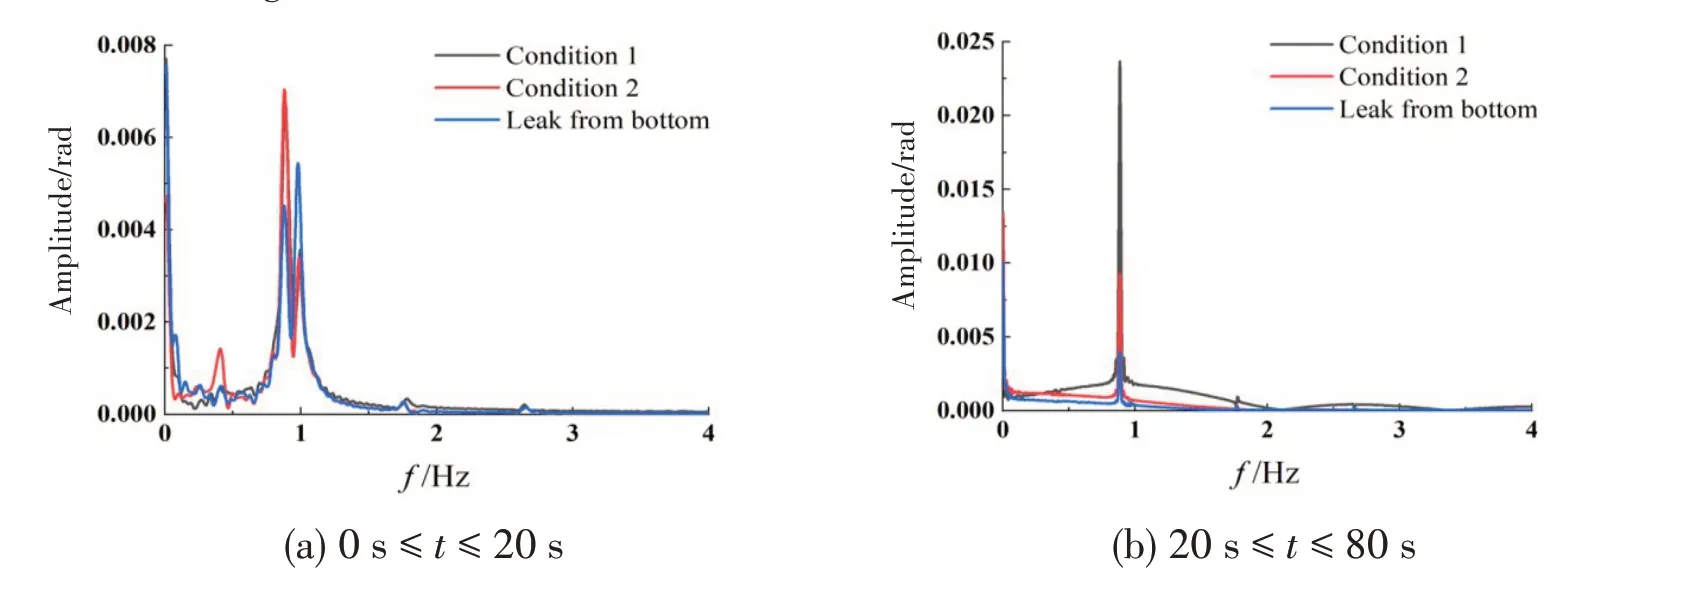
Fig.27 Fourier transform of roll under different wave directions
3.4.2 Influence of wave direction on mass flow
As shown in Fig.28, theQoof Condition 1 is larger and more difficult to stabilize. When the damaged hole is on the side, the value ofQois larger than that of the damaged hole at the bottom,indicating that the leakage rate and leakage are larger when the damaged hole is on the side. It can be ascribed to the density difference between oil and water. And this is consistent with the conclusion drawn by previous stud⁃ies on leakage of the fixed oil tanks. From the average filtering curve ofQo, the leakage of Condition 1 is also the largest. In Fig.29, the Fourier transform of theQocurve shows that Condition 1 has both the largest mean value and the largest amplitude ofQo. At the same time, by comparing the Fourier transform results of heave and rolling,it can be seen that the leakage of the damaged hole on the side is affect⁃ed by the rolling motion.

Fig.28 Average filtering curve of oil mass flow under different wave directions

Fig.29 Fourier transform of oil mass flow under different wave directions
In Fig.30,Qwof Condition 1 appears negative firstly, which indicates that this condition has water inflow at the beginning. This is related to the fact that the damaged hole faces the incident wave.When the wave propagates, the water flows into the dam⁃aged hole, but it also causes the average curve ofQwto be extremely unstable. LikeQo, when the damaged hole is on the side, the value ofQwis larger than that ofQwwhen the damaged hole is at the bottom. The conclusion is consistent with the fixed tank leakage that more water enters when the damaged hole is on the side.In Fig.31,for the Fourier transform ofQwcurve, the largest amplitude is still obtained in Condition 1, and that in Condition 2 is the sec⁃ond.It can be seen that the leakage process in Condition 1 is the most intense.In summary,the con⁃ditions of Condition 1 have the greatest impact on mass flow, and Condition 2 is the second. When the damaged hole is on the side, the effect on leakage is more obvious than that when the damaged hole is at the bottom,and the leakage of the side hole is mainly affected by the rolling motion due to the influence of the damaged hole position.
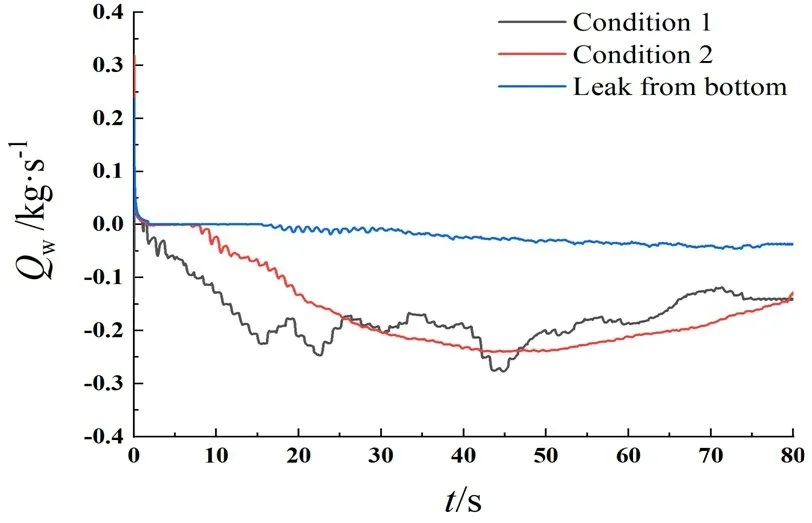
Fig.30 Average filtering curve of water mass flow under different wave directions

Fig.31 Fourier transform of water mass flow under different wave directions
3.4.3 Influence of wave direction on the leakage volume fraction
As shown in Fig.32, Condition 1 has the largest leakage, which is consistent with the results of the above analysis. When the damaged hole is on the side, the leakage is much greater than that of the hole at the bottom, which is caused by the density difference between oil and water. The open⁃ing of Condition 1 is facing the direction of wave propagation. In this condition, the water pouring into the oil tank will replace more oil, and the leakage rate is the largest.
4 Conclusions

Fig.32 Volume fraction of remaining oil in the tank under different wave directions
In this study, based on the reasonable simpli⁃fication of the oil leakage model for oil tankers in waves, the CFD module of ANSYS software is ap⁃plied to simulate the leakage from the bottom hole of an oil tank in waves and the leakage from the side hole of the oil tank in waves.The conclusions drawn are as follows:
(1)The validity of the numerical model was verified by comparing the simulation of oil leakage in calm water with the experiment. With the numerical wave tank established, the numerical wave approaches the target wave.
(2) The influence of wave height and wavelength on the leakage from the damaged hole at the bottom of the rolling tank was analyzed.The increase of wave height increases the instantaneous oil leakage rate and total oil leakage. With the increase of wavelength, it is found that for the oil tank with the damaged hole at the bottom,the mass flow rate and the oil leakage at the damaged hole are related to the heave motion and that the more intense the heave motion is,the larger their value be⁃comes.
(3) The influence of wave direction on the leakage from the damaged hole was analyzed. Com⁃pared with the damaged hole facing away from the incident wave, the leakage is larger when the damaged hole is facing the incident wave. Because of density flow, the leakage from the sidewall is severer than that from the bottom.In addition,when the damaged hole is on the side,the leakage is related to the rolling motion.
However,only the influence of external waves on the leakage of the oil tank is presented in this paper. When only two degrees of freedom are released, there is a certain gap with the actual situa⁃tion. A follow-up study will be carried out on the law of oil leakage from the underwater damaged hole of a completely free tank in waves.
杂志排行
船舶力学的其它文章
- Study on the Loads of Connectors for a RMRC Hexagon Enclosed Platform Model in Waves
- Numerical Simulation of Semisubmersible Accommodation Platform Going Alongside FPSO Under the Control of Dynamic Positioning System
- Dynamic Response of Shipbuilding Sandwich Plates with Functionally Graded Soft Core Subjected to Impulse Loading
- Dynamic Response Analysis of a New Semi-submersible Offshore Wind Turbine Based on Aerodynamic-Hydrodynamic Coupling
- Investigations on the Quasi-static Stability Behavior of an Innovative Subsurface Tension Leg Platform in Ultra-Deep Water(Part II)
- Ship Local Path Planning Based on Improved Q-Learning
