Seismic performance evaluation of VCFPB isolated storage tank using real-time hybrid simulation
2022-04-15HongYueTangZhenyunLiZhenbaoandDuXiuli
Hong Yue , , Tang Zhenyun‡, Li Zhenbao§ and Du Xiuli§
1. The Key Laboratory of Urban Security and Disaster Engineering, Ministry of Education, Beijing University of Technology, Beijing 100124, China
2. Daxing District Commission of Housing and Urban-Rural Development , Beijing 102600, China
Abstract: Variable curvature friction pendulum bearings (VCFPB) effectively reduce the dynamic response of storage tanks induced by earthquakes. Shaking table testing is used to assess the seismic performance of VCFPB isolated storage tanks. However, the vertical pressure and friction coefficient of the scaled VCFPB in the shaking table tests cannot match the equivalent values of these parameters in the prototype. To avoid this drawback, a real-time hybrid simulation (RTHS) test was developed. Using RTHS testing, a 1/8 scaled tank isolated by VCFPB was tested. The experimental results showed that the displacement dynamic magnification factor of VCFPB, peak reduction factors of the acceleration, shear force, and overturning moment at bottom of the tank, were negative exponential functions of the ratio of peak ground acceleration (PGA) and friction coefficient. The peak reduction factors of displacement, acceleration, force and overturning moment, which were obtained from the experimental results, are compared with those calculated by the Housner model. It can be concluded that the Housner model is applicable in estimation of the acceleration, shear force, and overturning moment of liquid storage tank, but not for the sliding displacement of VCFPBs.
Keywords: liquid storage tank; base isolation; variable curvature friction pendulum bearing; seismic performance; realtime hybrid simulation test
1 Introduction
Liquid storage tanks are important energy storage systems. Due to their low cost and large-storage capacity, they are extensively used for the storage of petroleum, liquefied natural gas, liquefied hydrogen, and other liquefied gases. However, once an earthquake occurs, the following failure modes may be generated: a) elephant foot buckling caused by local instability of the tank′s wall due to combined action of axial and horizontal shear forces, b) roof damage due to liquid sloshing, and c) crack damage at the joint of the tank′s wall attributed to lift-off of the bottom of tank (Uras and Liu, 1990). These types of failure not only disrupt the essential infrastructure but may also cause fires or environmental contamination. Base isolation (Xueet al., 2019) is a commonly used technology to ensure the seismic safety of storage tanks. Shrimali and Jangid (2002a, b) studied the seismic response of liquid storage tanks isolated by lead-rubber bearings (LRB). However, unlike other engineering structures, the mass of the storage tank varies during its operation, which may result in a time-varying frequency of the isolated system and could lead to inability of the system to mitigate the seismic activity. To guarantee the isolation performance, the use of friction pendulum bearing (FPB) is used in storage tank isolation because its frequency is irrelevant to the mass of the isolated structures (Zayaset al., 1990). Considerable theoretical and experimental research has been carried out on FPB isolated tanks.
In theoretical research, Zayas proposed the first FPB for seismic isolation. Its isolation performance is not sensitive to the mass of the isolated structure, which is tailored for the variable liquid mass during operations of tanks (Zhanget al., 2011). Due to this benefit, FPB has been used in many major engineering projects in recent decades (Yuanet al., 2012; Llera and José, 2010; Castaldoet al., 2018). By analyzing the stress state of an isolated tank, Wang (2001), Seleemah and El-Sharkawy (2011), and Jadhav (2006), found that the isolator can effectively reduce the impulse component and hydrodynamic pressure of liquid during an earthquake. However, it was also shown that the isolator had a minor effect on the sloshing component. Obviously, the main reason for the unsatisfactory effect of FPB on components of liquid sloshing is attributed to the fact that the radius of the FPB and isolation period are fixed. Therefore, in addition to the application of baffles (Maleki, 2007) and inertial system (Haoet al., 2016), to improve the control effect of FPB on liquid sloshing, Shrimali and Jangid (2003) changed the shape of the FPB, and a variable curvature friction pendulum bearing (VCFPB) was proposed. The curvature of the slideway of the VCFPB varied at different locations so that the period of the isolation system can be adjusted according to the sliding displacement of the VCFPB. In this respect, the sloshing components of liquid can be controlled. According to Panchal (2008; 2012), FPBs and VCFPBs were used to isolate the storage tanks, and it was found that the isolation effect of the VCFPB was better than that of the FPB. Due to this advantage, the applications of the VCFPB in tank isolation had attracted considerable attention.
In terms of experimental research, Chalhoub (1990) first carried out shaking table tests on an isolation tank that verified that the hydrodynamic pressure could be reduced. Kim (1995) carried out substructure tests (Nakashima, 1992) for an isolated storage tank. According to the Housner (1957) model, the storage tank was simplified as a spring–mass model and was used as a numerical substructure. A rubber cushion was used as a physical substructure to carry out a substructural pseudo-dynamic test that showed the superiority of the test method for the study of the tank′s isolation.
The theoretical model used in the above numerical analysis, including the simplified Housner model, Haroun–Housner model (Haroun, 1983), and other spring–mass models (Haroun and Ellaithy, 1985; Veletsos and Tang, 1987; Haroun, 1992), are very convenient for the design and analysis of isolated storage tanks due to its low-calculation cost. However, the description accuracies of these models for the dynamic characteristics of liquid storage tanks in isolated systems have not been adequately verified through tests. This is attributed to the fact that the reported experimental research is mainly based on large-scaled shaking table tests. The mass of the specimen is often insufficient, and the vertical pressure and friction coefficient of the scaled isolator cannot match those of the prototype. Therefore, the test results cannot truly reflect the seismic performance of the isolated liquid storage tank. To overcome the shortcomings of the existing test methods, and fully consider the nonlinearity of the isolator and liquid storage tank in the test, a real-time hybrid simulation (RTHS) (Chenet al., 2019; Zhuet al., 2019) was developed to enhance the testing capacity to serve the storage tank isolated by a VCFPB. A scaled tank with a depth-to-length ratio of 0.2 was isolated by VCFPB and was tested with the RTHS testing method. First, a compression–shear test was carried out to quantify the mechanical properties of the isolator, and an accurate numerical model was established for the tested VCFPB. The RTHS was then carried out in which the storage tank was considered as a physical substructure for the physical test, and the VCFPB was considered as a numerical substructure for numerical simulations based on the model established by the compression–shear test. Thus, the drawbacks in large-scaled shaking table test were avoided. Therefore, the isolation performance of the VCFPB on liquid storage tanks and the effectiveness of the Housner model in tank design are discussed, based on the RTHS testing method.
2 Establishment of a real-time hybrid simulation system
Due to the large size of civil engineering structures and the limited testing capacity, only scaled specimens can be used in shaking table tests. However, the mass of the scaled specimens is often insufficient. In conventional shaking table tests, the acceleration input to the shaking table is artificially amplified to offset insufficient mass. In this respect, the seismic performance can be emulated in the horizontal direction, but the effect of compression loading in the vertical direction is neglected. Specifically, in base isolation systems, the horizontal stiffness of the isolation layer is closely related to compression loading. For example, in a VCFPB-isolated system, the scaled specimen will subject the VCFPB to a much smaller pressure during the test when compared to the desired values. In this case, the surface pressure and friction force are both smaller than their designed values. This results in considerable differences in the dynamic characteristics of the VCFPB. Therefore, the scaled test results cannot exactly reflect the seismic performance of the isolated storage tank with VCFPB.
To reduce the influence of insufficient mass on the test, many structural laboratories have developed advanced, large-scale, compression–shear test equipment, and have carried out multiple large-scale or full-scale tests on mechanical properties of components. However, large-scale compression–shear test can only study the restoring or damping force performance of structural components but cannot analyze the dynamic responses of the entire structure. To assess the dynamic performance of the entire structure, RTHS test technology has been rapidly developed over the past 30 years. One part of the entire structure, which could easily be modelled, was numerically simulated, while the remaining parts were studied experimentally. The physical substructure and numerical model exchange information in real-time, allowing the test to proceed as if the system was a whole. The successful implementation of the RTHS test is dependent on the accuracy of the numerical substructure model. Therefore, this study combined the compression–shear test with the shaking table test and developed a RTHS test. The nonlinear responses of the VCFPB and the liquid storage tank were both considered by the new RTHS test, which can solve the insufficient mass problem in the scaled model test of isolated structures.
The use of the RTHS test for seismic performance tests of storage tanks, isolated by VCFPBs, is shown in Fig. 1. Two steps are used for the execution of the RTHS test. In Step 1, a fast compression–shear test needs to be carried out to capture the nonlinearity of the VCFPB and calibrate the numerical model of VCFPB. In this step, the pressure, which is generated by the storage tank, can be applied on the VCFPB by an electrohydraulic servo loading system. Accordingly, it is no longer limited by the scaled model with insufficient mass, thus eliminating the effect of the insufficient mass on the assessment of the mechanical properties of the VCFPB. According to the experimental data obtained from the compression–shear test in Step 1, an accurate numerical model was built that describes the mechanical properties of the VCFPB. In Step 2, a RTHS test was conducted. The tank was used as a physical substructure for the shaking table test, and the VCFPB model established in Step 1 was used as a numerical substructure for the simulations. The displacement of the VCFPB and the reaction force produced by the liquid tank interacted in real-time to complete the overall dynamic test of the isolation tank with the VCFPB. In the RTHS test, the insufficient vertical loading in the scaled model can be simulated in Step 2. Furthermore, it can also be considered in Step 2 through numerical substructures so that the adverse effects attributed to insufficient mass in the shaking table test can be avoided.
In Fig. 1,MiandCi, respectively, represent the mass and damping of the VCFPB. Additionally,Pandf, respectively, represent the gravity and shear received from the upper tank, andVandD, respectively, represent the restoring force and slip displacement of the VCFPB itself. Theaeqrepresents the acceleration of the earthquake.
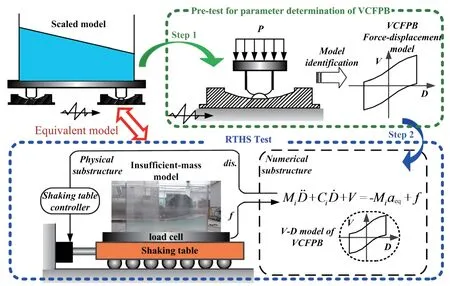
Fig. 1 Real-time hybrid simulation (RTHS) test system for the base-isolated storage tank
3 Calibration of numerical VCFPB model
In this study, a storage tank with a volume of 327.68 m3was adopted. Based on this prototype, a model at the scale of 1: 8 was tested. The parameters of the prototype and scaled model are presented in Table 1.

Table 1 Parameters of the tested liquid storage tank and scaled model
As mentioned above, the FPB cannot easily reduce the long period response which was caused by liquid sloshing. In this study, the VCFPB was used to decrease the earthquake input to the liquid storage tanks. The modified arc surface proposed by Tsaiet al. (2003) was chosen as the slideway form of the VCFPB. The VCFPB had a variable frequency and a shear softening function. The constructed form of the VCFPB was a double-sided orthogonal beam, as proposed by Roussis (2006). As shown in Fig. 2(a), this form of the VCFPB can provide pull-out resistance, which can still produce a better isolation performance after the uplifting of the tank. Similar to traditional FPB, the VCFPB also uses Teflon and steel as friction materials. The equation which describes friction of the surface is formulated by Eq. (1).
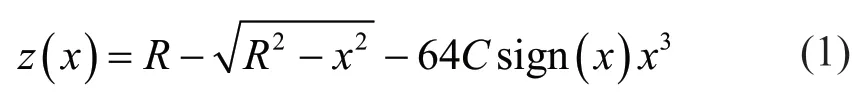
In Eq. (1),Ris the initial radius of the VCFPB,xis the sliding displacement of the VCFPB, andCis the parameter that describes the variation of curvature of the concave surface. WhenCis reduced to zero, the VCFPB will degenerate to the FPB. WhenCincreases, the slope of the slideway away from the initial position decreases, and the shear softening ability becomes more obvious.
The mechanical principle of the VCFPB is shown in Fig. 2(b). According to the balance equation in then-tdirection and the equation for friction, the horizontal forceVof the VCFPB can be obtained as shown in Eq. (2). In the equation,Vis the sum of restoring forceFrand friction forceFμ,Wis the total weight of the upper structure, andμis the friction coefficient of the VCFPB.
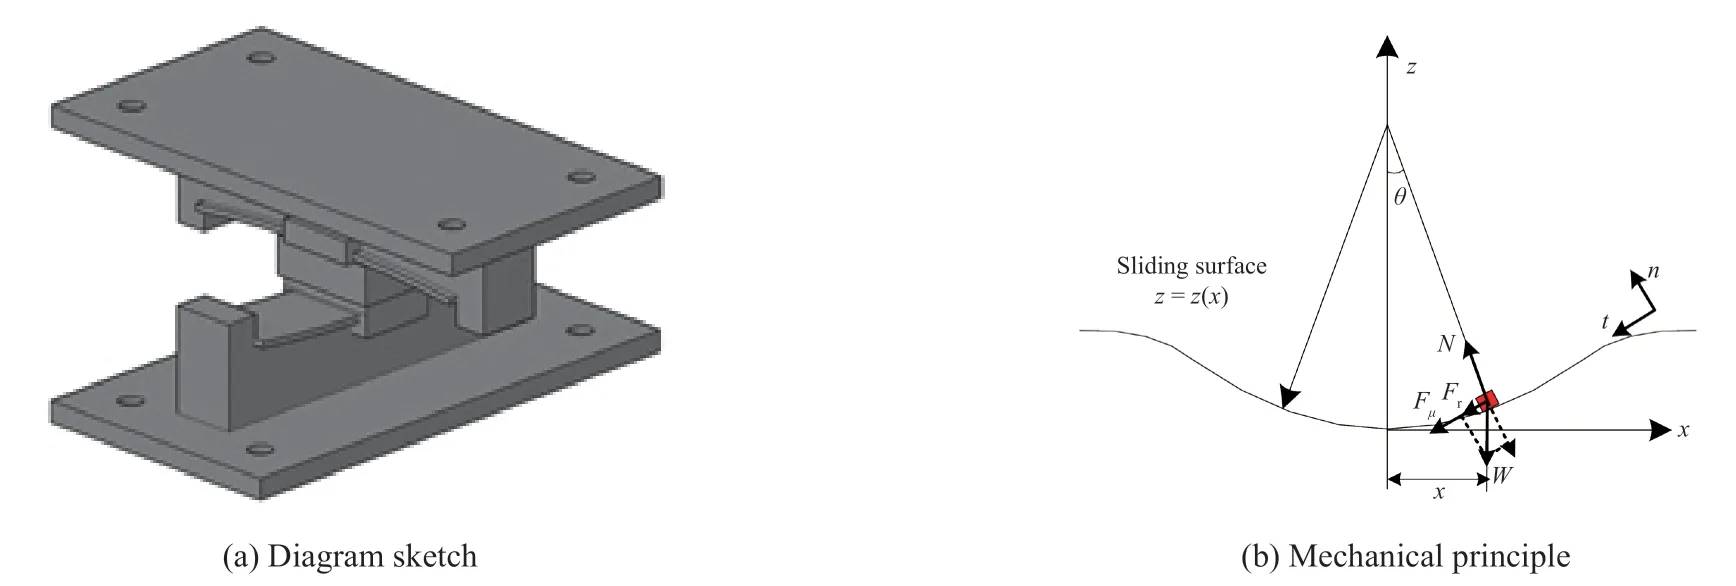
Fig. 2 Variable curvature friction pendulum bearing (VCFPB)
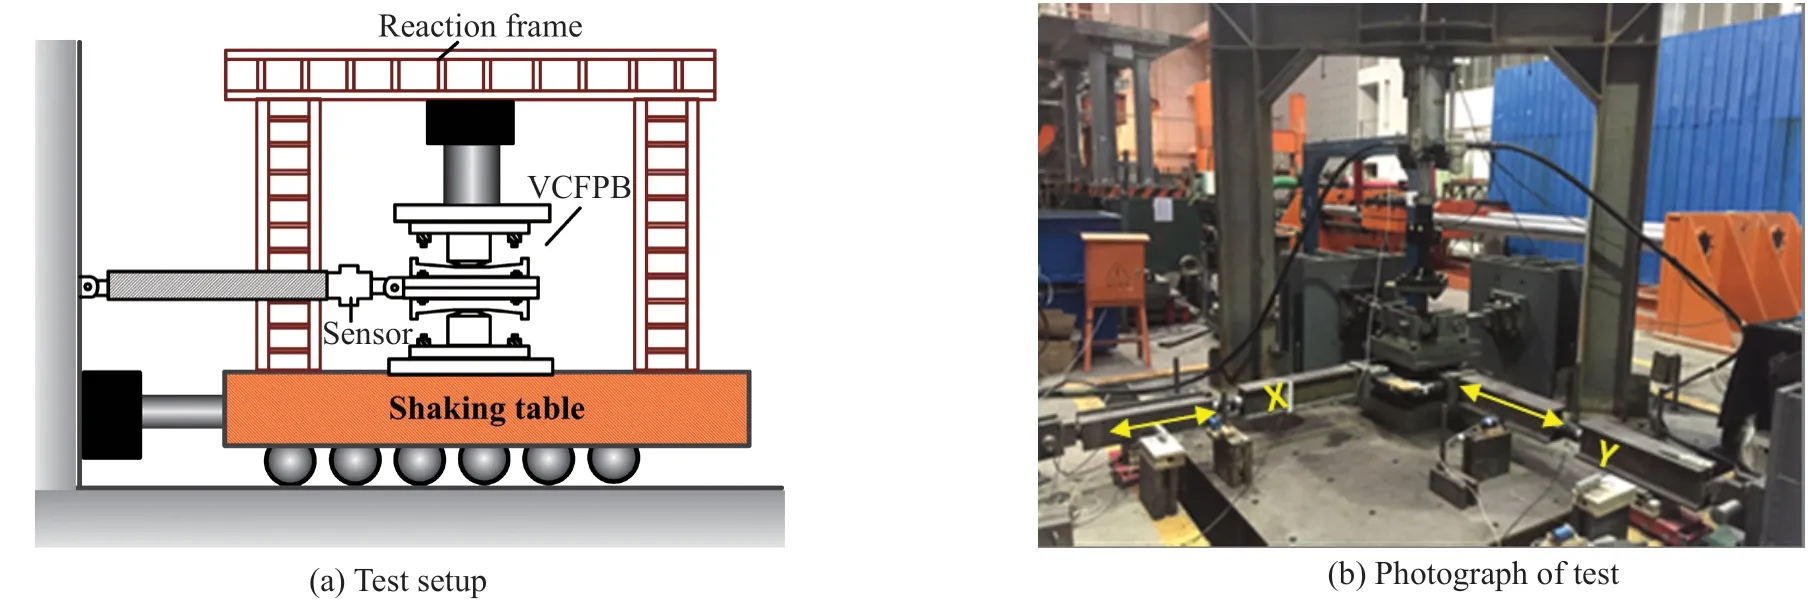
Fig. 3 Compression–shear test of the VCFPB

It has been verified that an isolator with a frequency of 0.3–0.5 Hz has the best effect (Joaquínet al., 2010). Therefore, the initial isolation frequency of the prototype tank, which was isolated by the VCFPB, was set to 0.4 Hz. Considering the energy dissipation and self-reset ability of the VCFPB, the friction coefficient of VCFPB was set to 0.05. Due to the deformation restriction, the allowable displacement of the isolator was set to 450 mm. The curvature influence coefficientCwas chosen to be 0.4 according to the softening effect. A model at the scale of 1:8 was selected for the test. In addition, the parameters of the full-scale and the VCFPB model at the scale of 1:8 are shown in Table 2.
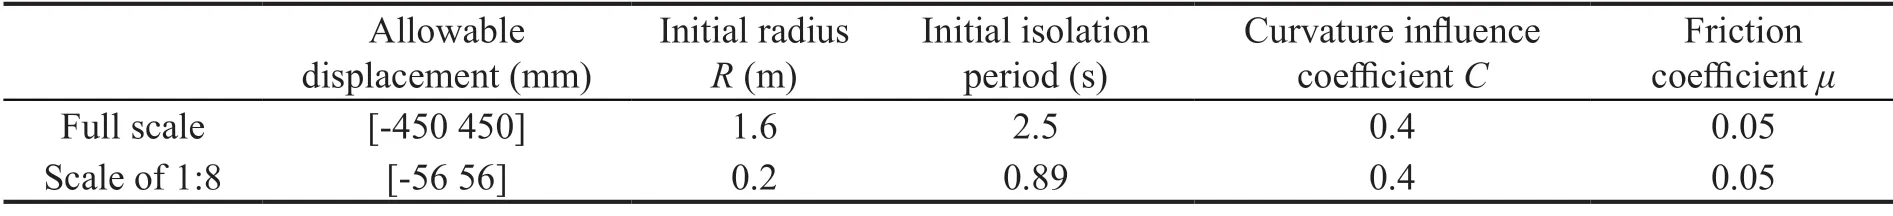
Table 2 Parameters of VCFPB at the full-scale and at 1:8 scale
To successfully carry out the VCFPB compression–shear test, constant vertical pressure and cyclical loading should be applied simultaneously. The loading device was designed as shown in Fig. 3(a), and consisted of a reaction frame, an electrohydraulic servo control actuator, two horizontal rigid connecting rods, and a shaking table. The reaction frame was fixed on the shaking table, and the horizontal rigid rod was fixed on the reaction floor outside the shaking table. For convenience, two VCFPBs with the same performance characteristics were designed and tested in parallel. In the experiment, two VCFPBs were stacked together. The vertical actuator acted on the top of the upper VCFPB, and the bottom of the lower VCFPB was fixed on the shaking table. The two VCFPBs were connected with two rigid rods in theXandYdirections, respectively. The rigid rods in theXdirection provided a reaction force, and the rigid rods in theYdirection kept the specimen stable. The slip displacement of VCFPB was applied by the shaking table, and the compression–shear test for the VCFPB was finally realized. A photograph of the test is shown in Fig. 3(b).
Figure 4 shows the plots of variation of displacement of the VCFPB vs. force at different contact pressures excited by a sinusoidal wave with an amplitude of 56 mm and a frequency of 0.01 Hz. Some researchers (Shrimali and Jangid, 2002b) show that the change of friction coefficient caused by the change of loading speed has little effect on the vibration isolation performance. Therefore, the loading rate used in this study is not large. Because the friction coefficient of the VCFPB cannot be determined exactly in the experiment, it is necessary to identify the friction coefficient accurately to describe the experimental results. The identification model of friction coefficient is expressed by Eq. (3) (Tsaiet al., 2003).
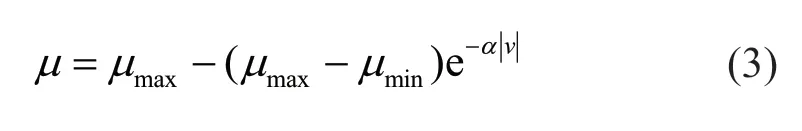
In Eq. (3), the sliding frictionμranges fromμminat very low velocities of sliding, toμmaxat large velocities,vis the velocity of sliding, andαis a constant that controls the variation of the coefficient of friction with velocity.
From the comparison of the two curves in Fig. 4, it can be observed that the identified model almost coincides with the experimental results. Correspondingly, the modelling error of the constitutive model for the VCFPB was reduced, and the experimental accuracy of the entire structural response was improved in the RTHS test. The identification parameters in Eq. (3) are shown in Table 3.
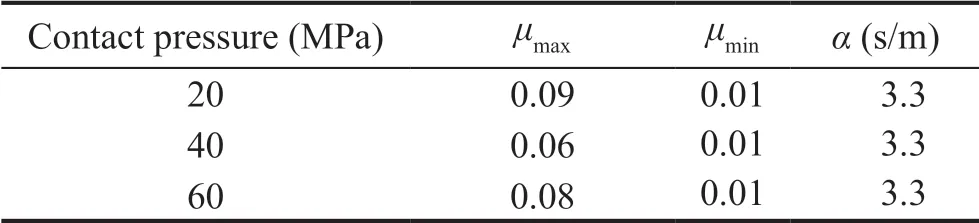
Table 3 Parameters of Eq. (3)
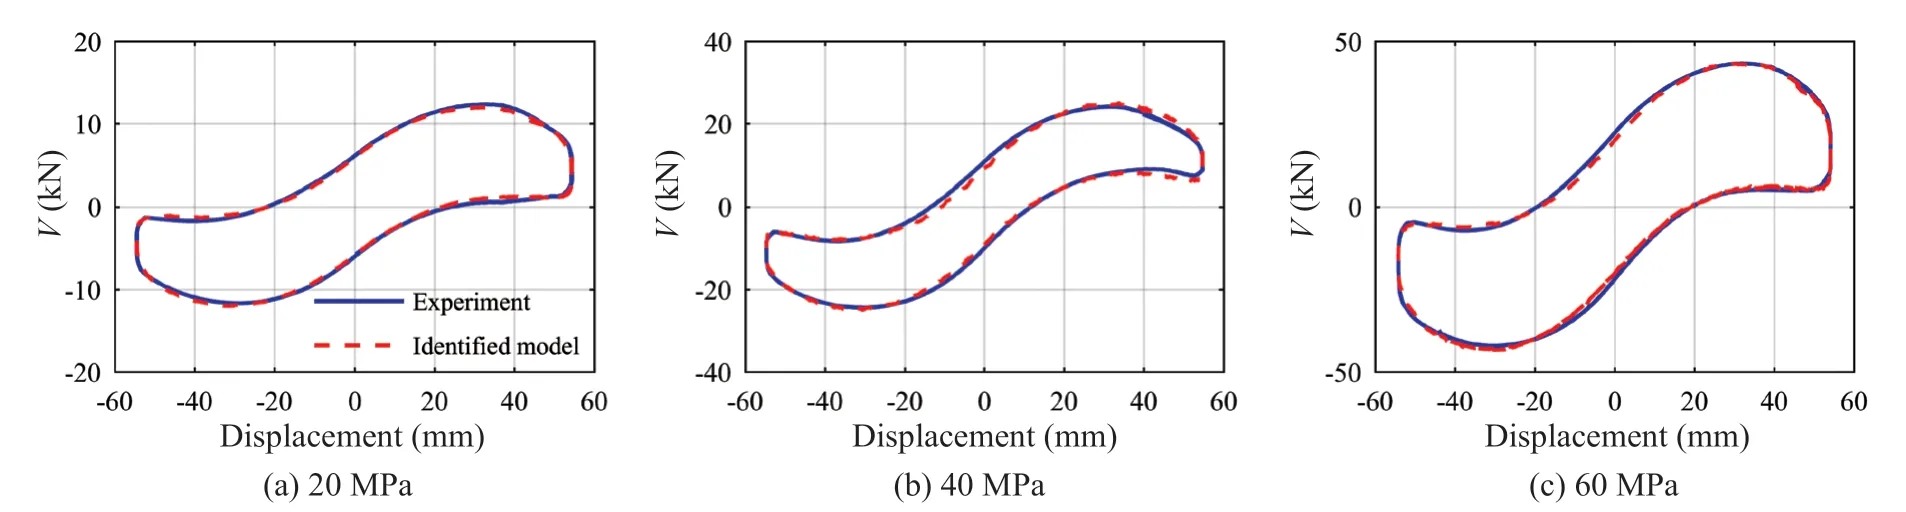
Fig. 4 Plots of displacement vs. shear force of the VCFPB obtained from experiments and the identified model
4 Real-time hybrid simulation test
4.1 Verification of test system
In the previous section, the effect of insufficient mass on the VCFPB was overcome based on a compression–shear test. A high-precision VCFPB numerical model was established by parameter identification based on Eq. (3), and the nonlinear response of VCFPB was accurately described. In this section, the nonlinear responses of liquid storage tanks were tested based on the RTHS. The accurate establishment of numerical substructure model, and the accurate simulation of the boundary conditions are key issues for the execution of the RTHS test. Among them, numerical substructure modelling had been solved in the pre-test. The emphasis on the simulation of the boundary condition was placed on the accurate reproduction of the interface response with the shaking table. Moreover, the authors developed a control strategy to ensure the realization of the boundary through a shaking table; as shown in Fig. 5, an outer loop controller has been designed for the virtual shaking table and run in parallel. The virtual shaking table was compensated by the outer loop controller and the compensated signal is used as the command to control the actual shaking table. The effectiveness had been verified by a large-scale nonlinear RTHS test (Tanget al., 2020). Since the shaking table system used in this study is the same as that used by Tanget al. in 2020, refer to Tanget al. (2020) for details.
The hardware equipment used in this test was a personal computer installed with an Advantech PCI-1716 data acquisition card for data transmission, and the sampling frequency was 1 kHz. In this study, Simulink was used to run the numerical simulation and controller. In other words, the numerical substructure was solved by Simulink, the closed-loop numerical integration method based on Simulink is described by (Honget al., 2017). The solver was the Runge Kutta method (ode45 Solver) with fixed step size of 1ms.
In this section, the feasibility of the RTHS system designed for the VCFPB isolated storage tank testing was further validated by a single-degree-of-freedom RTHS system. The RTHS test system is shown in Fig. 6. In Fig. 6,M,CandK, respectively, represent the mass damping and stiffness, while subscriptNrepresents a numerical substructure andPrepresents a physical substructure. Additionally,dis. andf, respectively, represent the displacement and shear received from the physical substructure. The figure on the left shows the entire structure which had a total mass of 5423 kg, a frequency of 2 Hz, and a damping ratio of 0.05. The figure on the right is the RTHS test model. Part of the total mass (40%) is regarded as a physical substructure, and the remainder was regarded as a numerical substructure.
Usually, the exact overall structural response is difficult to obtain. Thus, it is difficult to determine the source of the RTHS test error. In this single-degree-offreedom system, the dynamic response of the emulated system shown in Fig. 6 can be accurately obtained numerically. The displacement and acceleration responses of the entire structure and the RTHS test are shown in Fig. 7. It can be observed that the response of the RTHS test is in good agreement with the entire structure. This indicates that the RTHS test reproduced the displacement and the acceleration at the interface of the physical and numerical substructures based on the use of the shaking table. These parameters are equally important for simulating the dynamic response of the storage tank in the laboratory.
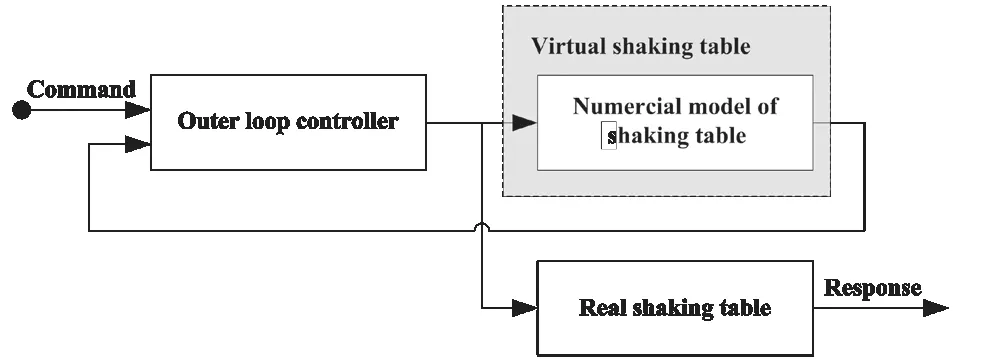
Fig. 5 Inverse dynamics compensation via simulation
4.2 Test cases
To analyze the dynamic characteristics of the storage tank, the white noise identification test was first carried out. According to an analysis of the results, the firstnatural frequency of the tank was 0.47 Hz, and the liquid damping ratio in the tank was approximately 0.005 (long side direction of storage tank).
Due to the low frequency of the storage tank, the damage caused by the ground motion with abundant low-frequency components was more serious. Therefore, four ground motions with relatively low-frequency components were selected as the excitation components to study the isolation performance of VCFPB-isolated storage tank. The time–history and frequency spectral plots of the seismic waves are shown in Fig. 8. One was the El-Centro wave which contained an abundant number of frequencies. Another was the Hachinohe wave which contained abundant frequency components near the first-order frequency of the storage tank, while the other two were typical near-fault waves with prominent pulse components, known as the Northridge and Kobe waves. By changing the amplitude of the peak ground acceleration (PGA), the isolation performance of the storage tanks were analyzed. According to the requirement of the scaled test, the seismic waves were compressed in time, and the time length used in the scaled test wasof the time length of the original wave.
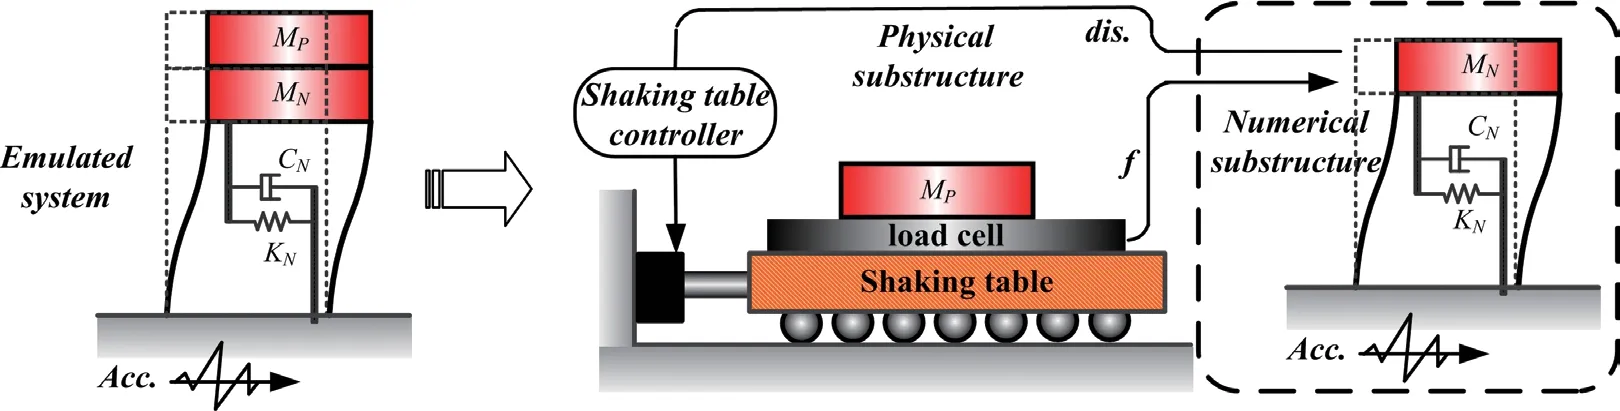
Fig. 6 RTHS for a single degree-of-freedom
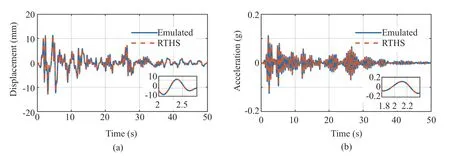
Fig. 7 Comparison of (a) displacement and (b) acceleration measured from the emulated and RTHS testing system excited by an El-Centro wave with a peak ground acceleration (PGA) of 0.05 g
Furthermore, PGA was determined by the displacement limitation of the shaking table used. The specific test cases are listed in Table 4. This is because the seismic performance of the VCFPB isolated tank is dependent on its friction coefficient. To extend the range of the test, more VCFPBs with different friction coefficients were adopted in the RTHS test than in the pre-test. Hence, the friction coefficient used in the RTHS test was not same as the pre-test.
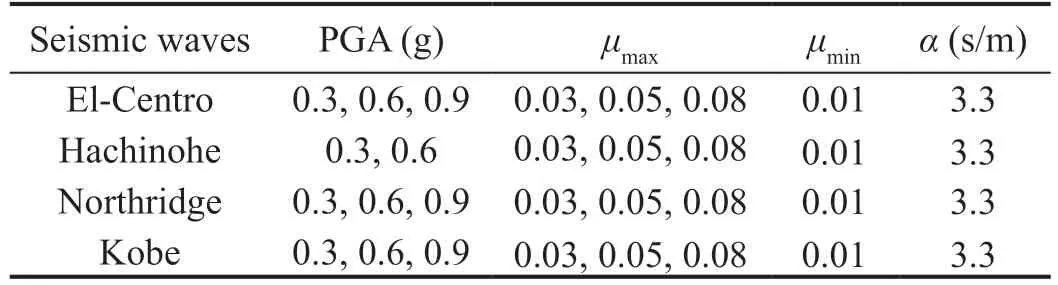
Table 4 Test cases
4.3 Measurement schemes
There are four dynamic responses that control the operation performance of the storage tank when a base isolated storage tank system undergoes an earthquake excitation. The slip displacement of the isolator should not be too large to prevent piping damage. The acceleration and shear force at the bottom part directly affects the compression buckling of the tank wall (elephant foot buckling). The overturning moment caused by the horizontal movement of liquid in the tank will affect the uplift, anchorage failure, and sloshing damage around the roof. Therefore, the slip displacement of the isolator, acceleration input into the tank, shear force, and overturning moment at the bottom of tank, are not only the main indices used to determine the damage, but also represent the main indices used to evaluate the isolation performance. The force diagram and measurement layout of the liquid storage tank are shown in Fig. 9.
To measure the four dynamic responses, the accelerometer was placed on the tank floor, the displacement meter was installed on the shaking table, and four load cells with an upper limit of 5000 kg were arranged between the tank and the shaking table. The accelerometer measured the acceleration response input into the tank after isolation. The base shear force can be acquired by the four 3-axial load cells. Because the force produced by the tank was quite small relative to the measurement range of the installed load cells (four load cells with the capacity of 20000 kg in total), a 2000 kg steel plate was added at the bottom of the tank to improve the measurement accuracy. Its inertial force can be obtained by multiplying the plate′s mass by the acceleration measured on the plate. Therefore, the shear force at the base of the tank can be obtained by subtracting the inertial force of the steel plate from the horizontal forces measured by the four load cells. The overturning momentMcaused by liquid sloshing was balanced by the couples generated by the four vertical forces (v1,v2,v3,v4) measured by four 3-axial load cells, as shown in Fig. 9. When two of the four vertical forces (v1,v2) denote pressure, the other two denote tension (v3,v4). Furthermore, the force arm between them isL. The measured overturning moment can be expressed by Eq. (4). It should be emphasized that the slip displacement of the VCFPB is calculated in the numerical substructure, not measured in the physical substructure.
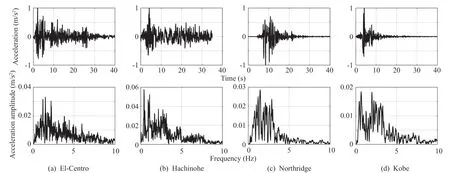
Fig. 8 Time–history and power spectra of the selected seismic waves
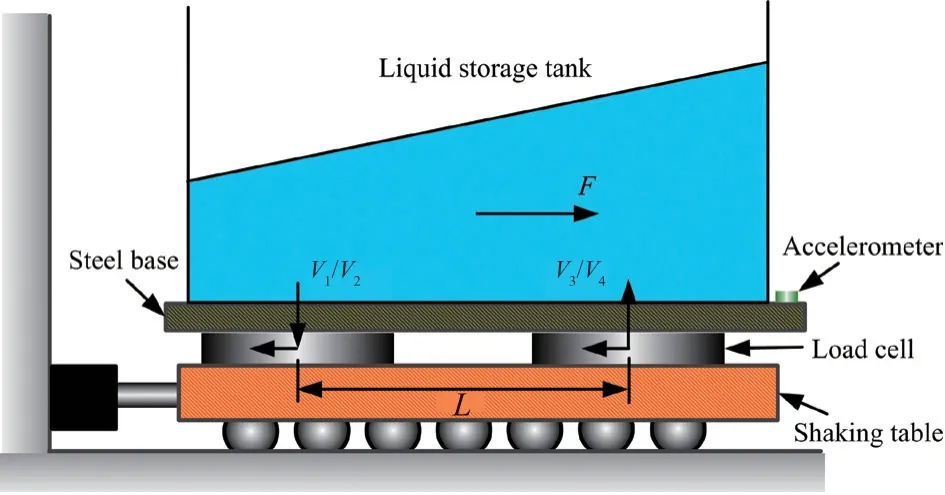
Fig. 9 Force diagram and measurement layout of the liquid storage tank
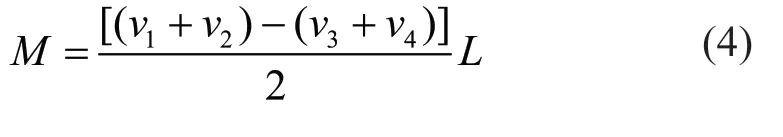

Fig. 10 Scaled model of the VCFPB isolated tank: (a) dimensions and (b) Housner model
5 Experiment results and theoretical analyses
5.1 Establishment of theoretical model
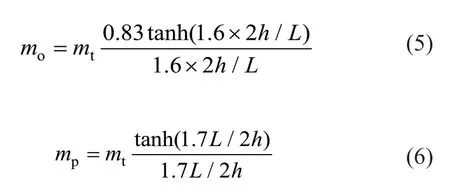
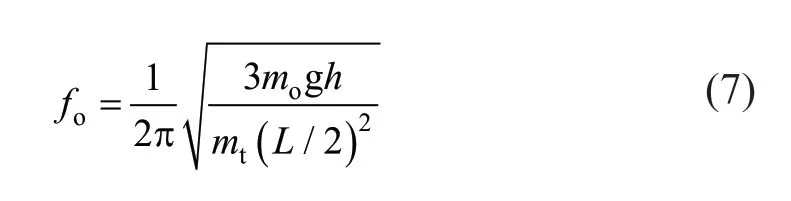
To verify the theoretical method, the Housner model was established, which is a commonly used model in tank design and research. Figure 10(a) shows the rectangular tank model at a scale of 1:8 which is isolated with the use of the VCFPB. Figure 10(b) shows the Housner spring–mass model used in the simulation. The parameters of the 1/8 scaled mode in Table 1 are brought into Eqs. (5)–(7) for calculation, the mass of sloshing represented bym0accounted for 73% of the total liquid weight represented bymt, and the impulsive mass represented bympaccounted for 27%. The frequency of sloshing massfowas 0.47 Hz, and the viscous damping coefficient of the sloshing mass was 0.005. The self-weight of the tank, including the isolation floor and tank shell, was set to 0.6 times of the total liquid weight. The parameters of the VCFPB are listed in Table 2. Therefore, the whole VCFPB isolated tank becomes a two degree of freedom model. The mass of the lower degree of freedom is the sum of the self-weight of the tank and impulsive massmp. The nonlinear model of the VCFPB is used to calculate the shear force of this particle. The mass of the upper degree of freedom is the sloshing massmo. The frequency isfoand the damping isξo. Based on the spring-mass model, the response of the VCFPB isolated tank under seismic excitation can be calculated.
To evaluate the isolation performance of the VCFPB, this study a dopted the peak reduction factor, which was calculated according to Eq. (8).
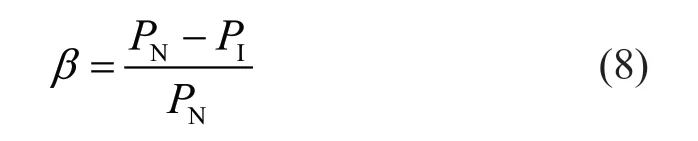
wherePrepresents the peak response of the tank, such as the acceleration input into the tank, shear force at the bottom of the tank, or overturning moment on the tank wall. Subscript I denotes the cases where the VCFPB isolation was used, while subscript N denotes the nonisolated cases. The displacement dynamic magnification factor was used to denote the displacement of the isolator, which is the ratio between the maximum slip displacement of the VCFPB and peak displacement of the seismic wave.
Based on numerical simulation analyses, Wang (2001) concluded that there was a negative exponential relationship between PGA/μmaxand the isolation indices, as indicated by Eq. (9), such as the slip displacement of the VCFPB, acceleration, shear force, and the overturning moment on the tank.
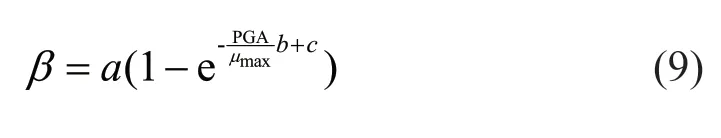
wherea,b, andcare the parameters which need to be determined. This study also considered PGA/μmaxas a variable to summarize results of the experimental tests and simulations. Herein, this relationship was employed to describe the isolation performance of the VCFPB isolated storage tank with the VCFPB at different PGA/μmaxvalues.
Therefore, in the comparison of the results, the ratio between the peak ground acceleration and the VCFPB friction coefficient (PGA/μmax) was considered as the definition of index in this study.
5.2 Acceleration response input into the tank
5.2.1 RTHS testing results
The acceleration response input into the tank is the most intuitive expression of isolation performance. Figure 11 shows the acceleration–time history of the isolator at different friction coefficients for VCFPB excited by the El-Centro wave with a PGA of 0.6 g. Compared with the tank without isolation represented by N-I, all the VCFPBs yielded good isolation performance at different friction coefficients. Note that smaller friction coefficients yield better VCFPB isolation performance. Figure 12 indicates the corresponding relationship between the peak reduction factor of acceleration and PGA/μmaxsubject to the excitation of four seismic waves at different PGA values. Due to the limitation of the displacement capacity of the shaking table, only 0.6 g can be achieved for the Hachinohe wave. Thus, there are only six test cases under the excitation of the Hachinohe wave. Figure 12 shows that for the same excitation, the isolation performance of the VCFPB increases rapidly at first, and then slows down gradually as PGA/μmaxincreases. This means that an upper isolation performance boundary exists in the isolated storage tank with the VCFPB following the increase of PGA or decrease ofμmax.
5.2.2 Comparison of RTHS testing and numerical simulation
To study the influence of different ground motions on the VCFPB based tank, and to verify the accuracy of the Housner model, the maximal peak reduction factor of the test and average error between the simulation and the test under different ground motions are listed in the Table 5. In the table, the maximal peak reduction factor of the test is determined by comparing all test results under the same seismic excitation. The average error between the simulation and the test is the difference between the average value of the test results and that of the simulation results under the same earthquake excitation.
A comparison of the isolation performance of the VCFPB at different ground motions yields a maximum difference of approximately 20%. The VCFPB yielded the best isolation performance in the case of the Kobe wave. Additionally, the Kobe wave had the most obvious acceleration impulse component among the four waves. This shows that the VCFPB has a better isolation performance for earthquakes with strong acceleration impulses. The peak reduction factor of the acceleration and fitted curves were obtained based on theoretical analyses, as shown in Fig. 12. Compared with the experimental results, there were simulation errors which ranged between 5%–20% according to the Housner model.
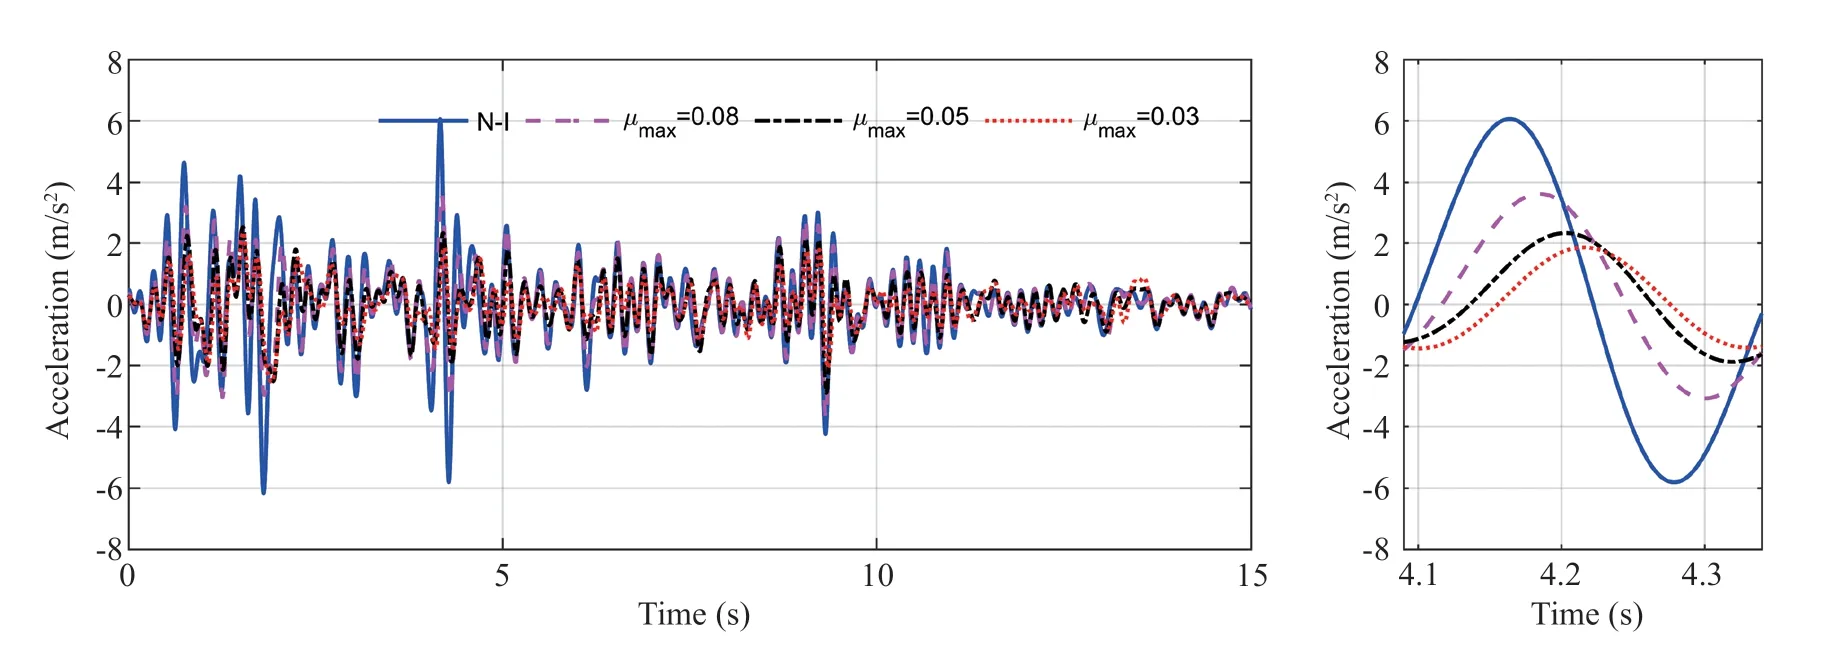
Fig. 11 Acceleration–time history of the isolator at different friction coefficients for the VCFPB excited by the El-Centro wave with a PGA of 0.6 g
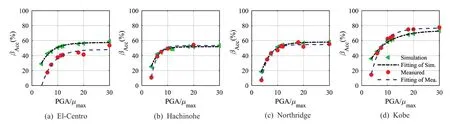
Fig. 12 Peak acceleration reduction factor for the VCFPB at different PGA/μmax
Based on the excitation of the four seismic waves, the peak reduction factor of acceleration, shear force, and overturning moment of the tank were all suitable in the case of Eq. (9). Using the least squares method, the experimental data are substituted into Eq. (9) for parameter fitting, and the results shown in Table 6 were obtained. Accordingly, the values of the parametersa,b, andc, in Eq. (9) are listed in Table 6. The data in Table 6 are experimental data, and the data within parentheses are simulated data. The identified parameters listed in Table 6 reflect the seismic performance of the storage tank which was isolated by the VCFPB. The results show that seismic performance of the VCFPB isolated tank is not only related to the parameters of the VCFPB, but also the characteristics of ground motion. Moreover, the Housner model can describe the experimental results with an applicable accuracy for different acceleration response inputs into the tank, shear force, and overturning moment response, at the bottom of the tank.
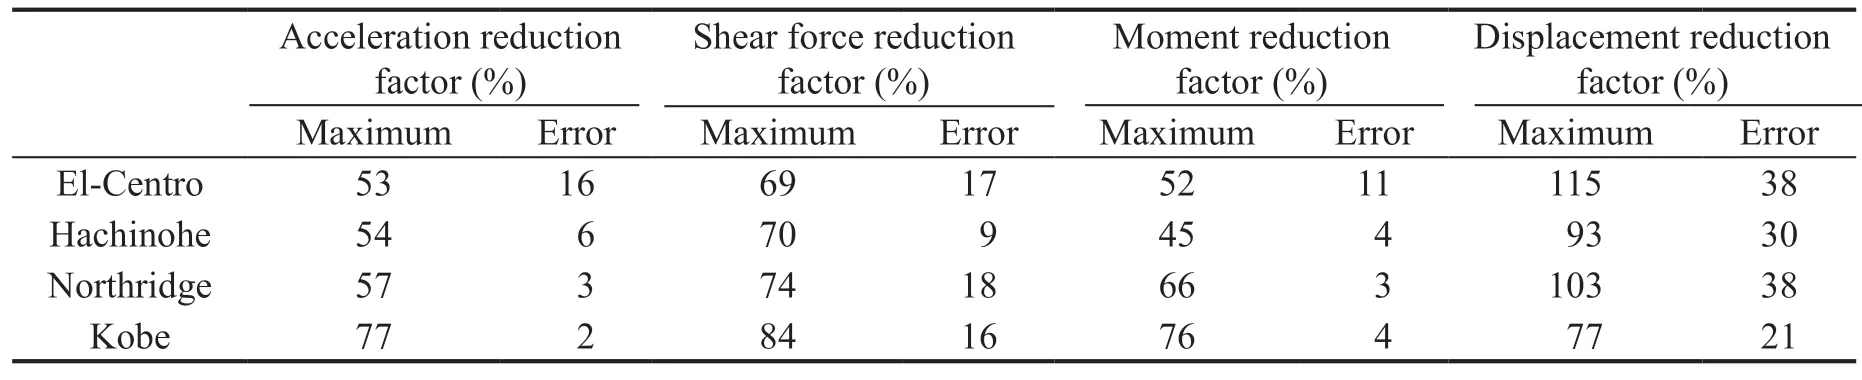
Table 5 Maximal peak reduction factor of test and average error between simulation and test
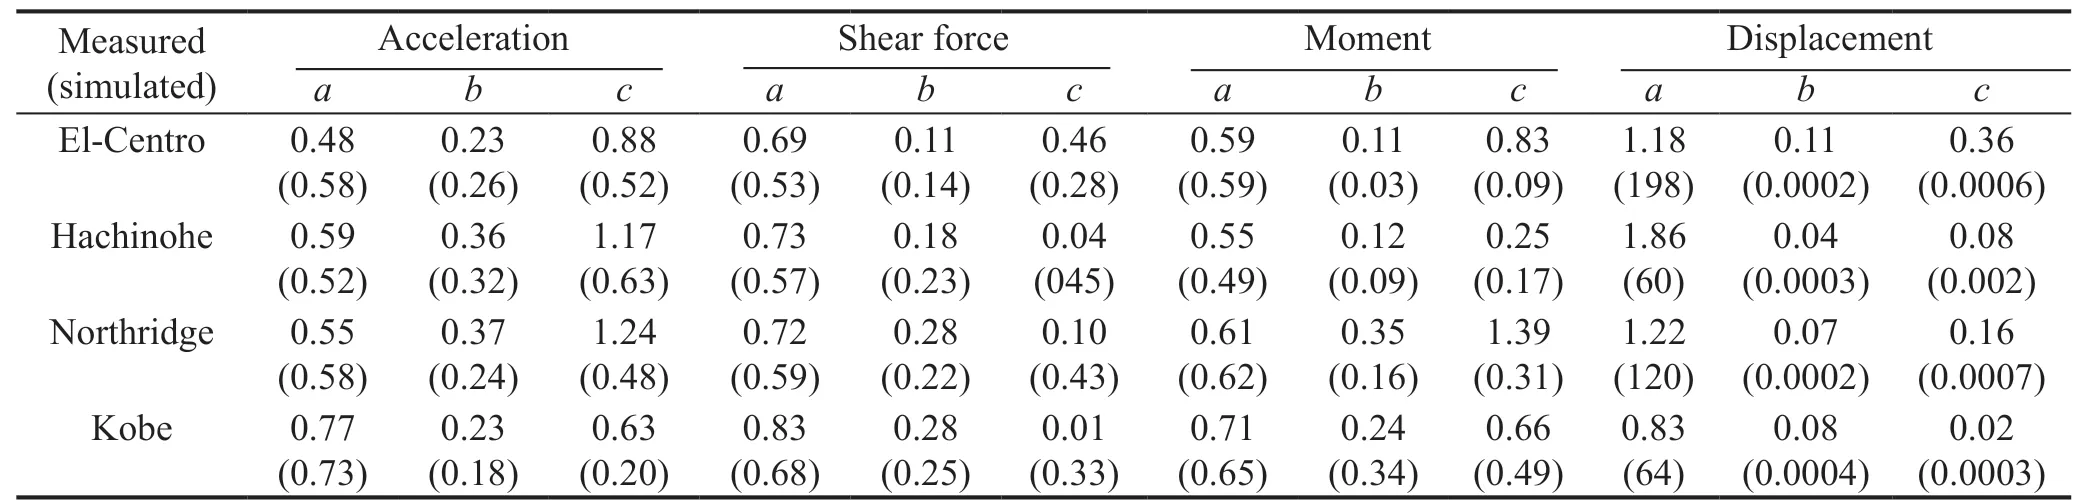
Table 6 Parameters of Eq. (9) estimated from the measured and simulated responses
5.3 Shear force response at the bottom of the tank
5.3.1 RTHS testing results
The shear force at the bottom of the tank includes impulse pressure and liquid sloshing pressure of the liquid. Therefore, the shear force can intuitively evaluate the overall dynamic response of the liquid in the tank to some extent. The shear force–time histories of the storage tank based on the excitation with the El-Centro wave with a PGA of 0.9 g are shown in Fig. 13(a). In the first 10 s, the excitation was strong, and VCFPB yielded a good isolation performance. However, after 10 s, the time history of the shear force yielded a low-frequency component, which was not significantly reduced by the VCFPB. The shear force–frequency spectrum shown in Fig. 13(b) also proves that the VCFPB yields a good isolation performance on high-frequency components of ground motion, but minor effects are observed on the lowfrequency components. The time–frequency analysis of the shear force plotted in Fig. 13(c) indicates that the frequency spectrum of the shear force is consistent with the ground motion during first 10 s. However, after 10 s, the frequency components of liquid sloshing gradually appeared and became the main components. The results demonstrated that the tank isolated by the VCFPB was effective for high-frequency components of ground motions, but was less effective for low-frequency components excited by liquid sloshing. The relationship between the isolation performance for shear force and PGA/μmaxis shown in Fig. 14. Similar to acceleration, the law of shear force isolation is also suitable for Eq. (9). With the increase of PGA/μmax, the isolation performance of VCFPB increases rapidly at first and then slows down gradually.
5.3.2 Comparison of RTHS testing and numerical simulation
Similar to the experimental results, the simulation results also increase rapidly at first, and then slow down gradually as PGA/μmaxincreases. Comparison of the isolation performance of test for the shear force at different ground motions indicates that the maximum difference is more than 10%. The simulation test also shows that the results were related to the dynamic characteristics of ground motion. Additionally, Fig. 14 and the data summarized in Table 5 show that there are errors in the range of 5%–20%, as calculated by the Housner model. Moreover, different from the acceleration, in all cases, the simulation results of the shear force are less than that of the test, which means that the shear force of the tank is relatively underestimated by Housner model.
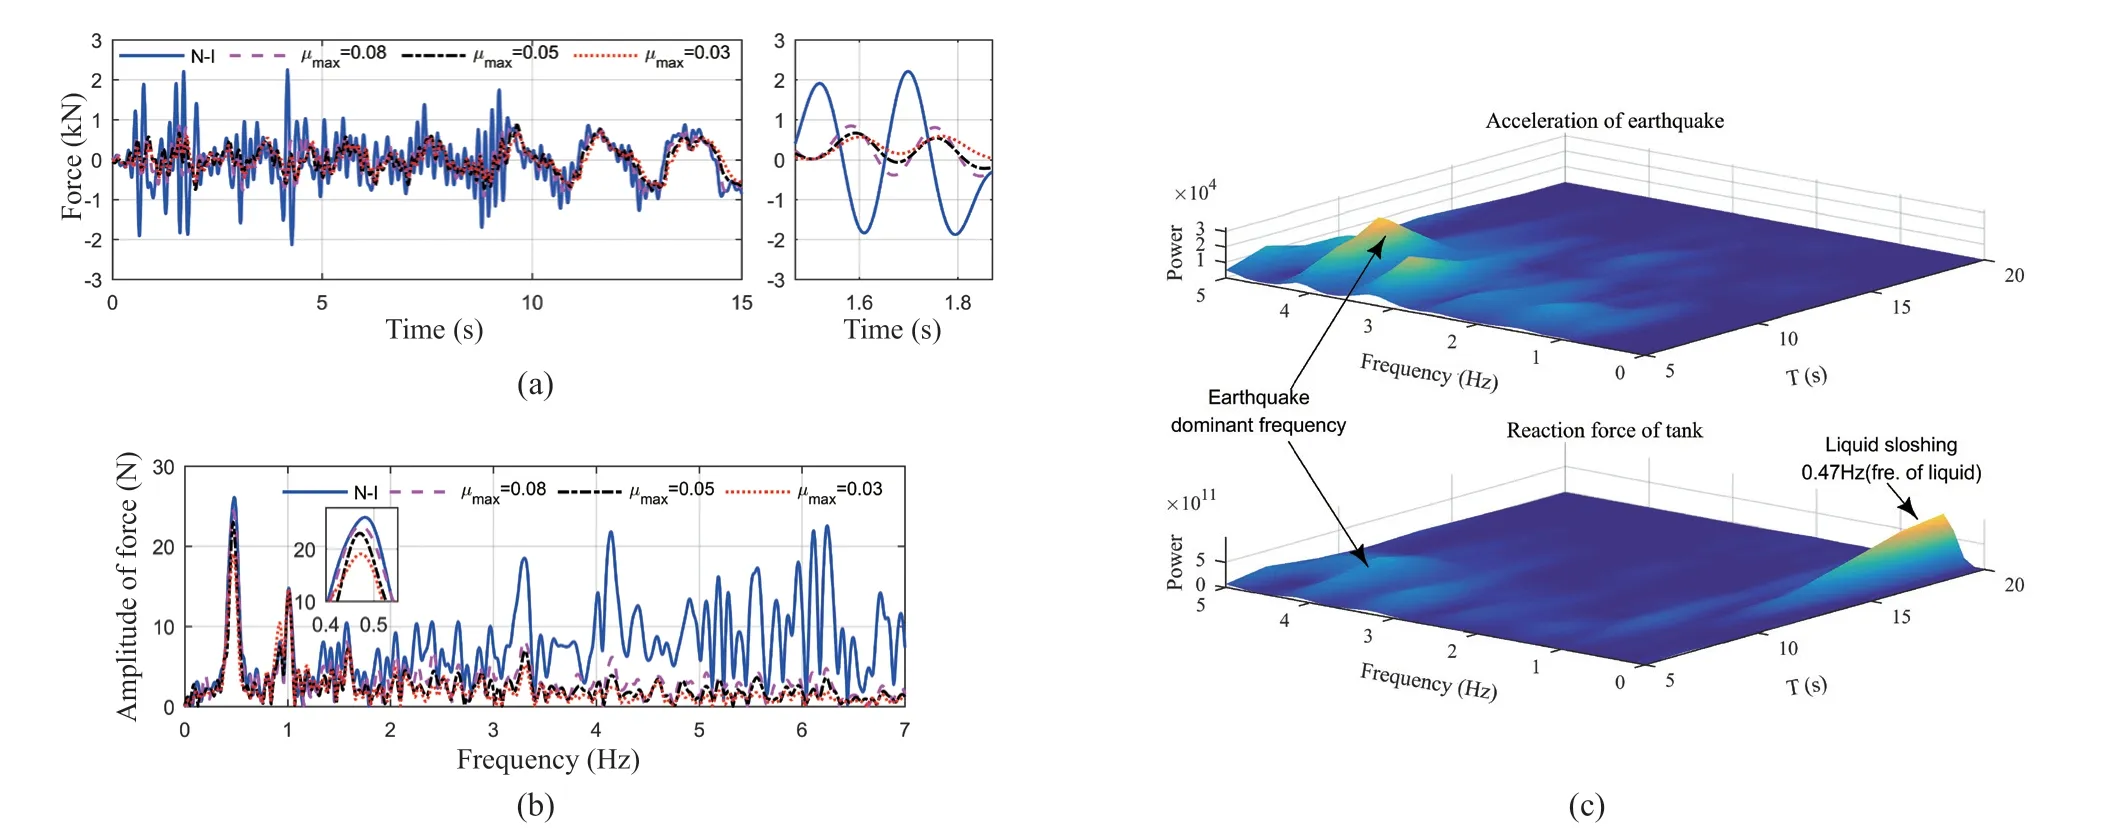
Fig. 13 (a) Shear force–time history of tank, (b) shear force–frequency spectrum, and (c) time–frequency spectrum of seismic wave and shear force excited by the El-Centro wave with a PGA of 0.9 g
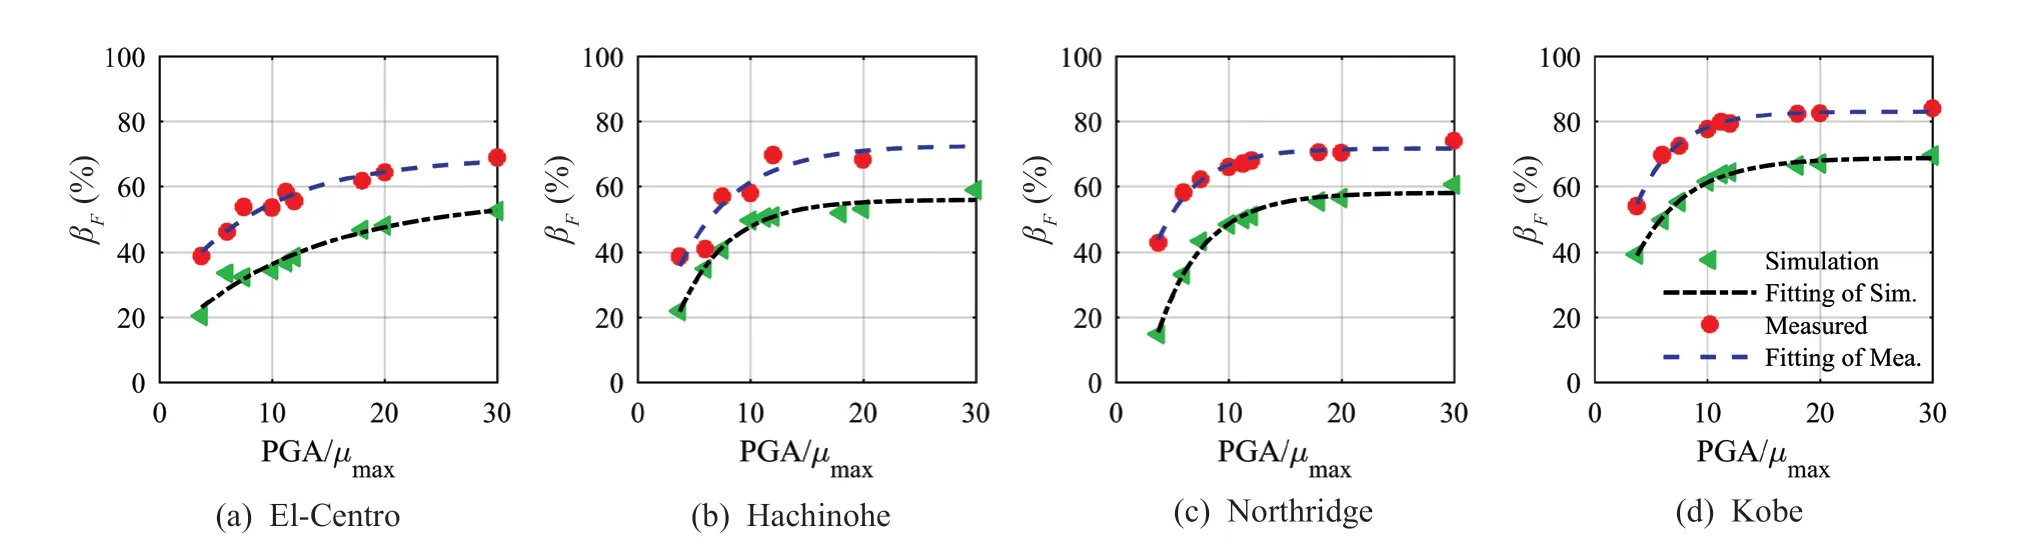
Fig. 14 Peak shear force reduction factor for VCFPB at different PGA/μmax
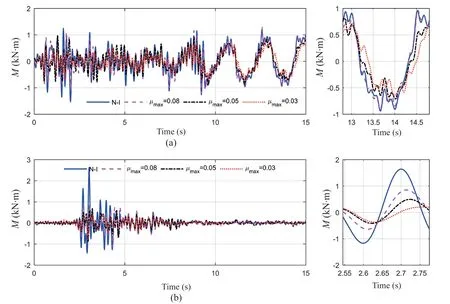
Fig. 15 Moment time–histories of tank at different friction coefficients for the VCFPB excited by El-Centro wave with a PGA of 0.9 g, and with the Kobe wave with a PGA of 0.9 g
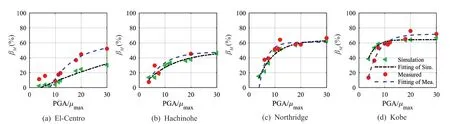
Fig. 16 Peak moment reduction factor for the VCFPB at different PGA/μmax
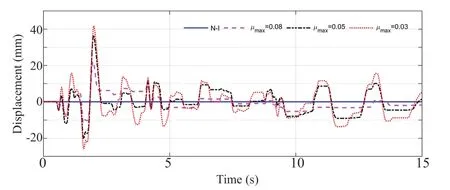
Fig. 17 Displacement–time histories of the VCFPB at different friction coefficients excited by the El-Centro wave with a PGA of 0.9 g
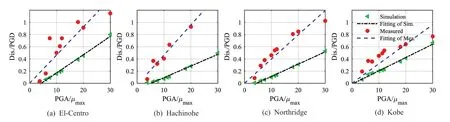
Fig. 18 Displacement dynamic magnification factor of the VCFPB at different PGA/μmax
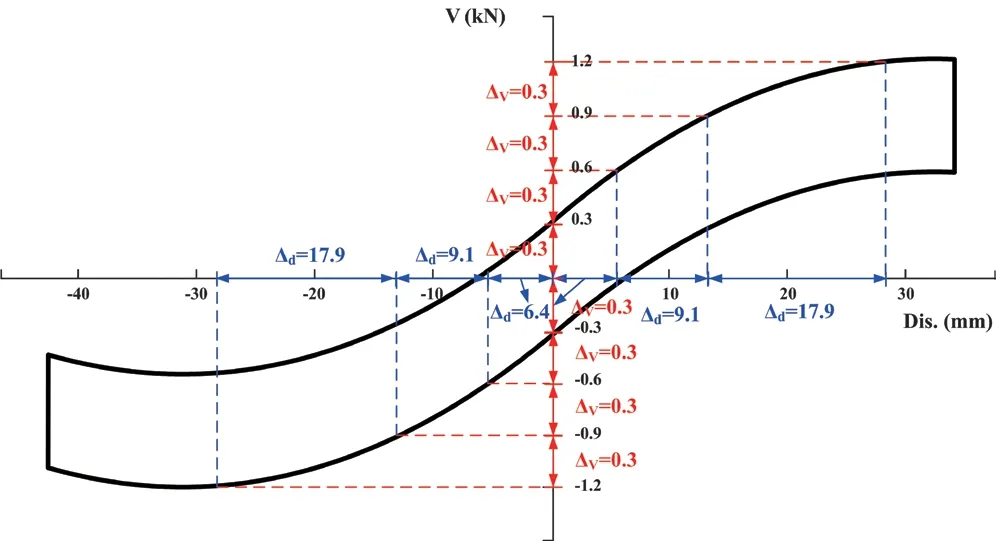
Fig. 19 Plots of displacement vs. force of the VCFPB with a friction coefficient of 0.03
5.4 Overturning moment response on the tank wall
5.4.1 RTHS testing results
The horizontal movement of liquid in the tank can produce an overturning moment on the wall during an earthquake. To assess the tensile and tearing damage or lifting of the tank, the overturning moment ought to be considered. Figures 15(a) and 15(b) show the moment–time histories of the storage tank isolated by the VCFPB during the excitation of the El-Centro and Kobe waves with a PGA of 0.9 g. During the excitation of El-Centro wave, it was found that the low-frequency component excited by the liquid sloshing gradually became stronger as time elapsed, while the VCFPB yielded a poor isolation performance on liquid sloshing. However, the Kobe wave failed to excite the liquid sloshing in the tank so that the good isolation performance of the VCFPB for the high-frequency overturning moment was maintained. Figure 16 shows a comparison of the peak reduction factor of the overturning moment that can be described by Eq. (9). El-Centro and Hachinohe waves led to increased and obvious liquid sloshing excitations. In this sense, once the peak moment appeared in the process of liquid sloshing, the low-frequency moment of the isolation response will be different. Therefore, the influence of different ground motions on the peak reduction factor of overturning moment can reach 50%.
5.4.2 Comparison of RTHS testing and numerical simulation
The influence of ground motion characteristics on the peak reduction factor of the overturning moment is relatively large. By observing the data summarized in Table 5, it can be found that in most cases, the difference between the test and the simulated results are applicable with around 10% errors. However, under the excitation of the El-Centro wave, the difference becomes larger. The reason has been explained above. Under the excitation of the El-Centro wave, the liquid in the tank has been sloshed, and the Housner model cannot accurately describe the dynamic characteristics of the liquid after sloshing. In other words, the Housner model is not accurate for the strong nonlinearity of liquid tanks excited by large earthquake excitation.
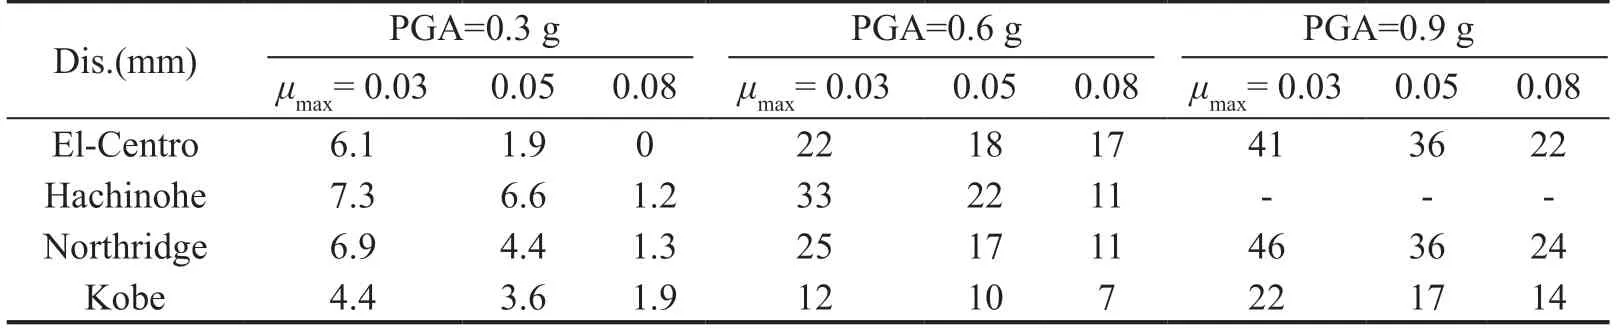
Table 7 Maximal slip displacements of VCFPB (mm)
5.5 Slip displacement response of VCFPB
5.5.1 RTHS testing results
In the case of the VCFPB, the increased slip displacement at the isolator exhibited a better isolation performance. However, an excessively large slip displacement will increase the risk of pipeline failure. Figure 17 indicates the displacement–time history of the VCFPB at different friction coefficients excited by the El-Centro wave with a PGA of 0.9 g. VCFPB with smaller friction coefficients cause larger slip displacements at the isolation layer. To evaluate the level of nonlinearity of isolator, the maximum slip displacements of VCFPB in different cases are shown in Table 7. The numbers in the table are in millimetres.
Figure 18 shows plots of the dynamic magnification factor of the VCFPB at different PGA/μmaxvalues excited by the four seismic waves. The measured and simulated results indicate that the slip displacement response of the VCFPB is related to the negative exponent of PGA/μmaxfor the same peak reduction factor for an acceleration input into the tank, and for the same shear force and overturning moment at the bottom of the tank. The identified results are summarized in Table 6.
5.5.2 Comparison of RTHS testing and numerical simulation
Figure 18 shows obvious differences for the same PGA/μmaxvalues at different ground motions in which the displacement induced subject to the Kobe wave excitation was only 60% of that induced by the Hachinohe wave. Compared with the experimental results, the maximum error of the simulation can reach 80%. These errors are larger than those evoked for the acceleration, shear force, and overturning moment.
The reasons for the deviation of the Housner model in calculation of the slip displacement are as follows. The stiffness of the VCFPB degrades rapidly after it slips, and the slip displacement of the VCFPB is very sensitive to the shear force. For example, consider that the VCFPB had a friction coefficient of 0.03, and a vertical pressure of 10 kN. As shown in Fig. 19, the stiffness of the VCFPB decreases rapidly after slipping occurs, and a small force will thus cause large displacements. For example, for the same shear increment of 0.3 kN, the slip displacement increment increased rapidly from 6.4 mm to 9.1 mm and to 17.9 mm. Therefore, a small shear force error of the tank estimated by the Housner model will lead to a large slip error of the VCFPB. Further, a more accurate numerical model for the VCFPB needs to be built based on an advanced model estimation method such as neural network or model updating. A follow-up study will focus on these issues.
6 Conclusions
Due to the limitations pertaining to the size and capability of the test facilities, shaking table test models of liquid storage tanks are usually the scaled models with insufficient masses. Accordingly, the vertical pressure and friction coefficient of scaled VCFPB in tests cannot match the respective values of the prototype. To evaluate the seismic performance of the VCFPB isolated storage tank, a RTHS test was conducted, and the issues of insufficient mass in traditional shaking table tests were prevented. With the use of the RTHS testing method, a tank model was tested. The model was isolated by the VCFPB at 1:8 scale and had a depth-to-length ratio of 0.2. The conclusions drawn from this study are as follows:
(1) The test results indicated that the displacement dynamic magnification factor of the VCFPB, peak reduction factor of acceleration, shear force, and overturning moment at the bottom of the tank, were all related to the negative exponent of PGA/μmax. This finding is consistent with the conclusions reported by Wanget al. (2001) based on numerical simulations
(2) The test results confirmed that the isolation performance of the VCFPB was closely related to the cases of different seismic waves. When the four ground motions used in this work were input at the same PGA values, the differences of maximum displacements of the VCFPB were shown to increase by a factor of two at most. The maximum differences of the peak reduction factor of acceleration, shear force, and overturning moment, were equal to 20%. When excited by the seismic waves, including impulse peaks, such as those contained in the Kobe wave, the VCFPB exhibited a better isolation performance
(3) Based on the experimental results, the Housner model can estimate the isolation performance of the VCFPB for the storage tank in terms of acceleration, shear force, and overturning moment with an error of 20%. This means that Housner the model is applicable in the estimation of the above dynamic characteristics of the liquid storage tanks when the depth-to-length ratio is relatively low. The conditions with high depth-to-length ratio will be discussed in future work.
(4) Compared with the acceleration, shear force, and overturning moment, the Housner model yielded larger errors in the prediction of the displacement of the VCFPB by up to 80%. This was attributed to the fact that the stiffness of the VCFPB decreased rapidly after slipping was triggered. Correspondingly, a slight prediction error associated with the shear force of the storage tank is expected to result in a significant estimation error for the displacement of the VCFPB.
Acknowledgment
The authors gratefully acknowledge the support of the Scientific Research Fund of the Institute of Engineering Mechanics, China Earthquake Administration (Grant No. 2018D03) and the National Natural Science Foundation of China (Grant Nos. 51608016 and 51421005) in the pursuance of this work.
杂志排行

Earthquake Engineering and Engineering Vibration的其它文章
- Dynamic shear modulus and damping ratio characteristics of undisturbed marine soils in the Bohai Sea, China
- Geotechnical engineering blasting: a new modal aliasing cancellation methodology of vibration signal de-noising
- Response prediction using the PC-NARX model for SDOF systems with degradation and parametric uncertainties
- Seismic behavior of multiple reinforcement, high-strength concrete columns: experimental and theoretical analysis
- Optimal design of inerter systems for the force-transmission suppression of oscillating structures
- Range of applicability of real mode superposition approximation method for seismic response calculation of non-classically damped industrial buildings