Stock values predictions using deep learning based hybrid models
2022-04-06KonarkYadavMilindYadavSandeepSaini
Konark Yadav|Milind Yadav|Sandeep Saini
1Department of Electronics and Communication Engineering, The LNM Institute of Information Technology,Jaipur, India
2Department of Computer Science and Engineering,Rajasthan Technical University,Kota,Rajasthan,India
Abstract Predicting the correct values of stock prices in fast fluctuating high-frequency financial data is always a challenging task.A deep learning-based model for live predictions of stock values is aimed to be developed here.The authors' have proposed two models for different applications.The first one is based on Fast Recurrent Neural Networks(Fast RNNs).This model is used for stock price predictions for the first time in this work.The second model is a hybrid deep learning model developed by utilising the best features of FastRNNs, Convolutional Neural Networks, and Bi-Directional Long Short Term Memory models to predict abrupt changes in the stock prices of a company.The 1-min time interval stock data of four companies for a period of one and three days is considered.Along with the lower Root Mean Squared Error (RMSE), the proposed models have low computational complexity as well,so that they can also be used for live predictions.The models'performance is measured by the RMSE along with computation time.The model outperforms Auto Regressive Integrated Moving Average, FBProphet,LSTM,and other proposed hybrid models on both RMSE and computation time for live predictions of stock values.
1|INTRODUCTION
Economies around the globe are digital now and dependent on each other.A multinational company is having its impact on a lot of companies.The fluctuations in the stock values of such companies can change the economic scenarios for multiple stakeholders.Thus, forecasting the stock values is becoming more crucial now.Forecasting is the process of predicting the future value of any series by considering the previous patterns or long historical data.For example, if the price of gold is increasing every year at Christmas time, then we can predict a similar trend for the current year as well and plan the purchase well in advance to avoid the high rates at Christmas time.Similarly,computational models can help us in predicting the weather for the next day, week, or month as well.With the high volume of money involved, the stock market values have attracted the attention of computer scientists as well to design models and architectures for precise stock value prediction.A lot of such systems have been developed with high accuracies during the past decades as well [1].Forecasting problems can be further divided into three categories and listed as follows:
a.Short-term forecasting, where prediction happens for the next second, minute, hour, day, or month
b.Medium-term forecasting, where prediction happens for the next 1 year, or 2 years.
c.Long-term forecasting, where prediction happens beyond 2 years.
1.1|Motivati on
Stocks are not a simple time series with only one factor affecting the outcome.These can either be univariate or multivariate.Univariate stocks are rare and they are dependent on only one factor or only one company's performance.With the emergingpartnerships and dependence of every big company on its partner's stocks,the second type of stock,that is,multivariate is more common now.So, in such cases, the prediction of exact future stock values can help a lot of investors and stakeholders.This is the motivation behind our proposed model.
1.2|Stock market prediction
The first model to predict the outcome of a time series was first proposed by Ahmad and Cook [2] in 1979.In this work,Auto Regressive Integrated Moving Average (ARIMA) model was introduced, which is one of the most trusted models for time series forecasting even now.This is also a reason behind the fact that a lot of conventional models are based on Auto Regression (AR) and Moving Average (MA) and Exponential Smoothing [3, 4] and generalized autoregressive conditional heteroskedasticity models [5].The existing stock market prediction methods can be classified as follows.
1.Fundamental Analysis is concerned with the company that underlies the stock itself.In such methods, the historical performance, as well as the credibility of the company's accounts, is evaluated to predict future stock values.These methods are stochastic and have limited options to consider unprecedented events to predict the stock in such cases.
2.Technical Analysis.These methods are not considering the working principles of the company but mostly consider the trends and historical stock values.AR, MA, ARIMA, and similar methods are popular methods in this category.These methods are more effective for short-term predictions rather than long-term predictions.
3.Machine Learning (Time Series Forecasting).Artificial Intelligence is emerging as a robust solution for time series forecasting.These methods include artificial neural networks (ANNs) and Genetic Algorithms (GAs).The most common form of ANN in use for stock market prediction is the feed-forward network utilising the backward propagation of errors algorithm to update the network weights.In recent years, Recurrent Neural Network (RNN) has become the best ANN for time series forecasting.
We have focussed on the Deep Learning-based approaches in this work.We have studied the latest models and architectures proposed explicitly for stock market prediction.After considering the shortcomings in terms of their computational time and the Root Mean Squared Error (RMSE) values, we have proposed two different models in this work.We have focussed on two performance parameters, that is, execution time and RMSE.A model can be very accurate in prediction but very slow in computing the output.Such a model cannot be applied for live stock value prediction but very useful for long-term predictions.On the other hand,a faster model with acceptable RMSE can be utilised for live predictions as well.The first model is based on FastRNN architecture.This model is designed to provide faster and accurate results.The second model is proposed by hybridizing FastRNN with Convolutional Neural Network (CNN) and Bi-Directional Long Short Term Memory (Bi-LSTM) networks.This model not only provides the output with less execution time but also with improved RMSE values.
1.3|Organisation
The rest of the paper is organised as follows.We have provided the literature review of the existing machine learning and deep learning-based models for stock market prediction in section 2.We have focussed on single network-based as well as hybrid models in this section.The proposed models are described in complete detail in section 3.We have explained the mathematical model as well as structural augmentations made to implement these models in the same.Section 4 consists of details of our experimental setup, datasets, and simulation results for short-term and long-term stock price prediction.We conclude our work in section 5.
2|LITERATURE REVIEW
We have described that there are three major methods for stock market prediction.We have focussed only on machine learning and more specifically on deep learning-based approaches in our literature review.One of the earliest applications of machine learning models for stock market forecasting was from Tay and Cao [6] in 2001.They used Support Vector Machine (SVM) to verify the feasibility of SVMs for financial series forecasting.The promising results motivated a lot of research groups to explore more machine learning algorithms for the same.In 2003, Egeli et al.[7] proposed a Multi-Layer Perceptron and Generalised Feed Forward network-based architecture for financial forecasting.These models were trained and tested on MAs for 5 and 10-day periods.The results outperformed conventional ARIMA-based approaches.In 2005,Enke and Thawornwong[8]combined conventional data mining algorithms with neural networks to predict stock values.The authors used the Probabilistic Neural Network in their model that was having three feed-forward layers.In the same year, Huang et al.used an SVM-based model to predict the stock values and showed that the SVM-based model outperforms Linear Discriminant Analysis, Quadratic Discriminant Analysis, and Elman Backpropagation Neural Networks.
With the encouraging results from single network-based models for time series forecasting, hybrid models were also explored for the purpose.In 2001,Abraham et al.[9]proposed one of the first hybrid models that were based on neuro-fuzzy logic and ANN.In 2005, Armano et al.[10] proposed the model with hybridisation of a genetic classifier designed to control the activation of a feedforward ANN for performing a locally scoped forecasting activity.In 2007, Fu et al.[11] analysed the problem based on a Fuzzy Cerebellar Model Articulation Controller - Bayesian Ying Yang neural network.This proposed model was motivated by the Chinese ancient Ying-Yang philosophy that states that everything in the universecan be viewed as a product of constant conflict between opposites, Ying, and Yang.In 2008, Choudhary and Garg [12]proposed the GA-SVM model for stock market prediction.The model is a hybrid version of the GA and SVMs.The system was tested on three of India's biggest companies,that is,TCS, Infosys, and RIL that had a trading data of 1386 days from 2002 to 2008.Further, it was tested on the data of 30 companies.The hybrid model outperformed the SVM-based models in terms of RMSE.In 2009, Tsai and Wang [13] also performed the stock price forecasting by using a hybrid model designed using a decision tree(DT)and ANNs.The proposed model,DT-ANN,had an accuracy of 77%and was among the most precise systems at that time.
In this decade,the focus has shifted to deep learning-based models.Ding et al.[14] developed an event-driven deep learning model.In this model,a variant of CNN,that is,Deep CNN was used to predict the stock values.The events are extracted from the news articles and stored as dense vectors,trained using a novel neural tensor network.This dense network was trained using the Deep-CNN.Akita et al.[15]applied deep learning models Paragraph Vector, and Long Short-Term Memory (LSTM) to financial time series forecasting.The model also utilised the news article data and converted those into the Paragraph vector,which was then fed to LSTM to predict the stock prices.This model was tested on the Tokyo Stock Exchange.Fischer and Krauss[16]also proposed a similar LSTMbased architecture.The model outperformed random forest, a deep neural network(DNN),and LOG-based models.CNN has been employed by several researchers for the problem.Hoseinzade and Haratizadeh [17] proposed CNNpred, which was a CNN-based model for establishing the relationships between different stock markets across the globe and showed the positive correlation between the trends across the global stock exchanges.Gudelek et al.[18]enhanced the regular CNN model to the two-dimensional model and employed it for the task.The first convolutional layer had 32 filters of size 28 × 28 and the second one had 64 filters of the same sizes.This improved the RMSE values.Eapen et al.[19]presenteda hybrid model that was made using CNN and Bi-LSTM.The proposed model was 9%better than a single network-based model.Selvin et al.[20]had proposed a similar architecture that was based on the hybridisationof LSTM,RNN,andCNN.Inthenextsection,we explain our proposed models which aim to improve the RMSE values as well as provide faster results.
Significant work was carried out on stock by Nabipour et al.in the field of stock market predictions.The authors have carried out Stock Market predictions Using Machine Learning and Deep Learning Algorithms via Continuous and Binary Data[21,22].Ecer et al.have used GAs and Particle Swarm Optimisation for Modelling Stock Price Index Prediction [23, 24].These techniques can be used in various other domains as well[25,26].
3|PROPOSED MODEL
In designing a stock market price prediction model, the foremost requirement is the availability of a suitable dataset.We have considered four companies for our study and those are Facebook Inc., Uber Inc., Apple Inc., and Nike Inc.from the New York Stock Exchange.We have obtained the stock values from Yahoo finance.1https://finance.yahoo.comThe dataset includes information about day stamp,time stamp,transaction ID,the stock price(open and close),and volume of stock sold in each minute interval.For our model,we have used the close price for each stock.Our work also aims on creating a prototype for live prediction.We consider a working duration of 8 h and divide those hours into training and testing time.We are predicting the future prices of each minute for the next 50 min by keeping the initial 7 h 10 min data in training.The best window length was identified by calculating the root mean square error for various window sizes.
We kept the size of the data the same for all the stocks,that is, each stock has 430 rows and the model was trained on 40 epochs.We have considered the error and computation time of each model for our study.If the loss (mean squared error) for the current epoch is less than the value obtained from the previous epoch, the weight matrix for that particular epoch is stored.After the completion of the training process, each of these models was tested on the remaining 50 values.In this process, the model with the least RMSE is taken as the final model for prediction.
To compare our model with the existing similar models,we have initially considered a few baseline models and then the state-of-the-art models.We have considered the following baseline models for our study.
1.ARIMA is a widely known model for time series forecasting that works on the concept of MA.It is based on the trend stationarity,and seasonality of the data.Here,we have to first make the input data stationary and then after finding their auto-correlation values and partial auto-correlation, we would be able to forecast.The only glitch with this model is that it cannot be automated for all kinds of stocks,as we have to set differentp,d,q(number of auto-regressive terms,number of non-seasonal differences needed for stationarity,number of lagged forecast errors)values for different stocks.
2.LSTM is a well-established model used for time series forecasting and frequently applied for stock market price prediction [27-29].It is a derived RNN with forget gate functionality.LSTMs are very effective for long as well as short-term predictions.
3.FBProphet: is another time series forecasting model introduced by Facebook Inc [30].This model required very less computational time in comparison to other models
4.A hybrid model of CNN and LSTM:This is a hybrid model designed recently and extensively used in stock price prediction.The model consists of both LSTM and CNN layers[31, 32].
These baseline models have their advantages and disadvantages.For example, FBProphet is the fastest model but underperforms in terms of error.Similarly, the hybrid modelbased on CNN and LSTM provides very little error but takes more time in predictions.A single neural network-based model performs well on one aspect of the problem while lags behind on the other front.Thus, we decided to exploit the good features of multiple networks.We have considered the following networks for their respective advantages in time series prediction.
3.1|FastRNN-based hybrid model
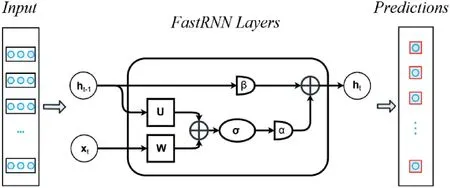
FastRNN was proposed by Microsoft in 2018[33].The model is based on the Residual Network(ResNet)[34].If we look at the structureofResNet,theninthismodel,everynetworklayerisnot stacked over each other,but they form a residual mapping.It is shown that when compared with unreferenced mapping, the residual mapping is easier to optimise.The model is based on the visual geometric group model and modified by adding residual layers.ResNet is trained on 25.5 million parameters.This makes ResNet a very heavy network as well.FastRNN exploits the learned residual connections of ResNet and provides stable training along with comparable training accuracies at a much lower computational cost.The prediction accuracies of FastRNN are 19% higher than those of the regular RNN structures and a little less than those of the gated RNN.
LetX= [x1, …,xT] be the input vector wherextϵRDdenotes thet-th step feature vector.So,for a multi-class RNN we aim to learn a functionF:RDxT1, …,Lthat is going to predict any of theseLclasses for a given point of data that isX.In a normal RNN architecture,hidden state vectors which are represented by
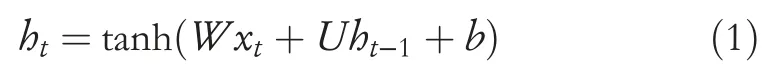
LearningU, andWin the architecture given above is arduous,as the gradient can have an exponentially large(inT)condition number.Unitary network-based ways can solve this problem by expanding the network size and in this process,they become significantly large and the model accuracy may not remain the same.
However, FastRNN utilises a simple weighted residual connection to stabilise the training by creating wellconditioned gradients.In particular, FastRNN updates the hidden statehtas follows:

Here,αandβare trainable weights, which are parameterised by sigmoid function and limited in the range 0 <α,β<1.σis a non-linear function such as hyperbolic tangent,sigmoid, or Rectified Linear Unit (ReLU), and can vary across datasets.
FastRNN reconditions hidden state in a calculated manner withα, βlimiting the extent to which the present attribute vectorxtupdates the hidden state.Also, FastRNN has two more parameters than RNN and requires lesser computations,which is a very minute fraction of the per-stride computational complexity of the RNN.Unlike unitary methods [35, 36],FastRNN does not introduce any costly systemic constraints on U and hence scales well to huge datasets with typical optimisation methods.The proposed FastRNN-based model for stock market predictions is shown in Figure 1.
3.2|FastRNN + CNN + Bi-LSTM-based hybrid model
The first model proposed in this work is designed to provide a faster computation time with reasonably good accuracy.The second aim of this work is to maintain fast computation with improved accuracy.In this direction,we propose a hybrid model that exploits the good features of multiple networks.We use FastRNN as our first network that will provide faster results and augment it with CNN and Bi-LSTM networks to improve the accuracy of prediction.Bi-LSTM was proposed in 1997 [37].This model is designed to learn in both directions and is one of the best-suited models for sequence to sequence learning.For time series forecasting as well,the model has been proven to be a good fit [38-40].The encouraging results from these recent works have inspired us to consider Bi-LSTM as our last network.We have taken the conventional CNN in between FastRNN and Bi-LSTM to stabilise the network.A CNN has similarities with an ANN but it takes presumptions about the input data,which allows it to attain greater invariance when encoding the properties of input data into the network.CNN needs to be trained on huge amounts of training data to generate deep learning models that attain higher generalisation accuracy.The proposed design of the hybrid model is shown in Figure 2.
In the proposed model, we have taken a three-stage pipeline consisting of FastRNN, CNN, and Bi-LSTM.In the first model, we have explained the added advantages of FastRNN for time series forecasting.The CNN layer is onedimensional with an ReLU activation function.The kernel size is kept as 3 and keeping padding as ‘same’ followed by Maxpooling.1-D CNN is used to extract the higher-level features only.These extracted features are fed to the final stage, that is, Bi-LSTM network.Bi-LSTM is followed by 2 dense layers.In the proposed model, the Bi-LSTM unit learnsfrom both the backward and forward sequences of data and uses concatenation to merge the two sequential outputs.There was no overfitting observed, that is why we have not added a dropout layer.Here, using Bi-LSTM also prevented us from the vanishing gradient problem.Network parameters:As mentioned before,we are using 430 stock values as input,and the 1-D CNN layer with the use of 3-kernel windows to return another sequence of smaller size.The output from the 1-D CNN is then fed into the Bi-LSTM layer group and is giving an output sequence of length 50.The output of this group is then fed to a dropout layer, which gives 25 units and 1 unit output, respectively.As it can be considered as a standard regression problem, we have used RMSE as the loss function to determine the error in the predicted versus actual data.We have to keep input and output rates identical and are critical for time-series forecasting.
F I G U R E 1 Fast Recurrent Neural Networks-based proposed model for faster stock values prediction

F I G U R E 2 FastRNN, CNN, and bi-directional long short term memory based hybrid model for higher accuracy stock market predictions
Let us assume that [x=x1,x2,x3, ….,xn] is the onedimensional input for the 1-D CNN layer.The equation makes a feature map after it gets convoluted with the convolution operator and is passed through a filterWϵRfd,wherefsignifies inherent attributes from the input data throwing out as output.A new features setfmfrom the new attributesfrepresented in the equation below:

Every set of featuresfuses the filter hl in the input defined by[x1-f,x2-f+1,…,xn-f+1].This operation generates a feature map denoted by [hl1,hl2, …,hln-f+1].
Convolution layer outputs are obtained as a sum of weighted inputs after multiple linear transformations.For a non-linear feature extraction problem, linear transformations do not perform with satisfactory success and thus we have to add non-linear activation functions.In this model, we have chosen the ReLU activation function which applies max(0, x) on each input.The output is down-sampled in the next step to reduce the information, so that the computation time can be improved.In our model, we have used max-pooling for that which is represented byhl= max (hl).Here, pooling helps the model to select the most relevant information and the output of the max-pooling layer can be denoted as follows:

wherexiis the data vector which is inputted to the CNN network andis the CNN network output which is then further passed to the Bi-LSTM network.To get the idea of Bi-LSTM, we add forget gate structure in the LSTM.The equation is denoted by

whereiis the input gate,fis the forget gate,ois the output gate,g, andcinput modulation gate, respectively.Note that these are inn-dimensional real vectors.In Equations (6)-(8),theσis a sigmoid function andWi, Wf,Wo, andWgare fully connected neural networks for the input, forget, output, and input modulation gates,respectively.The issue with the LSTM model is that it only considers information from one direction on a sequence which leads to an effective reduction of the LSTM model.Also, multi-directional information in the sequence can have valuable information data.Therefore,Bi-LSTM was developed and it combines backward and forward directions in the sequence.
Order for the forward LSTM is [x1,x2, …,xn]and for the backward LSTM is [xn,xn-1, ….,x1].Post-training, both the forward and the backward LSTMs separately are integrated by combining their outputs in the previous step,which is denoted in Equation (12) as,
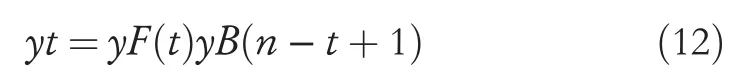
whereyFandyBare the outputs of the backward and forward LSTMs, respectively, while the notation denotes integrationoperator such as a simple adder.The proposed model is developed on Google Colab.Details of experimental setup and results are provided in the next section.

T A B L E 1 RMSE and computation time calculated for the state-ofthe-art and the proposed models for Apple Inc.stock values
4|EXPERIMENTAL RESULTS AND DISCUSSIONS
4.1|Experimental setup
We have used a free version of Google Colab with AMD EPYC 7B12 CPU as our execution environment with 12 GB(adjustable) assigned RAM, with one socket, two threads per core, 13,684K of L3 cache, CPU of around 2250 MHz, and with No Power level.We have developed our model using the Python programming language (Python 3.5).We used Keras(with Tensorflow backend) library for creating our deep learning models.To compile the data into a suitable format,we have used Pandas,and for dividing our data into test and train,we have used Numpy.For visualisation,we have the matplotlib library.The dataset and the corresponding codes are available at GitHub.2https://github.com/MilindYadav-97/Hybrid_FastRNN-for-stock-predictions
4.2|Results
We have used 430 stock values for training and 70 for testing.We have tested our models on the stock values of 4 companies,that is, Apple, Facebook, Nike, and Uber.These proposed models are compared with nine other state-of-the-art models.We have trained the models for 40 epochs.The RMSE values and the computation time for each of the nine models along with the two proposed models for four companies, that is,Apple, Facebook, Nike, and Uber are shown in Tables 1-4.These tables highlight the best values for each column.
The training process is fast and could be carried out on a CPU because the data-size was not very high.The values of loss functions for each of the 4 companies' data training are shown in the graphical form in Figures 3 and 4.
From the mentioned tables,Tables 1-4,it can be observed that the proposed models,not only have lesser RMSE but also they perform better in terms of their computation speed,which gives a clear indication that these models can be useful in making live next minute predictions of a stock price which will help the investor to buy stocks more wisely as the market can crash anytime due to any reason.The proposed modelswork best on multiple stocks, which can be seen in the mentioned tables that the proposed models have outperformed other classical and hybrid models in terms of both RMSE and computation time.There is a visualised comparative study in Figure 3, which shows how the validation loss(Mean Squared Error) on the validation dataset is improving after each epoch for all the studied stocks.Figure 4 shows how the model learning speed is increasing after each epoch, as we can see a horizontal line of training loss(Mean Squared Error)after five epochs.Here, Figure 5 shows the comparative study of the actual and predicted values of the baseline model and our proposed models for the next 20 min and it can be observed that the proposed models' predictions were closer than the actual stock values for each of the visualised stock.

T A B L E 2 RMSE and computation time calculated for the state-ofthe-art models and the proposed models for Facebook Inc.stock values

T A B L E 3 RMSE and computation time calculated for the state-ofthe-art models and the proposed models for Nike Inc.stock values

T A B L E 4 RMSE and computation time calculated for the state-ofthe-art models and the proposed models for Uber stock values
5|CONCLUSIONS
Financial data prediction can be very beneficial for companies and investors.Deep learning-based models have been quite effective for such predictions in recent years.In this work, we have proposed two models for this purpose.The first model that is based on FastRNN,can provide faster predictions whencompared with other state-of-the-art models (except ARIMA and FBProphet).While improving the speed of prediction, it also provides better or at par RMSE values as well.Thus,also when compared with FBProphet and ARIMA, this is a better choice for a reliable model.The second model improves the first proposed model while keeping the speed almost the same.It compromises a bit on the speed of prediction but improves the RMSE values.These models can help people who have invested in stocks.Using these models,if suppose the investor gets to know that stock prices are crashing in the next minutes or so, then the investor can sell the stocks at the right time which can prevent the investor from heavy losses.Similarly, if the investor knows that in the next few minutes, stock prices will rise, then accordingly the investor can make a move.The only limitation with the proposed models is that we have not considered any other external factors on which stock prices might be dependent on, such as their demand and supply,geographical changes, company's profit/loss, etc.As we all know that stock prices are very volatile,it is better to take into account other factors as well such as region, geographical seasons, inflation, cost of raw products, market competition,demand,and supply,etc.on which stock prices are dependent.In the future,we will consider these other dependent attributes as well, which can affect the stock price values and will make our model more robust.

F I G U R E 3 Comparison of plots of validation losses (mean squared error) of our proposed and baseline models at each epoch for all the studied stocks

F I G U R E 4 Comparative plots of training losses (mean square error) of our proposed and baseline models at each epoch for all the studied stocks

F I G U R E 5 Predicted stock values with proposed model and baseline models
ACKNOWLEDGEMNTS
There is no funding source for this research.It is completed as part of the individual level with the support of the host institute, that is, the LNM Institute of Information Technology,Jaipur, India.
ORCID
Sandeep Sainihttps://orcid.org/0000-0002-8906-8639
杂志排行

CAAI Transactions on Intelligence Technology的其它文章
- Deep learning for time series forecasting: The electric load case
- Head-related transfer function-reserved time-frequency masking for robust binaural sound source localization
- A hierarchical optimisation framework for pigmented lesion diagnosis
- A spatial attentive and temporal dilated (SATD) GCN for skeleton-based action recognition
- Improving data hiding within colour images using hue component of HSV colour space
- Several rough set models in quotient space