Contrasting patterns of accumulation,partitioning,and remobilization of biomass and phosphorus in a maize cultivar
2022-02-19WinZhngHigngLiJunlingZhngJinboShnHmishBrownEnliWng
Win Zhng, Higng Li, Junling Zhng, Jinbo Shn, Hmish Brown, Enli Wng
a Key Laboratory of Plant-Soil Interactions, Ministry of Education, College of Resources and Environmental Sciences, China Agricultural University, Beijing 100193, China
b School of Biological and Food Processing Engineering, Huanghuai University, Zhumadian 463000, Henan, China
c Inner Mongolia Key Laboratory of Soil Quality and Nutrient Resources, Key Laboratory of Grassland Resource (IMAU), Ministry of Education, College of Grassland, Resources and Environment, Inner Mongolia Agricultural University, Hohhot 010018, Inner Mongolia, China
d The New Zealand Institute for Plant & Food Research Limited, Private Bag 4704, Christchurch, New Zealand
e CSIRO Agriculture and Food, GPO Box 1700, Canberra, ACT 2601, Australia
Keywords:Biomass Phosphorus Partitioning Remobilization Individual leaves
ABSTRACT Maize growth,organ development,and yield formation are highly controlled by the manner in which the plant captures, partition, and remobilizes biomass and phosphorus (P).Better understanding of biomass and P accumulation,partition,and remobilization processes will improve modeling of crop resource use.However,there is still a lack of detailed data to parameterize the modeling of these processes,particularly for modern maize cultivars.A two-year(2016 and 2017)field experiment with three P fertilization treatments (0 (P0), 75 (P75), and 300 (P300) kg P2O5 ha- 1) was conducted on a Fluvo-aquic soil (Quzhou,Hebei province,China)to collect data and quantify key processes for a representative modern maize cultivar (Zhengdan 958) widely grown in China.The proportions of biomass and P partitioned into various maize organs were unaffected by P application rate.Zhengdan 958 showed a much lower leaf-senescence rate than older cultivars, resulting in post-silking leaf photosynthesis being sufficient to meet grain biomass demand.In contrast,50%-85%of leaf P and 15%-50%of stem P accumulated pre-silking were remobilized into grain,in spite of the large proportion of post-silking P uptake.Our results are consistent with the theory that plants use resources according to the priority order of re-allocation from senescence followed by assimilation and uptake,with the re-translocation of reserves last.The results also enabled us to estimate the threshold P concentrations of Zhengdan 958 for modeling crop P demand.The critical leaf P concentration for individual leaves was 0.25%-0.30%, with a corresponding specific leaf P (SLP) of 75-100 mg P m- 2.The structural P concentration for leaf was 0.01%, corresponding to an SLP of 3.8 mg P m- 2.The maximum P concentrations of leaves and stems were 0.33% and 0.29%.The residual P concentration for stems was 0.006%.
1.Introduction
Phosphorus (P) is a plant macronutrient whose deficiency reduces crop growth and grain yield [1-3].The reliance of crop production on continuous input of P fertilizers made from a finite resource of phosphate rock has led to efforts to develop more Pefficient crops through interdisciplinary research approaches [4].In these approaches, simulation models are a crucial tool for evaluation of crop traits for improving P use efficiency.However, in comparison with nitrogen (N), relatively little research work has been performed to simulate how changes in P supply affect plant growth and yield across environments, particularly for modern crop cultivars and using physiologically based crop modeling [5].This is partly because P is less mobile than N in soil and thus easier to manage.It is also due to the difficult of quantifying P availability to crops in different soils,making the initialization of soil P models difficult [5,6].Parameterization of crop models for quantifying demand, uptake, and remobilization of P dynamics in crop plants is needed [5].
Understanding of biomass and P accumulation, partitioning,and remobilization (movement of biomass or P from vegetative to reproductive organs) processes will improve modeling of crop resource use and yield formation.The partitioning of biomass or P to from organs is essential for maintaining physiological functions of a crop [7].When they receive different P applications,crops must precisely regulate the partitioning pattern of biomass and P into roots to assimilate P and into shoots(leaves and stems)to support structures that capture radiation for carbon assimilation[8].Crop internal P recycling (remobilization) occurs at the beginning of the grain filling period, and is critical for increasing P use efficiency and relieving P stress[9,10].During grain filling,P stored in vegetative organs is gradually remobilized into developing kernels to support their growth [11], while P in leaves needs to be properly maintained to ensure high rates of photosynthesis [12].There is a tradeoff between higher P remobilization from leaves(higher P use efficiency) and higher rates of leaf photosynthesis controlled by P concentration in leaves.
A recent framework to improve modeling of partitioning and remobilization of biomass and N was developed by Brown et al.[8]and implemented in the APSIM (Agricultural Production Systems Simulator)Plant Modelling Framework(PMF).The PMF is a collection of generic plant or organ classes that can be assembled and parameterized to create plant models with variable details [13].PMF simulates partitioning using an‘‘Organ Arbitrator”.The arbitrator sets the allocation priorities to simulate partition and remobilization of biomass and N in organs as determined by structural(minimum-level), metabolic (critical-level), and nonstructural(maximum-level) demands.It has received only limited validation for biomass and N of wheat and maize, and more detailed data on biomass and nutrient status are needed to parameterize and test the approach.No research on P dynamics in crops has been performed with the PMF to date,owing largely to a lack of detailed data.
In this study, we aimed to use data from two years of field experiments to investigate patterns of accumulation, partition,and remobilization of biomass and P in a representative modern maize cultivar under varied P supply conditions in a typical calcareous alluvial soil.We focused on accumulation and remobilization of biomass and P in individual leaves rather than stem, cob,husk, and grain.Our objectives were to (a) quantify the capture,partitioning, and remobilization of biomass and P; (b) estimate threshold P concentrations that are needed in crop models to simulate crop P demand, P stress, and residual P in plant organs; (c)test assumptions about partitioning and priorities of resource utilization in Brown et al.[8]for biomass and P;and(d)identify paths to further improvement in modeling of these processes.
2.Materials and methods
2.1.Experimental site, soil, and climate
Field experiments were conducted from May to October in two successive cropping seasons(2016 and 2017)at Quzhou Experimental Station of China Agriculture University(36.9°N,115.0°E)in Quzhou county,Hebei province,China.The experiment site was located in the center of the North China Plain,one of the major grain production areas in China.The soil is a typical calcareous alluvial soil with a loamy and silty texture with proportions of 14.7% clay, 74.0% silt,and 11.3% sand in the top 20-cm layer.The chemical properties of this soil layer at the start of the maize growing seasons in 2016 and 2017 were as follows:soil pH(1:2.5 w/v in water)8.5 and 8.3,extracted mineral N(Nmin)17.7 and 15.1 mg kg-1,and organic matter content 10.3 and 10.8 g kg-1,respectively.Weekly precipitation,mean daily radiation,and temperature are shown in Fig.1.Total precipitation amounts were 490 and 233 mm during the maize growing seasons from May to October in 2016 and 2017,respectively.
2.2.Experimental design
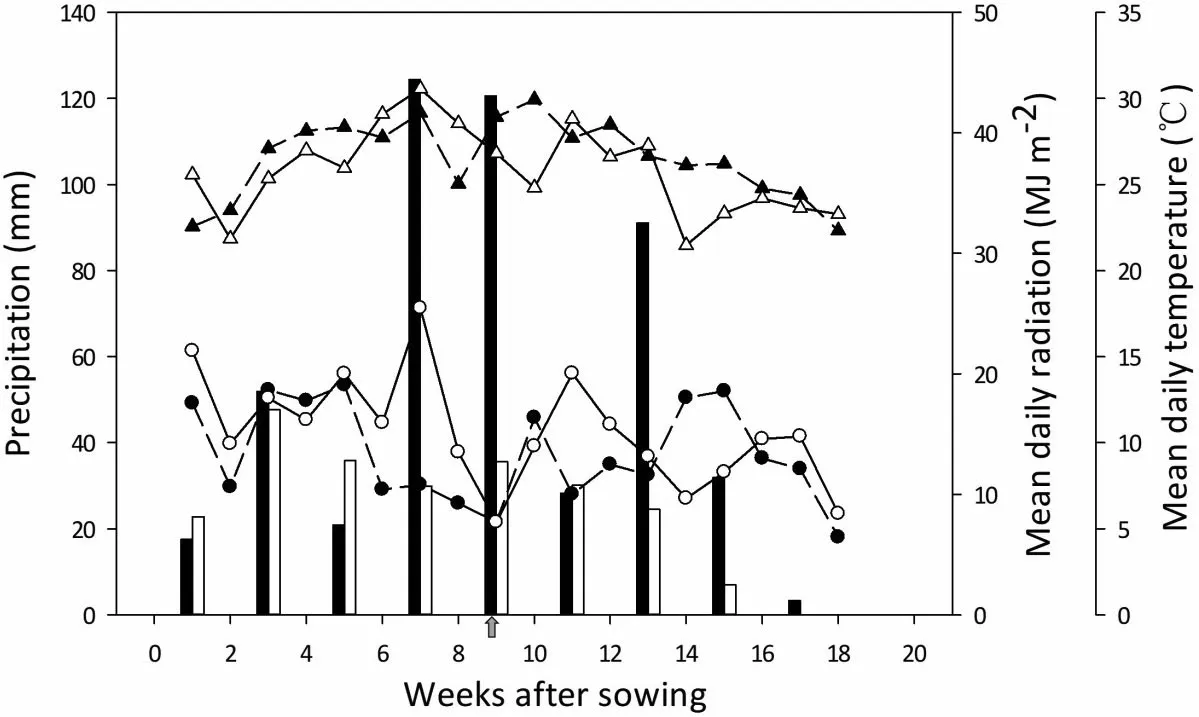
Fig.1.Weekly precipitation (bars), mean daily radiation (circles), and mean daily temperature(triangles)during the maize growing season in 2016(closed symbols)and 2017 (open symbols).Arrow indicates time of silking.
The field experiment was started in 2010 as a long-term experiment with five P application rates (in kg P2O5ha-1) every year:0(P0), 37.5 (P37.5), 75 (P75), 150 (P150), and 300 (P300).Based on the yield response to P application in 2010-2015 [14], (Fig.S1),three P application rates were selected for the present study:P0,P75, and P300, to represent respectively P stressed, P-moderate supply, and P-luxurious conditions for a representative modern maize cultivar on the selected soil.At the start of the experiment in 2016, the corresponding soil Olsen-P concentration in the top 20 cm soil of the P0, P75, and P300 treatments were respectively 2.6,10.0,and 32.8 mg kg-1.A randomized block design with three P application rate treatments:P0, P75, and P300, with four replicate plots was used.The plot size was 250 m2(12.5 m × 20 m)and plots were treated with the same P application rates in both 2016 and 2017.Maize cultivar ZD958 was sown on May 26 in 2016 and May 27 in 2017.The plots were overseeded at double density and then thinned at the seedling stage to a final plant density of 75,000 plants ha-1with a row spacing of 60 cm.All plots were treated with 225 kg N ha-1as urea (46% N), 60 kg K2O ha-1as K2SO4(50% K2O), and P fertilizer as calcium superphosphate.P and potassium were broadcast and incorporated into 0-20 cm soil before sowing.Urea was applied in three applications during whole maize growth stage:90 kg N ha-1at sowing, 60 kg N ha-1at the six-leaf stage, and 75 kg N ha-1at the 12-leaf stage.Flood irrigation with 110 mm of water was applied before sowing in each year to ensure no water limitation to crop growth.Weeds and pests were controlled, herbicides were sprayed after sowing and pesticide sprayed at the 12-leaf stage.In 2016 and 2017, the respective grain harvest dates were September 27 and 29.
2.3.Sample collection and nutrient analysis
Four plants were randomly sampled from each plot at the seedling stage,23 days after sowing(DAS)in 2016 and 18 DAS in 2017,at jointing(36 DAS in 2016 and 32 DAS in 2017),at silking(67 DAS in 2016 and 62 DAS in 2017) and at physiological maturity (123 DAS in 2016 and 2017).Visible leaves at silking and maturity were numbered from the oldest(leaf 1)to the youngest leaf.At seedling,jointing and silking stages, plants were cut at the stem base, and shoots were separated into individual leaves(blade),and stem(including leaf sheath).At maturity,plants were cut at the stem base,and shoots were separated into individual leaves, stem, grain and cob plus husk.The area of each leaf blade was calculated as the measured leaf length × measured leaf width × 0.75 with fully expanded leaves.All samples were held at 105 °C for 30 min and dried at 70 °C to constant weight.Total shoot biomass, stem biomass, cob plus husk and grain biomass at maturity were determined.All samples were then ground into fine powder, mixed evenly,and digested in a mixture of H2SO4and H2O2to determine P concentration and content in different plant parts by the molybdovanadate spectrophotometric method [15].
2.4.Biomass and P uptake and remobilization calculations
Here we define remobilization as a decline in either biomass or P in leaves and stems between silking and maturity stages.We further use the term ‘‘reallocation” to refer to the remobilization of biomass or P from senesced organs (leaves), and the term ‘‘retranslocation”to refer to the remobilization of biomass and P from reserves in live organs (leaves and stems).More details are given below [16,17]:
• P uptake (kg ha-1) = the total amount of P in the aboveground biomass.
• Biomass remobilization (t ha-1) = the difference in biomass of leaves and stems between silking and maturity.
• P remobilization (t ha-1) = the difference in P content of leaves and stems between silking and maturity.
• Contribution of biomass remobilization to grain (%) = Biomass remobilization/grain biomass at maturity.
• Contribution of P remobilization to grain (%) = P remobilization/grain P content at maturity
We distinguish the reallocation and re-translocation processes with respect to their priority for resource allocation.
2.5.Data and statistical analysis
A one-way analysis of variance(ANOVA),followed by a LSD test(least significant difference) atP≤0.05 was performed with SPSS(version 20.0, 2018, Beijing).
3.Results
3.1.Total biomass, P uptake, grain yield, and yield components
Biomass,shoot P uptake,grain yield,and kernel number per ear were significantly reduced under P0 treatment, but similar under P75 and P300 treatments (Fig.2).P application of >75 kg P2O5ha-1did not lead to further increase in maize crop yield in either 2016 or 2017(Fig.2d).Zero P application(P0)reduced maize yield by reducing kernel number per ear(Fig.2e)but did not reduce kernel size (biomass of 100 kernels, Fig.2f).Biomass, grain yield, and biomass of 100 kernels were significantly lower in 2017 than with 2016.As P application increased from 0 to 75 kg ha-1, shoot biomass increased and then plateaued at 72.3 kg P ha-1(Fig.S1).Thus,P75 was close to the optimal P application rate for this cultivar on this soil, below which maize growth began to decline.
3.2.Accumulation and fraction of biomass and P in plant
Around half of total aboveground biomass was accumulated at silking and the other half thereafter (Table S1).Around 25%-42%of total P was taken up at pre-silking, and 58%-75% was taken up during the grain growth and filling stage (Table S1).
P application rate did not affect partition of biomass and P among organs (Fig.3).At silking, 40% of biomass was in leaves and 60% in stems.Grain biomass at maturity was around 50% of the aboveground total, with a harvest index of 0.47-0.52.At silking,around 40%of P was in leaves and 60%in stems,and at maturity grain P content was 85%-90%of total P uptake in aboveground organs.
3.3.Plant remobilization of biomass and P
From silking to maturity,the total biomass of leaf decreased by 11%-31% in all treatments and in both years (Fig.4; Table S1),owing to remobilization of biomass.The amount of decrease in total leaf biomass was about 5%-11% of final grain biomass(Fig.4).Stem biomass increased after silking in the P75 treatment while remaining almost unchanged in the P0 and P300 treatments(Fig.4;Table S1),indicating no net remobilization of biomass from stem to grain during the grain-filling period.In the P75 treatment,post-silking photosynthetic assimilates contributed 18%-19% to stem weight, indicating a clear sink limitation for photosynthates in grain (Table S1).
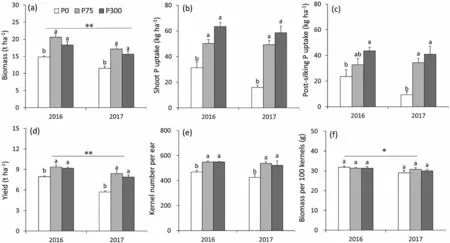
Fig.2.Biomass(a)and shoot P uptake(b)at maturity,post-silking P uptake(c),yield(d),kernel number per ear(e)and biomass(f)of maize as affected by P application rate in 2016 and 2017.Bars represent standard error of the mean of four replicates (n = 4).Different uppercase letters indicate significant (P < 0.05) difference between P treatments.
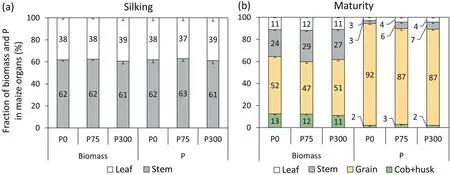
Fig.3.Proportions of biomass and P content in plant parts to total biomass and P of whole plant at silking (a) and maturity (b).Values are means of 2016 and 2017.Bars represent standard error of the mean of four replicates (n = 4).Different uppercase letters indicate significant (P < 0.05) differences between P treatments.

Fig.4.ontribution of biomass and P re-translocation in leaf and stem to grain biomass and P in 2016 (a) and 2017 (b), fraction of P re-translocation from leaf and stem as percentage of total re-translocation (c).Bars represent standard error of the mean of four replicates (n = 4).Negative values denote a biomass increase from silking to maturity.
In all treatments, substantial P remobilization from leaf and stem was observed during the reproductive stage(Fig.4).On average, 64%-76% in 2016 and 59%-87% in 2017 of the P in vegetative organs was remobilized to grain, contributing to 20%-26% and 21%-39% to grain P at maturity (Table S1; Fig.4a, b).Across all treatments,P from stem to grain accounted for 50%-85%,and from leaf to grain 15%-50%, of total P remobilization (Fig.4c).Postsilking uptake of P contributed 71%-79% of grain P content in 2016 and 61%-79% in 2017 (Table S1).Despite the difference in the amount of P remobilization from leaf and stem,the proportion of total P remobilization to grain P was similar across all P treatments both in 2016 and 2017.
3.4.Biomass, P content, and area of individual leaves
Biomass,P content and area of individual leaves increased with leaf position up to the ear leaf,and then decreased towards the flag leaf, roughly following a quadratic function of leaf position(Figs.S2-S4).The maximum single-leaf biomass was around 4 g leaf-1(Fig.S2) whereas the maximum single-leaf P content was 15 mg P leaf-1(Fig.S3).
P deficiency significantly reduced leaf biomass and P content,particularly for the leaves closer to the ear.Reduction in leaf P content was much greater than reduction in biomass.Compared to P300,P75 led mainly to reduction in leaf P content(Fig.S3)rather than leaf biomass (Fig.S2) or leaf area (Fig.S4), indicating Pluxurious conditions under P300.This result also implies that plant P concentrations under P75 were close to the critical P concentration below which maize growth rate starts to decline.
3.5.Remobilization of biomass and P from individual leaves
At individual leaf level, the decline of biomass occurred only from bottom leaves up to leaf 10 and a few top leaves (Fig.S5).These were the leaves that fully or partially senesced (Fig.5a, b),implying biomass reallocation due to aging senescence rather than re-translocation from leaf biomass reserves.The increase in biomass of the middle and upper leaves after silking may have further increased biomass accumulation (Fig.S4).Biomass of the ear leaf similarly increased by 0.2-0.3 g from silking to maturity.
Remobilization of leaf P in individual leaves followed the pattern of leaf P content (Figs.6, S5), with the highest amount of P remobilized from the ear leaf across all treatments and greatest P decline from leaves under P75 (Fig.S5).Most of the P removal was from live leaves (Figs.S5, 6), clearly indicating much greater P re-translocation from reserves than of P reallocation from dead leaves.As proportion of total P in individual leaves, a higher proportion of P was removed from individual leaves under P0 and P75 (Fig.S5), also contributing to a higher proportion of grain P(Fig.S5).The lower P decline in P300 was due to more direct P uptake from soil to meet grain P demand.
3.6.Leaf senescence, and assimilation/uptake, re-allocation and retranslocation of biomass and P
The maize plants showed a strong ‘‘stay-green” trait, with the ear leaf remaining fully and 5-9 leaves partially green at maturity(Fig.7a, b).Compared to the rate of leaf senescence value used in APSIM(0.00035 leaves/Cd),the leaf senescence rate is much lower(0.00025 leaves/Cd) (Fig.5c, d).This slower leaf senescence indicates lower reallocation of both biomass and P from senescing organs to new growing organs at early stages and to grain at the grain-filling stage than in old cultivars.
For the maize cultivar used in this study, the carbon assimilation process by photosynthesis contributed to more than 90% of grain biomass, with less than 10% derived from reallocation from senesced leaves at the bottom and uppermost parts of the plant(Fig.4a, b).The finding that the middle leaves increased their biomass during the grain-filling stage indicates an ability to store reserve, rather than use it, in case of a sink limitation in grain.Despite the sink limitation, biomass in senesced leaves was remobilized via reallocation.In contrast, re-translocation of reserved biomass occurred only when assimilation was not sufficient to meet grain demand.
For P, the plant uses the same strategy as for biomass, despite the total amount of re-translation from reserve being much higher.Uptake of P was the major resource supply to meet the demand of organs,even for grain at the grain-filling stage and under P0 treatment(Fig.2c,d).It was apparent that P uptake from soil and reallocation from senesced leaves could not meet the grain P demand,resulting in greater re-translocation of P from reserves in all leaves(Fig.S5) and stems (Table S1).The higher residual P contents in leaves and stems at higher P rates (P75 and P300) (Fig.7) shows that re-translocation of biomass and P had the lowest priority for the maize plant to allocate resources to grain.
3.7.P concentration, SLP, and residual P in organs
Compared to the maximum P concentrations used in APSIM,our measured maximum P concentrations were much higher for the stem around silking stage, higher for grain, and lower for leaves(Fig.6c-e).For residual P concentrations, our measured values were close for stem and grain, but lower for leaves than APSIM(Fig.6).Cob and husk showed the lowest P concentrations at maturity.There was no significant difference in grain P concentration between the P75 and P300 treatments.

Fig.5.Percentage of green leaf area relative to total individual leaf area in 2016(a)and 2017(b)at silking and maturity growth stages,and dead leaf number simulated with original APSIM with leaf senescence rate 0.00035 leaves/Cd and modified APSIM with leaf senescence rate 0.00025 leaves/Cd(c).Symbols in c and d indicate measured values and lines show simulated values.Leaves/Cd indicates the rate of leaf senescence with the increase of cumulative temperature.Bars represent standard error of the mean of four replicates (n = 4).
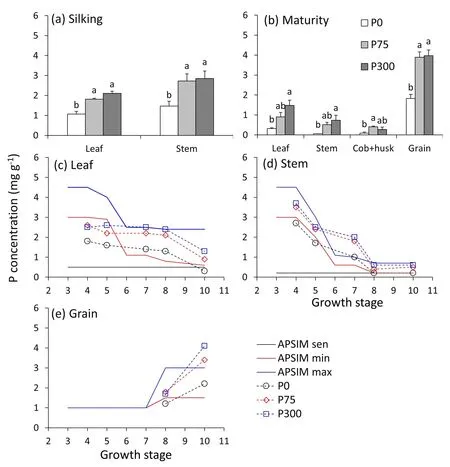
Fig.6.P concentration in plant parts at silking (a) and maturity (b), and comparison of observed P concentration (mg g-1) under P fertilization treatments and senescent,minimum, and maximum P concentrations of leaf (c), stem (d), and grain (e) at multiple growth stages.In APSIM, the 11 maize growth stages are defined as sowing (1),germination(2),emergence(3), end of juvenile(4), floral initiation (5),flag leaf(6), flowering(7),start of grain filling (8),end of grain filling(9),maturity(10),and harvest ripe (11).Bars represent standard error of the mean of four replicates (n = 4).Different uppercase letters indicate significant (P < 0.05) difference between P treatments.
For individual leaves, P concentration increased with P input,with the highest P concentration in leaves under the P300 treatment (Fig.7).Specific leaf P followed a pattern similar to that of leaf P concentration.Individual leaf P concentration gradually increased over leaf positions before silking,with the highest P concentration of 3.3% in the newest leaf and no difference between P75 and P300 (Fig.7a, e).The average value of P concentration in growing leaves before silking under P75 was 0.25%-0.30%(Figs.7a, c, S6), corresponding to a SLP of 75-100 mg P m-2(Fig.7b,d).These values are likely close to the critical values,given that above them there was little change in biomass or leaf size(Fig.S4).
At maturity, the residual leaf P concentration was the lowest under the P0 and highest under the P300 treatment.After retranslocation, the individual leaf P concentrations under the P0 treatment at maturity ranged from 0.1 to 0.7 mg g-1(Fig.7g).The lowest P concentration of 0.01% can be considered the structural P concentration of leaves (under P0).The highest SLP was around 150 mg P m-2(Fig.7d, f).The lowest SLP of 3.8 mg P m-2after re-translocation at maturity (Fig.7h) can be considered the structural SLP of leaves.
4.Discussion
In agreement with previous results [10,15,16], P deficiency under low P supply(P0)reduced maize yield via reduction in grain number per ear(Fig.2e)rather than in kernel size(biomass of 100 kernels, Fig.2f).The finding that P deficiency did not affect the overall partition of biomass and P among different plant organs is consistent with the framework used in current crop models such as APSIM and with observations for crops including wheat[18]and soybean [19].Amanullah and Inamullah (2016) also reported that the proportion of biomass partition into different rice plant parts at different growth stages was independent of P fertilization rate[20],though affected by rice cultivar.Reduction in both grain yield and kernel number appeared to be caused by reduction in biomass accumulation.P deficiency reduced leaf size and leaf lifespan(Figs.S4, 6), but the absence of biomass re-translocation to grain under P0 treatment indicates that leaf photosynthesis per unit area was largely maintained under P-limiting conditions and that the reduction in biomass and yield was due mainly to reduced leaf size and leaf area.
ZD958 showed the stay-green trait [21], with much lower leaf senescence (0.00025 leaves/Cd) than previous maize cultivars characterized in the APSIM model (0.00035 leaves/Cd).The different leaf senescence rate needs to be updated for correct simulation of leaf longevity together with the effect of P deficiency on leaf lifespan.The stay-green property of this maize cultivar with longer duration of post-silking photosynthesis can lead to a greater biomass supply to both shoot and root,contributing to larger P uptake by the plant [22-24], further increasing grain yield [25].Owing to the relatively large green leaf area and delayed leaf senescence after silking, there was no biomass re-translocation to grain from vegetative organs,and half of the total plant biomass was accumulated at the grain growth and grain-filling stage after silking,meeting the grain demand for biomass.Compared to the staygreen maize cultivar used in a previous study [26], in which 5%-14% of grain biomass was derived from remobilization, older cultivars showed 19%-34% of grain biomass derived from remobilization of carbon accumulated pre-silking.
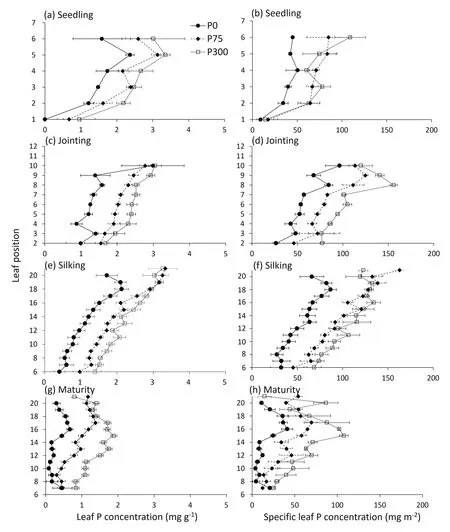
Fig.7.Individual leaf P concentrations(mg g-1)and specific leaf P concentrations(mg m-2)as a function of leaf position at seedling stage(a,b),jointing(c,d),silking(e,f),and maturity (g, h) in 2017.Bars represent standard error of the mean of four replicates (n = 4).
In contrast to biomass, 70% of P in stems and leaves of the experimental cultivar was re-translocated to grain, accounting for 25% of grain P (Fig.4; Table S1) and around 75% of P uptake was accumulated at the grain growth and grain-filling stage after silking.Masoni et al.[27]reported that more than 50%of P was remobilized from senescence leaves, which can contribute to 56%-63%of grain P in wheat.This finding is also consistent with another[22] that more than 59%-66% grain P was derived from postsilking biomass or P accumulation in several maize cultivars.
In individual leaves, remobilization of biomass from leaves occurred in dead and partially dead leaves via reallocation rather than re-translocation of reserves from live leaves.In contrast,remobilization of P was largely from live leaves via retranslocation of P reserves.The minimum amount of residual P in leaves under P0, the increasing amount of residual P in individual leaves, and the higher amount of P in stems under P75 and P300 imply that the plant always used the resources from senescing organs (by reallocation), together with assimilation (biomass)and uptake(P), and used the reserve last via re-translocation.This finding confirms the validity of priority setting in allocating resources in the arbitrator of Brown et al.[8].
Our finding of no difference in biomass growth and grain yield of maize between P75 and P300 treatments was in agreement with previous findings [13,20] in a similar growing location where application of 75 kg P2O5ha-1and above (corresponding to 7.5 mg kg-1and higher Olsen-P concentration in the 0-20 cm soil layer)resulted in no additional response in leaf area,ear growth,or grain yield.In contrast to P300,P75 reduced only P content in individual leaves,not leaf biomass or size(Figs.5,6,S4).We infer that P concentrations observed in P75 were close to critical P concentrations.The critical P concentration for individual leaves was 0.25%-0.30% (Figs.7a, c, S6), corresponding to a SLP of 75-100 mg P m-2(Fig.7b, d).We can thus define the critical P concentrations for maize and modify the maximum and residual P concentrations in APSIM(Fig.6).These new values can be further used to parameterize the organ arbitrator [8] for structural and critical P demand of organs and simulate luxury P status of maize under excess P supply.
5.Conclusions
A representative cultivar showed contrasting patterns of accumulation,partitioning,and remobilization of biomass and P among different organs under three P supply conditions.The much slower rate of leaf senescence than those of many old cultivars allowed the accumulation of enough photosynthate to meet the biomass demand of all organs including grain, resulting in little or no retranslocation of biomass reserves from leaves and stems.In contrast, post-silking P uptake accounted for 58%-75% of total P uptake and was not able to meet grain P demand, causing retranslocation of P reserves from both stems and leaves.Postsilking P uptake accounted for 75% of grain P, with the remaining 25% from re-translocation.Of the total P re-translocation, 70%was from stem and 30% from leaves, with leaves closer to the ear contributing most P and also showing the longest lifespan.The critical leaf P concentration for individual leaves was estimated as 0.25%-0.30%, with a corresponding specific leaf P (SLP) of 75-100 mg P m-2.The structural P concentration for leaves was 0.01%, corresponding to a SLP of 3.8 mg P m-2.The maximum P concentrations of leaves and stems were 0.33 and 0.29%.The residual P concentrations for stems and cob plus husk were 0.006%and 0.009%, respectively.These numbers can help in deriving parameters in crop models for simulation of P demand, uptake, partition,and remobilization processes.
CRediT authorship contribution statement
Weina Zhang:performed the experiments and analyzed the data.Haigang Li, Enli Wang and Hamish Brown:conceived the idea.Haigang Li, Enli Wang, Hamish Brown, Jianbo Shen, and Junling Zhang:critically revised the article.All authors read and approved the final manuscript.
Declaration of competing interest
The authors declare that they have no known competing financial interests or personal relationships that could have appeared to influence the work reported in this paper.
Acknowledgments
This study is financially supported by the National Key Research and Development Program of China (2017YFD0200200,2017YFD0200202) and the National Natural Science Foundation of China (31960627).We also acknowledge the support from the Australia-China Joint Research Centre-Healthy Soils for Sustainable Food Production and Environmental Quality (ACSRF48165), and the CSIRO and Chinese Academy of Agricultural Sciences (CAAS)through the research project ‘‘Scientific Benchmarks for Sustainable Agricultural Intensification” for financial support.
Appendix A.Supplementary data
Supplementary data for this article can be found online at https://doi.org/10.1016/j.cj.2021.02.014.
杂志排行
The Crop Journal的其它文章
- Brief Guide for Authors
- Heavy soil drying during mid-to-late grain filling stage of the main crop to reduce yield loss of the ratoon crop in a mechanized rice ratooning system
- GmNMHC5 may promote nodulation via interaction with GmGAI in soybean
- H2O2 mediates transcriptome reprogramming during Soybean mosaic virus-induced callose deposition in soybean
- TaMADS2-3D, a MADS transcription factor gene, regulates phosphate starvation responses in plants
- Calcineurin B-like protein 5 (SiCBL5) in Setaria italica enhances salt tolerance by regulating Na+ homeostasis
