Proposal of a new T-stage classification system for ampullary carcinoma based on Surveillance, Epidemiology and End Result (SEER)database
2022-01-07ShiJieWangYiFeiLiShanLiaoYouZhuWeiYanMingZhou
Shi-Jie Wang, Yi-Fei Li, Shan Liao, You-Zhu Wei, Yan-Ming Zhou
Department of Hepatobiliary and Pancreatovascular Surgery, First Affiliated Hospital of Xiamen University, Xiamen 361003, China
Keywords:Ampullary carcinoma Cancer staging SEER
ABSTRACT
Introduction
Ampullary carcinoma (AC) is a relatively rare malignancy, accounting for approximately 16% -28% of all periampullary cancers [1] . Early detection of the symptoms can greatly increase the resectability rate of AC and thus offer a comparatively favorable prognosis compared with other periampullary cancers [2] .
Several variables, including tumor size, distant metastasis,histologic grade and lymphovascular invasion have been reported to be predictors of postoperative outcomes of most solid tumors [3-5] . The current 8th edition of the American Joint Committee on Cancer (AJCC) staging system for AC has some improvements over previously used editions in terms of lymphovascular invasion and the number of regional metastatic lymph nodes [6] .However, there exist some limitations in the current AJCC staging system. For instance, it is usually difficult to distinguish T2 (invasion into the duodenal wall) from T3 (invasion into the pancreas)due to the presence of the lobulated pancreatic tissue on the interface of the pancreas-ampullary-duodenal wall. Clinically, the preoperative T-classification accuracy of AC is only about 26.1% for computed tomography scanning and 53.8% for magnetic resonance imaging [7] . In addition, some important factors including tumor size that affect survival in prognosis assessment models are still not taken into consideration, even though tumor size usually represents a major predictor of oncological outcomes and a crucial aspect in the tumor-node-metastasis (TNM) staging system for solid tumors. Moreover, it is easy to obtain the tumor size from crosssectional imaging and tumor size can be utilized as a direct and reliable parameter to help make a clinical decision even for relatively inexperienced gastrointestinal clinicians [8] . Taking pancreatic head carcinoma for example, the surgical procedures for most periampullary cancers are the same as those for AC. The criterion for invasion depth has been removed from the latest 8th AJCC staging system for pancreatic cancer. Instead, the maximum diameter of the tumor is used and therefore a better discriminative ability is obtained [9] . However, the role of tumor size in T-classification of AC has not been delineated.
The aim of the present study was to clarify the prognostic significance of tumor size in prognostic assessment of AC and propose a new T-stage classification system.
Methods
Data source and study cohort
Data were extracted from the Surveillance, Epidemiology, and End Results (SEER) database of the U.S. National Cancer Institute.SEER, a population-based cancer registry, collects demographic,clinical and survival data as open-access resources based on approximately 34.6% of the U.S. population at present [10] .
All patients were identified with radically resected and histologically confirmed AC between 2004 and 2015. The International Classification of Diseases for Oncology (third edition) (ICD-O3) was utilized to identify the ampulla of Vater using site code C241. Although multiple classifications of histologic tumor types have been reported in the SEER database, histology codes 8140, 8010, 8210,8260, 8261, 8263, 84 80 and 84 90 were used for specific identification of AC patients in this study, knowing that they represent the overwhelming majority of diagnostic entities. Radical resection was indicated as code 60, which was defined as total resection of the primary lesion and adjacent organs. Obtainable data included age,sex, histologic grade, race, AJCC clinical stage, T-stage, N-stage, Mstage, treatment types, regional nodes examined, positive regional nodes, tumor size, depth of invasion, survival time and vital status. The exclusion criteria were patients with unknown tumor size and unclear depth of invasion, and those who had an insufficient number of regional nodes examined (<12) as required by the AJCC staging system manual.
Statistical analysis
Survival curves were estimated using the Kaplan-Meier method and compared by the log-rank test. Factors withP<0.1 in univariate analysis were subjected to multivariate Cox proportional hazard models to identify independent risk factors. AP<0.05 was regarded as statistically significant. The optimal cutoff point of tumor size was chosen using X-tile software. The predictive accuracy of the staging systems was evaluated by calculating the concordance index (c-index). A c-index means that chance alone is predictive as the staging system, while a 1.0 level indicates perfect concordance. Statistical analysis was performed by IBM SPSS Statistics 23 (IBM Corp., Armonk, NY, USA) and R software (version 3.0.1;http://www.Rproject.org ).
Results
Patient characteristics
Data were collected from a total of 1080 AC patients who underwent radical surgical resection between 2004 and 2015. The clinicopathologic characteristics are presented in Table 1 . The meanage of the 1080 included patients was 64.7 ± 11.4 years, including 618 (57.2%) male patients. Of the 1080 cases, well/moderately differentiated AC was detected in 654 cases (60.6%), and lymph node metastasis was detected in 647 cases (59.9%). The median survival was 38 months, with the 1-, 3- and 5-year overall survival (OS) of 81.1%, 51.4% and 41.2%, respectively.

Table 1 Patient demographic and clinical characteristics ( n = 1080).
Optimal cutoff points for tumor size
X-tile plots showed that the optimal cutoff point of tumor sizes were 1.3 and 2.8 cm ( Fig. 1 ). Therefore, we divided the tumor size into three categories by using 1.0 and 3.0 cm as an integer divider (a, ≤1 cm; b,>1 but ≤3 cm; and c,>3 cm). Significant differences in OS were observed between the groups (P<0.001) and pair-wise comparisons of a vs. b (P= 0.001), and b vs.c (P= 0.006).
Proposal of a new T-stage classification system
We selected statistically significant variables to develop a new staging system. Depth of invasion was shown as another important independent predictor of OS in both univariate and multivariate analyses ( Table 2 ). Therefore, various combinations of tumor size and depth of invasion were compared in four groups based on survival ( Table 3 ). T1, T2, T3 and T4 were defined respectively as patients with maximum tumor diameter ≤1 cm;>1 but ≤3 cm;>3 cm or invasion to peripancreatic soft tissue; and tumor invasion to blood vessels or other adjacent organs or structures, respectively.
Survival comparison based on the T-stage classification system

Fig. 1. X-tile analysis of survival data from the SEER registry. X-tile analysis was done on patient data from the SEER registry, equally divided into training and validation sets. The optimal cutoff point highlighted by the black circle ( A ) is shown on a histogram of the entire cohort ( B ), and a Kaplan-Meier plot ( C ). P values were determined by using the cutoff point defined in the training set and applying it to the validation set.
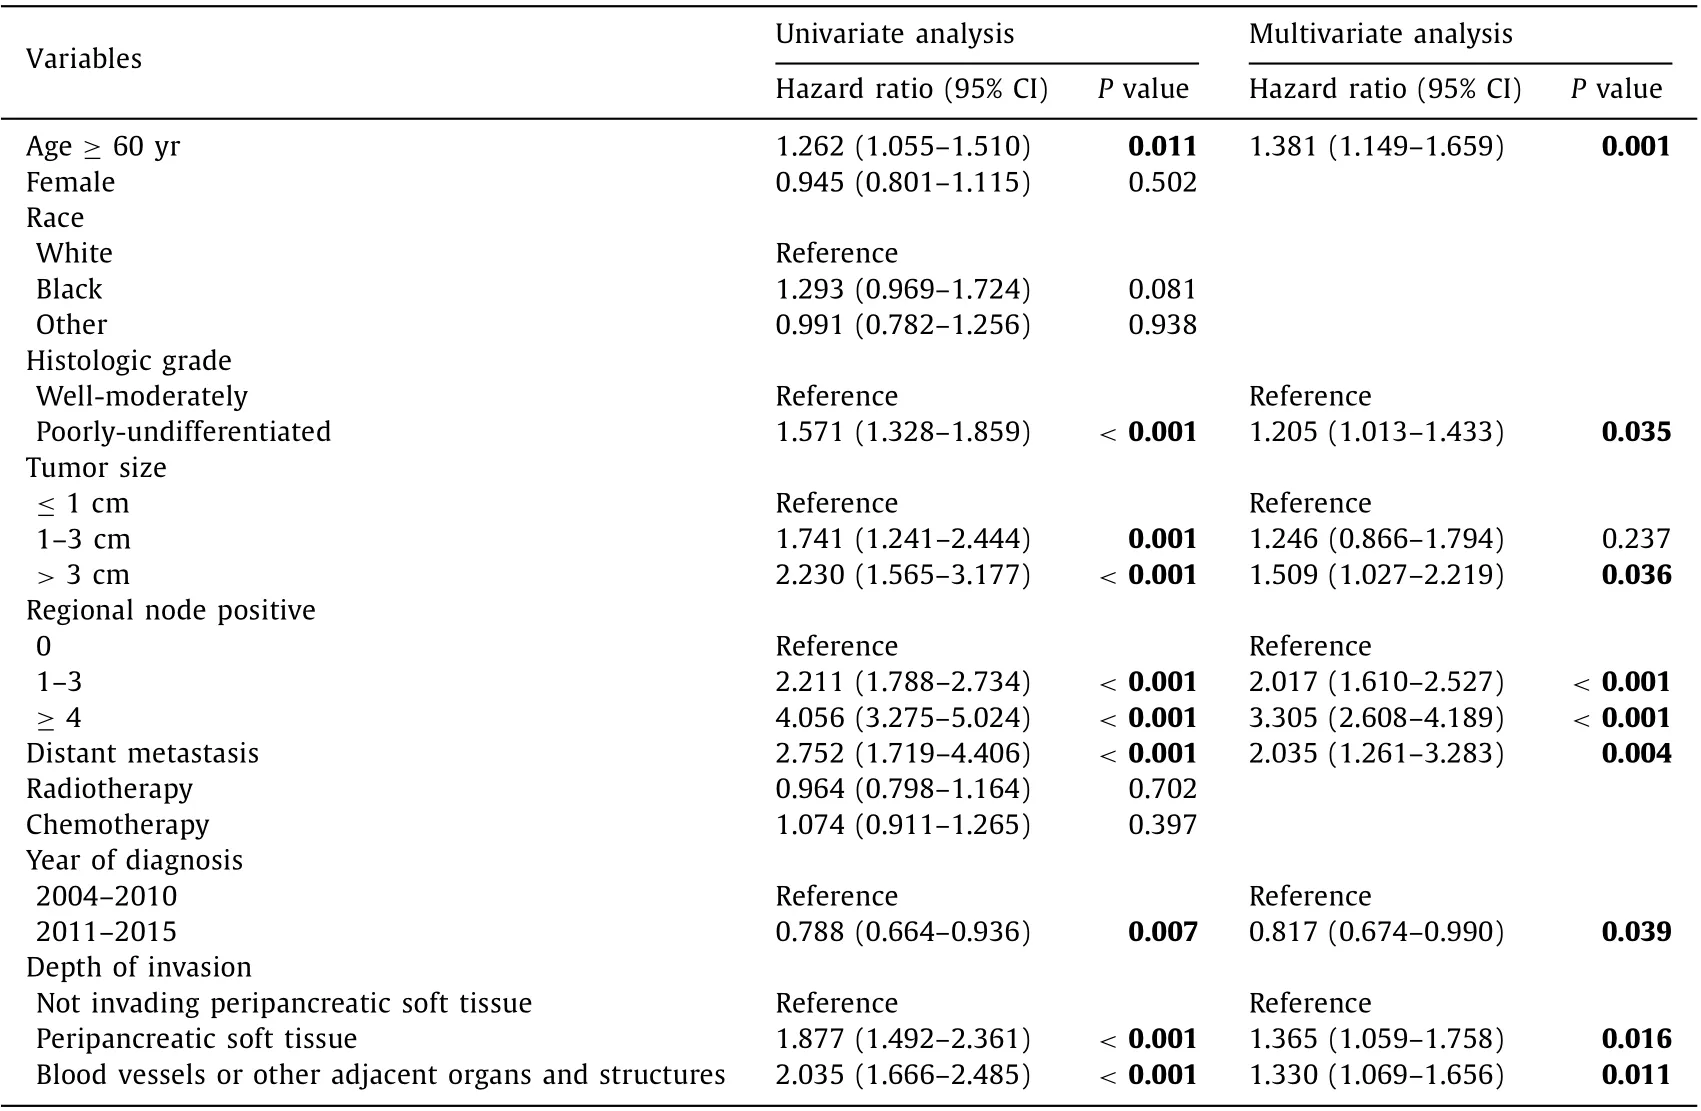
Table 2 Univariate and multivariate analyses for risk factors associated with overall survival.

Table 3 Comparisons of the AJCC 7th edition T-stage classification system and the new proposed T-stage classification system for ampullary carcinoma.
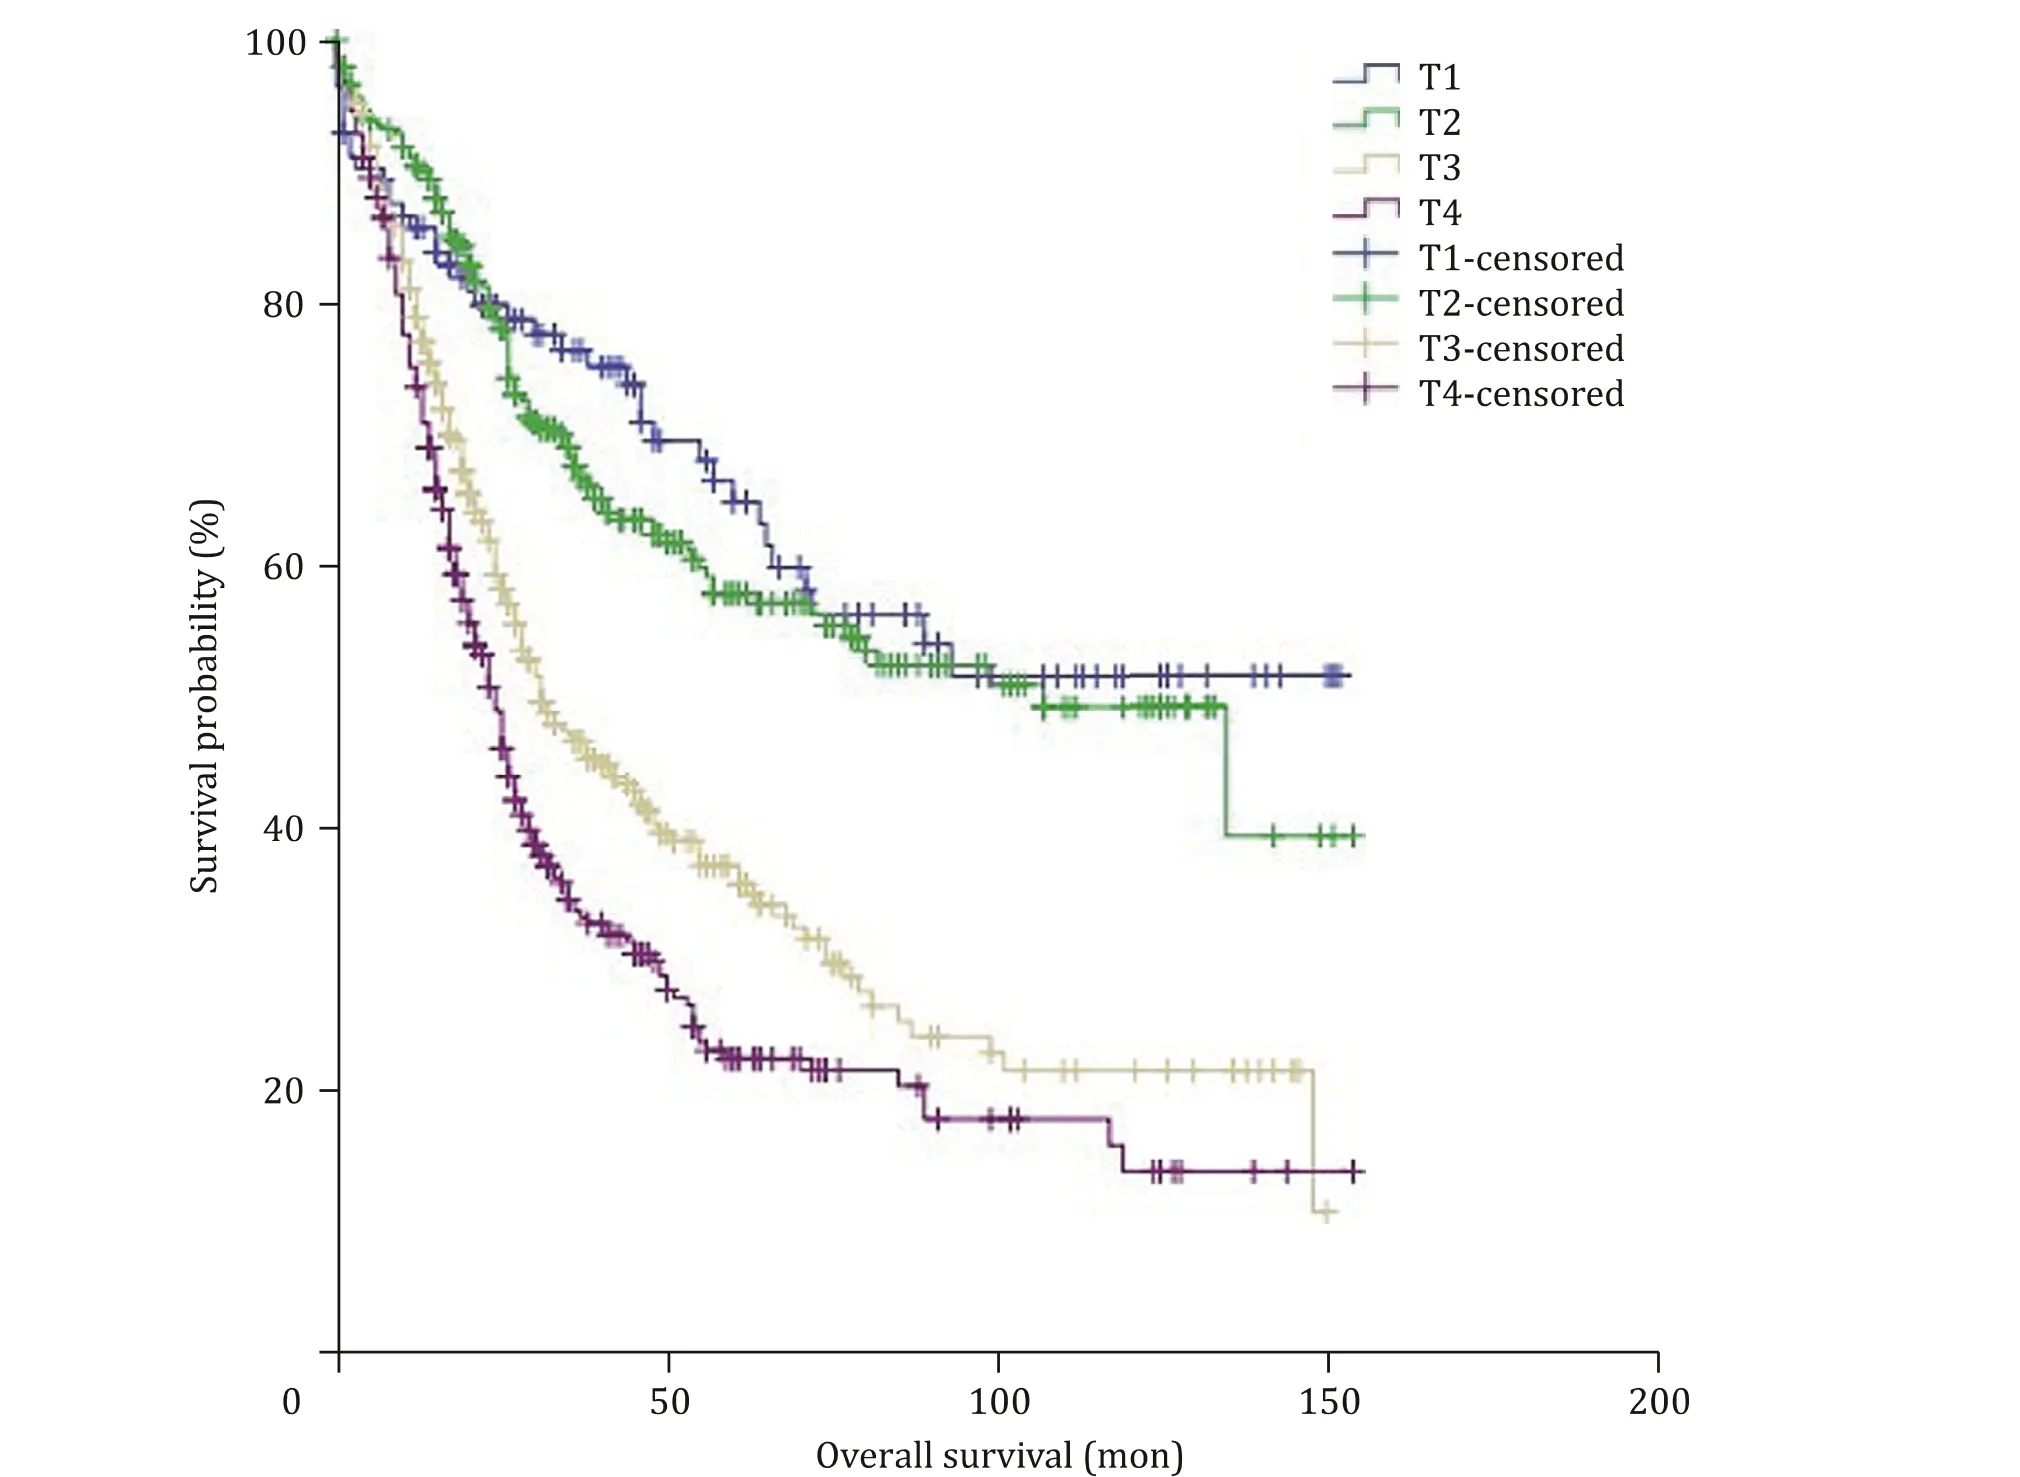
Fig. 2. Overall survival in patients with ampullary carcinoma according to the 7th AJCC T-stage classification system; survival differences were noted both in overall comparison ( P < 0.001) and pair-wise comparisons between T2 vs. T3 ( P < 0.001), and T3 vs. T4 ( P = 0.002), but not between T1 vs. T2 ( P = 0.498).
Patients were classified based on both the 7th edition AJCC Tstage classification system and the new T-stage classification system independently. According to the 7th AJCC staging system,there were 113 (10.5%) T1, 297 (27.5%) T2, 336 (31.1%) T3 and 334(30.9%) T4 cases. Kaplan-Meier survival curve according to the 7th edition AJCC T-stage classification system is depicted in Fig. 2 . The 5-year OS rates of patients with T1, T2, T3, and T4 were 64%, 57.3%,35.8% and 22.2% respectively, showing a significant difference in OS between the groups (P<0.001). Similarly, significant differences were also shown in the pair-wise comparisons of T2 vs. T3 tumors(P<0.001) and T3 vs. T4 tumors (P= 0.002), but no significant difference in OS was elicited from the comparison of T1 vs. T2 tumors (P= 0.498).
According to the new proposed T-stage classification system,there were 96 (8.9%) T1, 482 (44.6%) T2, 324 (30.0%) T3 and 178(16.5%) T4 cases. Kaplan-Meier survival curve according to this new classification system is depicted in Fig. 3 . The 5-year OS rates of patients with T1, T2, T3, and T4 were 58.4%, 47.8%, 37.8% and 21.0%,respectively, showing a significant difference in OS between the groups (P<0.001), and the significant differences were also shown in pair-wise comparisons of T1 vs. T2 tumors (P= 0.032), T2 vs. T3 tumors (P<0.001) and T3 vs. T4 tumor (P= 0.003). These results demonstrated that the new proposed T classification system for AC could stratify patients more accurately in terms of prognosis.

Table 4 Proposed a new staging system of ampullary carcinoma.
Proposal of a new AJCC staging system
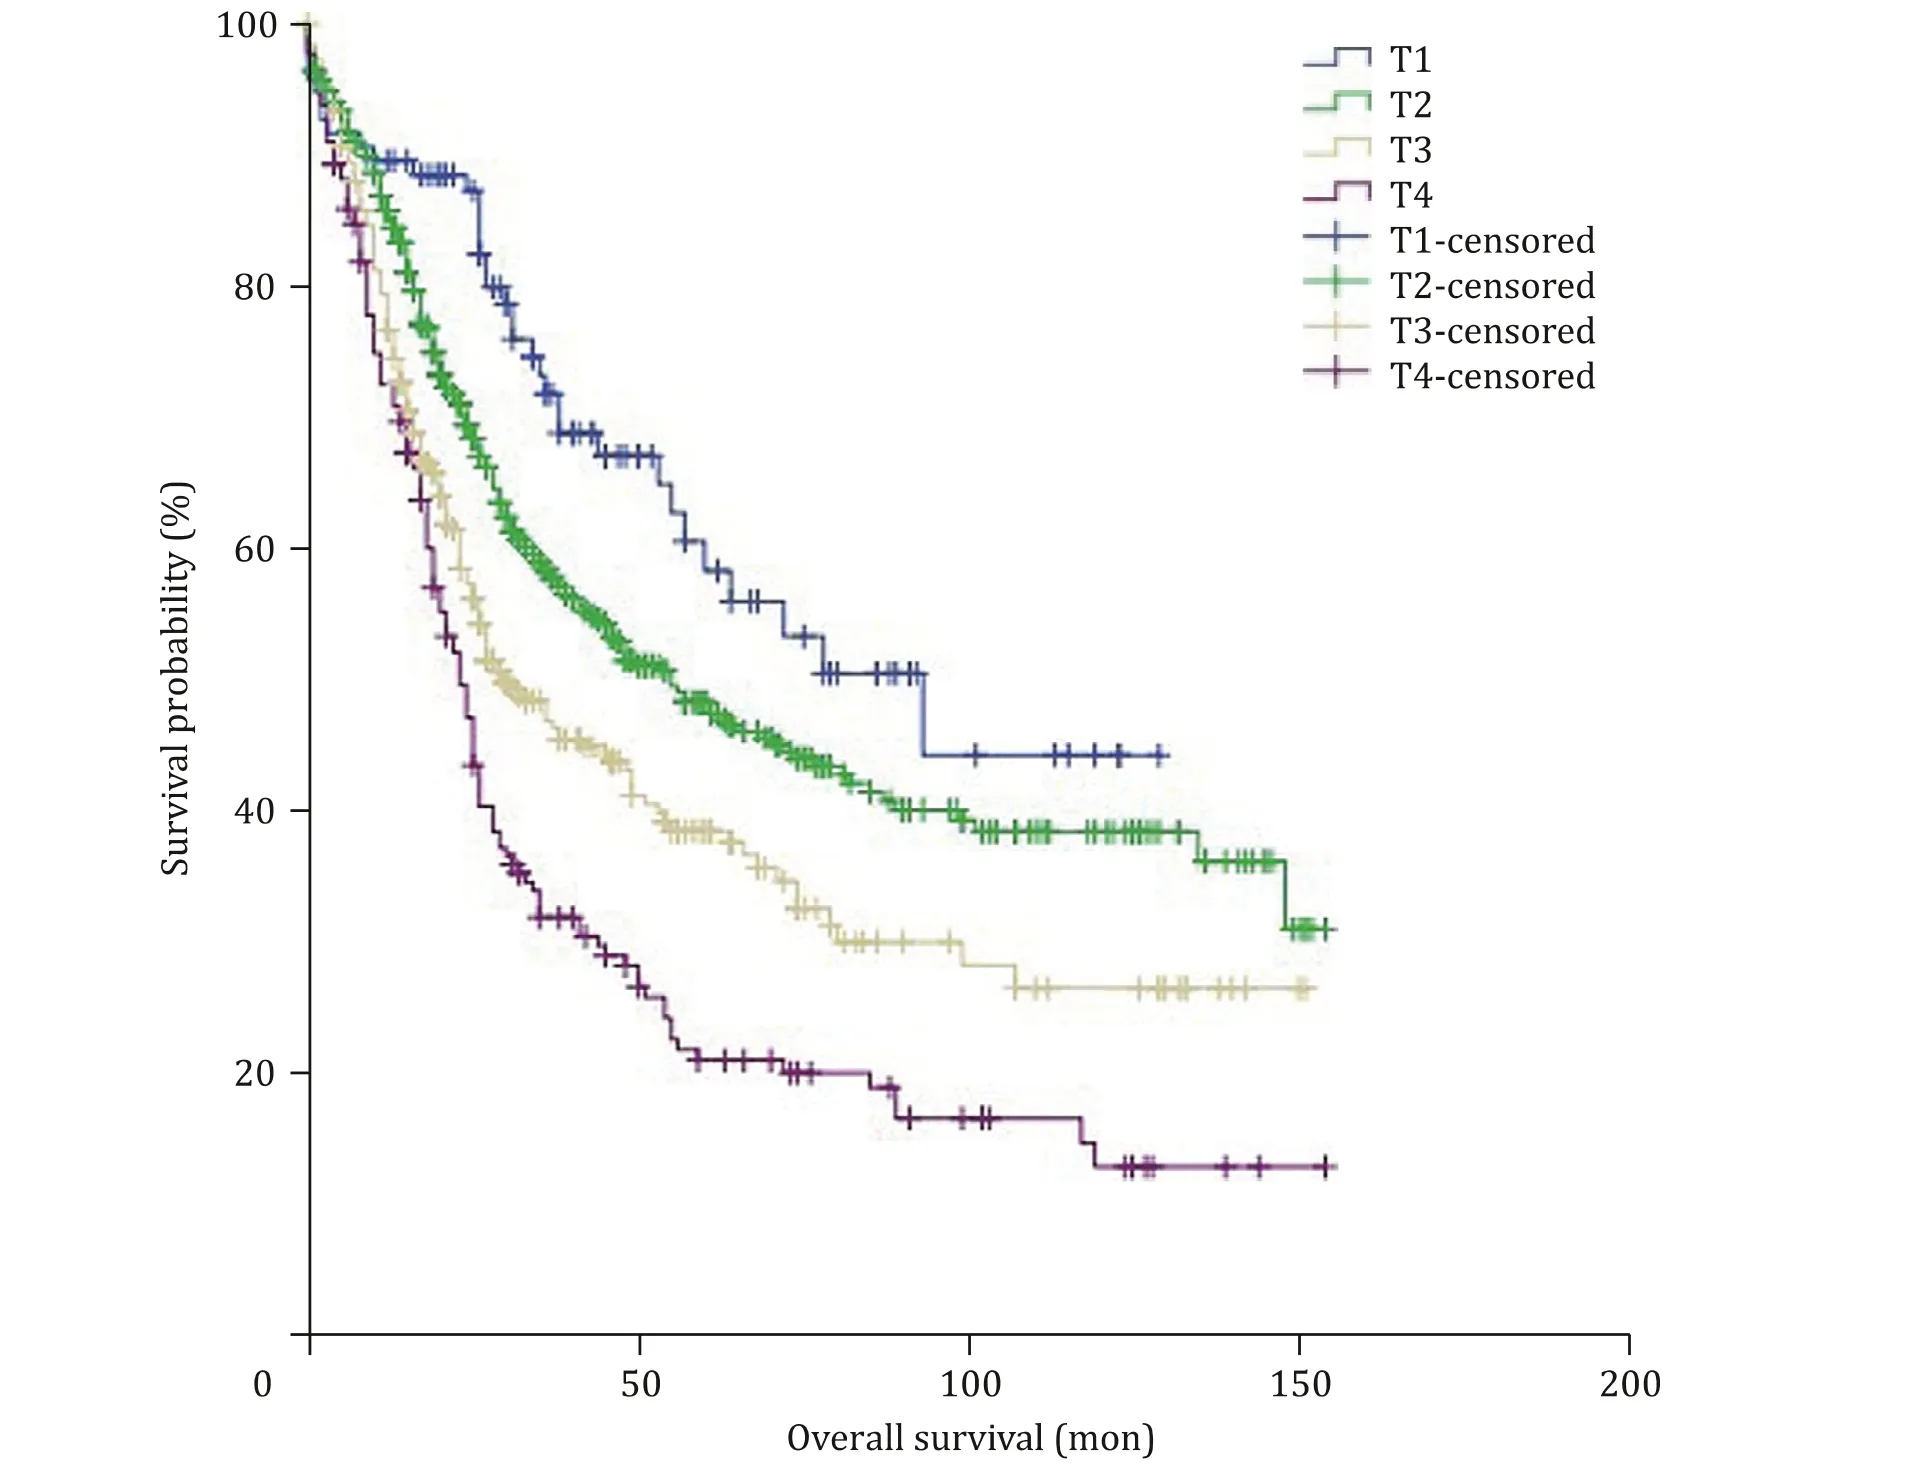
Fig. 3. Overall survival in patients with ampullary carcinoma according to the new proposed T-stage classification system; survival differences were observed among all groups ( P < 0.001) and pair-wise comparisons of each group (T1 vs. T2, P = 0.032; T2 vs. T3, P < 0.001; T3 vs. T4, P = 0.003).
By modifying the current 8th edition AJCC staging system, a new staging system for AC is displayed in Table 4 . Stage grouping was compared between the 7th edition of the AJCC stage classification system and the new proposed staging system. According to the 7th AJCC staging system, there were 87 (8.1%) IA, 168 (15.6%)IB, 113 (10.5%) IIA, 366 (33.9%) IIB, 325 (30.1%) III and 21 (1.9%) IV cases, showing a significant difference in OS between these groups(P<0.001). While according to the new proposed staging system,there were 70 (6.5%) IA , 214 (19.8%) IB, 107 (9.9%) IIA , 303 (28.1%)IIB, 365 (33.8%) III and 21 (1.9%) IV cases, showing a significant difference in OS between these groups (P<0.001). The c-index was calculated to evaluate the predictive accuracy, finding that the c-index for the new proposed staging system was 0.653 (95% CI:0.629-0.677) vs. 0.636 for the 7th AJCC staging system (95% CI:0.612-0.660), indicating that the new proposed staging system was slightly better than the 7th edition AJCC staging system in survival discrimination.
However, the slightly improved discrimination may be due to the use of the modified nodal stage (N0, no positive node; N1, 1-3 positive nodes; and N2, ≥4 positive nodes) of the 8th edition staging system, which may provide more accurate survival estimates than N-stages of the 7th edition. We then revised the 7th edition by replacing the T-stage with the corresponding proposed T-stage.The c-index for the revised 7th edition was 0.650 (95% CI: 0.590-0.610), which was also better than 0.636 of the 7th edition. These findings further validated the accuracy of the proposed T-stage.
Discussion
Reliability and accessibility should be essential elements in establishing factors predicting the prognosis of cancer patients. Tumor size has been generally accepted as a key predictor of prognosis because it can be easily and accurately obtained using routine imaging techniques. In the currently available staging systems, local extension of AC is considered an important classification factor for the T classification system. However, the role of tumor size has not been verified in staging. Emphasizing the role of tumor size in T classification will facilitate preoperative evaluation and can be used easily by general surgeons.
The inclusion of tumor size in the AJCC staging system is not unprecedented. It is often regarded as an important parameter for T classification of many malignancies such as breast, renal, and lung cancers [11] . Previous studies from single institutions have reported that tumor size is an independent prognostic factor for AC [ 3 , 4 , 12-14 ]. Di Giorgio et al. [15] examined 94 surgically resected tumors of Vater’s ampulla and reported that the 5-year OS in patients with tumors<2 cm was significantly higher than that in patients with larger tumors. Böttger et al. [12] observed that patients with tumors>1 cm had a worse survival rate than those with tumors ≤1 cm in a study of 32 surgically resected cancer of Vater’s papilla. Similarly, Song et al. [14] reported the same cutoff size of 1 cm in 89 patients with early AC. However, the number of patients included in these studies was not large enough and the cutoff points were selected arbitrarily. In contrast, the present study analyzed each possible cutoff point of tumor size systematically and utilized the population-based SEER database involving a large number of patients. Analysis of the 1080 AC patients in our series demonstrated that the cutoff size of 1 and 3 cm in maximum tumor diameter could best differentiate the survival of AC patients. In addition, patients with smaller tumors had significantly better prognosis, and the median survival of patients with tumor size ≤1 cm,>1 but ≤3 cm, and>3 cm were 79, 40 and 26 months, respectively. Meanwhile, multivariate analysis also identified tumor size as a significant prognostic factor for survival.
Depth of tumor infiltration has long been thought to be closely associated with survival of cancer patients, which is of great value in predicting patient survival [ 16 , 17 ]. A previous study showed that peripancreatic soft tissue invasion was an independent prognostic factor of survival [18] , which was further confirmed in our study.However, there was no significant difference in OS between patients with tumors larger than 3 cm without peripancreatic soft tissue invasion and those with tumors smaller than 3 cm but with peripancreatic soft tissue invasion (P= 0.191). For this reason, we merged the two groups in the same T-stage.
Comparison of the overall discrimination between the 7th AJCC stage classification system and our newly established staging system showed that the new system had better discriminatory power,showing a higher c-index than the AJCC T system (0.653 vs. 0.636).However, because of lack of effective information, we classified the extent of local disease of the patients using the 7th AJCC Tstage classification system instead of the 8th edition. Even so, Kim et al. [19] , reported that the 8th AJCC T-stage system for AC classification showed no better prediction of prognosis than the 7th edition, implying that our new T classification system may be superior to the 8th edition AJCC T system.
Without doubt, the present study has several limitations. First,we did not perform a direct comparison between the latest 8th edition AJCC staging system and our new staging system because we were unable to retrieve sufficient information about variables in the 8th edition AJCC from the SEER database. Notably, SEER does not record some important variables associated with survival, including the margin status, perineural invasion, lymphovascular invasion and histologic subtype. We were also unable to evaluate the role of adjuvant therapies. Currently, there is no clear practical guideline for adjuvant therapies for AC. A recent study from Mayo Clinic involving 121 patients reported that patients with advanced stage disease (stage IIB or higher) may have survival benefit from adjuvant therapy [20] . Finally, the new staging system was based on the survival of patients who underwent radical surgical resection only. More studies are required to assess survival by including both patients undergoing local surgical resection and those receiving nonsurgical treatment.
In conclusion, by incorporating tumor size and depth of tumor infiltration, the new proposed T-stage classification system described herein can better differentiate patient outcomes after radical resection. If this conclusion can be further validated and confirmed by more future studies, we extravagantly expect that it could be considered in formulating the new edition of the AJCC staging system for AC in future.
Acknowledgments
We thank Dr. Yan-Fang Zhao (Department of Health Statistics,Second Military Medical University, Shanghai, China) for her critical revision of the statistical analysis section.
CRediT authorship contribution statement
Shi-Jie Wang: Formal analysis, Methodology, Writing - original draft. Yi-Fei Li: Formal analysis, Writing - original draft. Shan Liao:Data curation. You-Zhu Wei: Data curation. Yan-Ming Zhou: Conceptualization, Funding acquisition, Supervision, Writing - review& editing.
Funding
This study was supported by a grant from the Foundation of Xiamen Science and Technology Bureau ( 3502Z20174074 ).
Ethical approval
Not needed.
Competing interest
No benefits in any form have been received or will be received from a commercial party related directly or indirectly to the subject of this article.
杂志排行

Hepatobiliary & Pancreatic Diseases International的其它文章
- Hepatocellular-cholangiocarcinoma with sarcomatous change:Clinicopathological features and outcomes
- Recent advances in immunotherapy for hepatocellular carcinoma
- Toll-like receptors and hepatitis C virus infection
- Involvement of the circular RNA/microRNA/glucose-6-phosphate dehydrogenase axis in the pathological mechanism of hepatocellular carcinoma
- Progress in hepatitis B virus-related acute-on-chronic liver failure treatment in China: A large, multicenter, retrospective cohort study using a propensity score matching analysis ✩
- From conventional two-stage hepatectomy to ALPPS: Fifteen years of experience in a hepatobiliary surgery unit