Study of Speed Effect on Large Ship Prone to Springing Based on Model Test
2021-12-31,-,
,-,
(Shanghai Merchant Ship Design&Research Institute,Shanghai 201203,China)
Abstract: This paper describes the 400k VLOC model tests for fatigue damage considering springing effect. Based on comparison of the test results in two generations of 400k VLOC, the relationship between service speed and fatigue including hull girder springing is discussed.The results show that the exponential relationship between springing and vessel speed is variable and decreases very rapidly when the speed descends. Through defining the dominant sea state, the expression of vibration factor considering speed effect is proposed for initial estimation of the springing level.
Key words:springing;model test;fatigue
0 Introduction
Springing of a ship is the continual vibration of the hull girders as a consequence of the waves exciting at resonant hull girder frequencies. Moreover, if an elastic body is excited byntimes or at itsnth natural frequency, then this will result in oscillation of the body at its natural frequency as well as at the exciting frequency, these frequencies are a sub-harmonic or super-harmonic response,respectively.
Springing is an issue for ships with low natural vibration frequencies of bending or torsional modes,typically when the lowest natural frequency is less than 3 rad/s(≈0.5 Hz)and the ship speed is above 20 kn.This is the case for large container ships due to their high speed and open cross sections. Great Lakers are very prone to springing due to their low second moment of inertia and very highL/Dratio, resulting in low natural frequencies of vertical vibration modes. Full scale measurements have shown that very large ore carriers(VLOC)are also sensitive to springing.[1]
Moe et al (2005) and Storhaug et al (2003) have documented the comparison of the springinginduced fatigue with the conventional wave loading through measurements on blunt ships ranging from 18 000 DWT to 255 000 DWT. Fatigue damage from springing is considered to be the dominate source to fatigue damage on larger Great Lakes bulk carriers (Cleary et al 1971)[2]. These findings suggest that the current rules do not capture all effects, and in certain cases additional means may be necessary to ensure a satisfactory design.
The occurrence of springing of a ship can be predicted by hydroelastic ship motion programs,however the exact determination of the magnitude of springing response is more difficult when the non-linearities of the dynamic load response,e.g.intermittent wetting of the hull in way of the static waterline or nonlinear ship motion response in large waves,are also included.Since present numerical theories predict the wave induced vibration inaccurately (Storhaug at al 2003)[3],an empirical approach is chosen. Moe at al (2005)[4]suggested a procedure to estimate the additional fatigue damage from wave induced vibrations based on measurements on a large ore carrier trading in the North Atlantic(NA).
A method to measure the wave bending moment by a jointed model was developed by Lewis(1954)[5]. The first model experiment where the vibration damage was evaluated was carried out by Dudson et al (2001)[6]. Fatigue damage contribution from vibration was estimated to be 30%-45%in a few head and bow quartering sea states, but it was low in beam and following seas. However,model tests are only used on a few large and high value-added vessels for the cost-plus.
Fortunately,the 1st and 2nd generation of 400k VLOC have both undergone model tests to estimate the fatigue damage increase including hull girder springing loads and tests have been conducted two times in the same organization:Marintek.Some reliable and valuable conclusions can be obtained on springing effect for fatigue damage from the comparison between the two group results.
Two generations of 400k VLOC are almost the same in principle dimensions,deadweight,trading route,etc..Hence,the hydrodynamic loads will be similar as the test precondition.The most outstanding difference for the two generations of 400k VLOC model tests is the service speed. The 1st generation 400k VLOC was based on the same speed for cargo and ballast condition for test,while a higher speed was used in ballast condition for the 2nd generation 400k VLOC, which is believed to be more practical.That will be a good opportunity to assess the service speed effect for springing.
This paper will describe the preparation, procedure and results of the model tests. According to comparison of the fatigue damage in the two generation 400k VLOC,the relationship between service speed and fatigue including hull girder springing will be discussed.
1 Model test
Both the 1st and the 2nd generations of 400k VLOC model tests were carried out at Marintek.Since the model test plan and procedure are similar, this paper will just show these parts mainly based on the 2nd generation 400k VLOC for succinctness.Also,the differences of input data and results of two generations of 400k VLOC will be described in this chapter.
1.1 Preparation
For the model tests, Marintek requires various input data. In addition to the hull shape, they need the sea states and corresponding speeds.Further,the natural frequency of the 2-node vertical vibration mode is necessary for the design of the flexible joint.The description below is input to this process.
The sea states should be distributed in a regular pattern with respect to significant wave height,Hs,and zero up-crossing period,Tz,to allow for interpolation.Further,they should cover the main contribution to the fatigue damage. The latter should preferably include the vibration part,which is difficult without having a reliable tool to predict vibration, so it will be based on calculations without vibration,but using engineering judgment.
Based on calculation results, the selected sea states for the testing areHs=2.5 m, 4.5 m, 6.5 m and 8.5 m with periods of 7 s , 9 s, 11 s and 13 s, which gives a probability of occurrence of 39%,but a part damage of the wave frequency (WF) part of 89% for ballast condition. The situation is similar for full load condition.
Based on the selected sea states, the speed needs to be estimated, which is very important for the final results of the model test.
Estimation of the 1st generation 400k VLOC was based on Kwon’s method[7],which is not very good for higher sea states from about 6-7 m and upwards.Hence,this part of higher sea state speed was considered according to 220k ore carrier using measured speed over ground versus significant wave height. For practical purposes, the same speeds were considered for cargo and ballast conditions,and voluntary speed reduction was also included.
For the 2nd generation of 400k VLOC,we had received the results of the vessel Ore Dongjiakou (designed by SDARI and built by Rongsheng) for a 2-year period since August 2014, including the speed(calculated from the distance and time),losses caused by wave,wave height and direction for lower sea states (Hslower than 4.5 m). For higher sea states, it is suggested to refer to LR rule,75%VforHs=6.5 m and 50%VforHs=8.5 m.The estimated speeds will be slightly higher than those used for the 1st generation 400k VLOC model test, which are more conservative and acceptable.ForHs=4.5 m, an average value will be used based on the two methods mentioned above. Conclusively,the final 16 sea states and speeds for the two generation 400k VLOC are shown as Tab.1.

Tab.1 Sea states and relative speeds for two generation 400k VLOC
1.2 Procedure
Marintek has made a model with 5 flexible cuts, so that it vibrates like a real vessel, as shown in Fig.1.The model is made with adjustable flexible joints with a quality to ensure that the damping of the flexible modes, in particular the vertical 2-node mode, is similar to or lower that of a real ship. The adjustable joints are used to ensure that the natural frequency of springing is correct in ballast and cargo condition.One set of those tests are to investigate the springing effects on the hull girder vertical bending moment (VBM) in 16 short-term head sea states and their impact on the fatigue damage of the hull structure.

Fig.1 Ship model
A pair of curves is generated for each short-term condition. A typical time series is shown in Fig.2. The red curve contains the original VBM time series, which represents the response with springing effects.The black curve contains the low-pass filtered VBM time series, which represents the response without springing effects. The cutoff frequency should be set, which should be high enough to include the wave frequency response but low enough to exclude the vibration of any flexible mode[8].
Rain-flow counting is applied to obtain the hot spot stress range and calculate the fatigue damage rate. Then, 16 sea states are used to estimate the half-an-hour damage (38 min) for the wave frequency (WF) damage and high frequency (HF) damage for ballast and cargo conditions, respectively.It is found that the fatigue at the aft and forward quarter lengths is obviously less than that at the mid ship section,so fatigue in the mid ship will be considered as a concern.
1.3 Data adjustment
The model test is based on heading sea direction and long crested sea wave energy spreading,while the real vessel refers to all heading and short crested sea wave energy spreading.Vibration effect is reduced in full scale measurements compared with model test results. A correction must be made for 400k VLOC.
The adjustment from head sea to all headings with equal probability is made by using the response matrix method[9]. The scatter diagrams for the specific routes are used in ballast and cargo conditions, respectively. The calculations are performed both for 0-30 degrees and for 0 to 180 degrees,the former representing head seas and the latter all headings included with equal probability.For each of the two cases the ratio of total to WF damage is calculated.

Fig.2 Typical time series of VBM at Cut 3 with and without springing effects in cargo condition
To account for the effect of going from long crested to short crested in head sea, the statistical method is mainly based on comparing model test data with full scale vessel measurements with similar tonnage. This effect is considered as a lower limit and the real value is probably located somewhere in between, which can be determined by some factors such as seagoing directions bias, loading conditions and engineering experience,etc..
Conclusively, the reduction method and factor for adjustments are similar for two generation 400k VLOC,so this part would be considered equivalent for the final comparison.
1.4 Fatigue damage increase factor(Fvib)
As mentioned in Section 1.2, the wave frequency (WF) damage and high frequency (HF) damage for ballast and cargo conditions were estimated,then the relative effect of vibration (HF/Total)can be calculated.Since the data are ample,a typical plot atL/2 location for cargo condition is shown in Fig.3 for example:
It is clear that for each wave height the vibration effect reduces significantly and consistently for increasing wave periods while in each wave period the vibration effect reduces mildly for increasing wave height. Ballast and cargo show similar behavior, even though for cargo condition,the vibration part is less.
Combining these probabilities with fatigue damages have been shown in Figs.4-5 for ballast and cargo conditions.Figures show the WF and HF contribution separately,as well as their contribution to total fatigue damage. It is seen that the sea states capture the WF peak well,but the HF peak is less well captured.The total damage,which is shown in Fig.6,is also affected by the HF damage contribution.
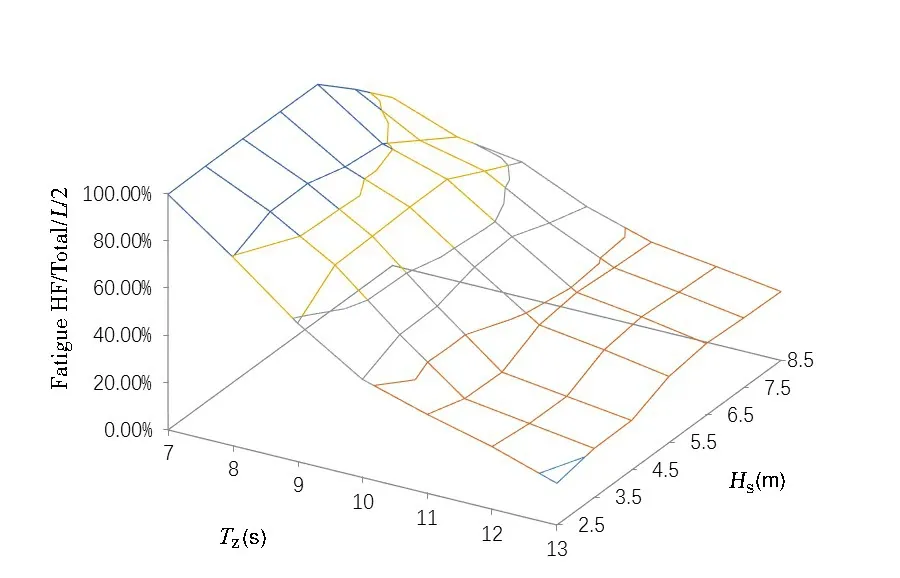
Fig.3 The relative effect of vibration(HF/Total)for cargo condition

Fig.4 WF damage contribution from the scatter diagram for cargo condition

Fig.5 HF damage contribution from the scatter diagram for cargo condition

Fig.6 Total fatigue damage from the scatter diagram for cargo condition
The process of reasoning is described as above. The fatigue damage increase factor can be expressed as a function based on model test data:

whereDtotalis total fatigue damage, including wave induced fatigue damage and springing induced fatigue damage in model test, andDwaveis wave induced fatigue damage in model test.
After data adjustment as we mentioned in Section 1.3, the final results ofFvibdue to hull girder springing for two generation 400k VLOC are shown as Tab.2.
2 Analysis

Tab.2 Fvib for two generations of 400k VLOC
It can be found thatFvibof the 2nd generation 400k VLOC for cargo condition is slightly larger than that of 1st generation, while in the ballast conditionFvibgives an obviously higher increase than that in the cargo condition compared with the 1st generation 400k VLOC results, the ratio will be 5.85/2.41=2.43.Ship speed is considered to be the dominant factor for this difference,since it is the most important difference between two loading conditions for two generations. The discussion below is about the relationship of ship speed withFvib.
2.1 Reasoning for high vibration level in ballast condition
An interesting phenomenon is thatFvibincreases significantly for the 2nd generation 400k VLOC compared with that of 1stgeneration 400k VLOC in ballast condition, but almost the same in cargo condition.
There are 3 factors affecting the finalFvibresults in the model test of this paper:Tz, moment of inertia about the horizontal neutral axis (Iyy) and speed. It is easy to find thatTzof the 2nd generation 400k VLOC is 0.5 Hz lower than that of 1st generation 400k VLOC as seen from Tab.1.It is of common knowledge that lower encounter periods induce higher springing effect.However,Iyyfor the 2nd generation 400k VLOC is higher than that of the 1st generation 400k VLOC (1 825 m4and 1 470 m4respectively). Larger hull girder stiffness brings lower springing effect. It seems that these two factors counteract each other.It is proved that the speeds are very close between the two generations of 400k VLOC in cargo condition, whileFvibresults are close to each other too. However, the different speeds between the two generations of 400k VLOC in ballast conditions makeFvibresults distinct widely.
The estimation of the speed for model test is considered to be a significant factor to impact the vibration level.Since the vibration will tend to increase faster when the vessel speed is at a high level, which is nonlinear relationship, while the major HF fatigue contribution comes from the lower sea states likeHs=2.5~4.5 m,which are high speed sea states.From Tab.1,it is easy to find that the vessel speed for model test is higher for the 2nd generation of VLOC than the 1st generation of VLOC in ballast condition, while the speed is almost the same in cargo condition of two generation of VLOC. This can explain whyFvibincreases significantly in ballast condition rather than in cargo condition for the 2nd generation 400k VLOC comparing with the 1st generation 400k VLOC.
On the other hand,larger hull girder stiffness of the 2nd generation of VLOC will bring a lower vertical bending moment,which decreases WF fatigue damage obviously.
For the 2nd generation 400k VLOC, HF fatigue is higher while WF fatigue is lower compared with those of the 1st generation 400k VLOC. Hence, the value ofFvib, which is equal to (HF+WF)/WF, will be obviously larger. That will be an important reason for the vessel vibrating significantly in ballast condition for the 2nd generation 400k VLOC.
16 sea states have been chosen for model test, covering the main contribution to the fatigue damage. This filtration is based on fatigue results at 2/3 service speed, both for ballast and cargo conditions.This service speed is based on cargo condition,this speed will be slightly lower than the actual speed in ballast condition.While the practical speeds used for model test in ballast condition are the‘actual’speeds as we estimated,the encounter frequencies of the test would be higher than those used in the calculation.Higher encounter frequencies tend to experience higher springing excitation.This will be another reason for the vessel vibrating significantly in ballast condition for the 2nd generation 400k VLOC.
2.2 Relationship of speed with Fvib
DNVGL had given aFvibexpression based mainly on full scale measurement data with some correction from model tests for ships with a block coefficient of about 0.8 and with a design speed of about 15 kn.It is supposed to cover a size range from about 170 m to 350 m in length.For ballast condition,theFvibis estimated as[10]:

whereBis moulded hull breadth,CBis block coefficient at scantling draught,Lppis length between perpendiculars,Zis hull girder section modulus, gross scantlings,Vis contract speed at design draft,andTis draught in loading condition.
Fvibwill be equal to 2.33 according to this formula for the 2nd generation 400k VLOC,which is quite underestimated compared with the model test result of 5.85.
Generally,if the speed is to be increased with 1 kn,the vibration level is considered to tend to increase with the speed squared[4,11]. This relationship can not cover the VLOC of over 300 meters obviously.
Since the speeds are changed in different sea states,it is suggested to calculateFvibrespectively to find the trend among different speeds. TheFvibchanges largely in ballast condition rather than in cargo condition between the two vessels, only theFvibin this condition had been calculated based on model test data for research. SinceTzof the 2nd generation 400k VLOC is 0.5 Hz lower than that of the 1st generation 400k VLOC generally as shown in Tab.1, the 1st generation 400k VLOC data had been post-processed by interpolation here for the same periods,which is more convenient for comparison with each other.See Tabs.3-4.

Tab.3 Fvib for the 1st generation 400k VLOC

Tab.4 Fvib for the 2nd generation 400k VLOC
The two generations actually both have a significant portion of HF fatigue damage from rather small sea sates aroundHsof 3.5 m, with short periods also apparently belowTzof 7.5 s, while the WF fatigue damage of these sea states normally has very little contribution to total fatigue excluding vibration.Based on these reasons,theFvibgrows very rapidly whenHsandTzdescend.
Comparison of the two groups shows thatFvibvalue,in the most critical HF fatigue damage sea states, is more sensitive to the speed change, which means even if the increase ratio of speeds are the same, the higher speed tends to bring much more HF fatigue damage than the lower. For example, in sea state withTzof 10.0 s andHsof 2.5 m,, the speed increase ratio is 15.4/14.5=1.1, while theFvibincrease ratio is about 7.8/2.9=2.6,so the exponential relationship betweenFvibincrease ratio and speed increase ratio will be log1.12.6=10. In sea state withTzof 10.0 s andHsof 6.5 m, this value will be log1.32.9=4,and in sea state withTzof 10.0 s andHsof8.5 m,this value will be log1.451.6=1.26.Based on these data,the exponential relationship value is variable and decreases very rapidly when speed descends. It is not very reasonable to estimate theFvibat design speed, since the exponential relationship value at high speed becomes too sensitive and the vibration level cannot be considered increasing with the speed squared simply.
2.3 Assessment of Fvib based on dominant sea state
The dominant sea state is defined as the sea state which has the maximum contribution to WF fatigue damage. Also, the dominant sea state is the center of 16 sea states for model test we mentioned above,which is the most important sea state cell in the scatter for us to estimate theFvib.
The dominant sea states areHs=5.5 m,Tz=10 s for the 1st and 2nd 400k VLOC respectively.In Tabs.3-4, the corresponding values, which will be named‘dominantFvib’, are 2.2 and 5.8. It is easy to find that the dominantFvibof the 1st and the 2nd 400k VLOC are very close to the actual model testFvibvalues respectively (2.41 and 5.85). A similar phenomenon is presented in another 325k VLOC,2.84 for dominantFviband 2.71 for actualFvib[12].
For more initialFvib, we can even improve DNVGLFvibexpression to meet the model testFvibvalue based on data fitting,‘V’in the expression will be set to dominant sea state speed at design draft (kn). In case ofHs=5.5 m,Vequals 10 kn and 12 kn in ballast condition for the 1st and the 2nd 400k VLOC respectively.TheFvibis estimated as:

In case ofHs=5.5 m,Vequals 10 kn and 11 kn in cargo condition for the 1st and the 2nd 400k VLOC respectively.
A comparison was carried out among theFvibvalues of model test,improved function and original function.See Tabs.5-6 and Figs.7-8.It is found that the improvedFvibfunction meets the model test value well,which revises the originalFvibvalue prominently.

Tab.5 Comparison of 3 Fvib values for the 1st generation 400k VLOC

Tab.6 Comparison of 3 Fvib values for the 2nd generation 400k VLOC

Fig.7 Comparison of 3 Fvib values for the 1st generation 400k VLOC

Fig.8 Comparison of 3 Fvib values for the 2nd generation 400k VLOC
3 Conclusions
Based on comparison of the test results of two generations of 400k VLOC, the relationship between speed and fatigue including hull girder springing had been investigated. The vessel speed is an important factor for springing effect of a large ship. Separate conclusions derived from the study are outlined in the following:
(1) There is exponential relationship between the vibration level and the vessel speed, which is variable and decreases very rapidly when the speed descends.
(2) The concept of‘dominant sea state’established can represent primary sea state of current model test.
(3) The improved DNVFvibrevised by referring to model test data of 400k VLOC meets the model test value well based on dominant sea state method.
Since the simple procedure is inferred according to VLOC model test data, the vessels with a higher speed and large bow flare angles like containerships could not be covered in this paper.Further researches to validate the conclusion will be needed in the future.
杂志排行
船舶力学的其它文章
- Responses of Large-ship Mooring Forces Based on Actual Measurement
- Experimental Study on Fatigue Crack Growth of Compact Tensile Specimens Under Two-Step Variable Amplitude Loads with Different Cyclic Ratios
- Study on Influence Law of System Parameters on the Dynamic Response of High-static-low-dynamic Stiffness Vibration Isolator Working Under Off-design Condition
- Bivariate Kernel Density Estimation for Meta-ocean Contour Lines of Extreme Sea States
- Study on the Tip Vortex Control Effect and Rule of Pump Jet Thruster by Groove Structure
- On Scale Effect of Open Water Performance of Puller Podded Propulsors Based on RANS