Responses of Large-ship Mooring Forces Based on Actual Measurement
2021-12-31-,,-,-
-,,-,-
(Navigation College,Dalian Maritime University,Dalian 116026,China)
Abstract:Ship mooring forces and their response mechanism were investigted by obtaining ship mooring forces under various environmental loads. An experimental system for measuring mooring forces was constructed to acquire large-ship mooring force data in a real environment and to enable investigation of their regularity.Several conclusions of responses of large-ship mooring forces over time were drawn based on analyses of the measured data by using several mathematical tools.The time series data of ship mooring forces in complicated cases can be extracted by constructing an experimental system of ship mooring forces. It is found by numerical simulation calculation that the measured value is in good agreement with the simulation result. The proposed system can serve as a guide for constructing a model of the response of mooring forces for large ships under the influence of certain environmental factors.
Key words:large ship;mooring force;experimental system;numerical simulation
0 Introduction
The ship mooring force is an important index that affects the safety of ship mooring. The static distribution and response of ship mooring forces directly affect the overall performance of a ship mooring system. Recent trends in ship maximization and deep-water berths have resulted in many incidents of broken cables and ship-drifting accidents in large-sized ship terminals due to insufficient experience in port design and use[1].Large and long ships with deep drafts are prone to the significant influence of currents, waves, and winds[2]. These conditions may cause the ship to hit the shore and lead to heavy loss of life, property damage, and environmental pollution in severe cases.Such accidents seriously affect the production safety and ship operation of ports and can cause massive losses to the national economy[3].
In theoretical and applied researches, the current study on ship mooring force mainly focuses on physical model analysis and mathematical model simulation.Van der Molen[4]derived an empirical expression by using numerical simulation program TERMSIM to calculate the yaw motions of the moored LNG carrier in swell waves which can be used during preliminary terminal design studies. Xiang[5]derived the equations of static equilibrium for the mooring lines when the ship is subjected to surface wind, current and restricted waves. The computed results are compared with the ones obtained from the experiment conducted on a 50 000 DWT bulk carrier model and they are found to be in certain agreement. Paulo[6]designed a physical model based on the characteristics of a real port terminal with operational problems and gained some conclusions to reduce moored ship motions and increase the tension mooring efficiency. Yue[7]proposed a coupled analysis model to predict the dynamic response of the mooring ship and validated the numerical model using the physical model experimental data. While helpful, these models are difficult to verify because the study on the response mechanism of ship mooring force lacks data on real weather and sea conditions.Therefore,an effective measuring system of mooring force should be constructed to enable investigation of the mechanism of ship mooring responses and establish a ship mooring force monitoring and warning system[8].
1 Experiment system construction
1.1 Experiment principle
Under external loads like winds, currents, and waves, the motions of a moored ship exhibit six degrees of freedom,namely,surge,sway,heave,roll,pitch,and yaw,in the Cartesian coordinate system[9-10], as shown in Fig.1. The mooring force transfers the complex, nonlinear constitutive relationships of mooring lines to the bollard through linear Hooke deformation, which limits the movements of the ship.Therefore,the stress pressure of the bollard(or the quick release hook of the mooring machine)is equal to the mooring force transmitted by the mooring lines. According to this principle, the mooring force generated by each line can be indirectly obtained by measuring the axial stress applied by each line to the bollard.
1.2 System components
Force sensors are the key elements in the experimental system for accurate force measurement. The force data should be transmitted, collected, stored, and displayed in real time, and electronic measuring elements should be accurately set to effectively obtain the mooring force of each line on the experimental ship.To meet these requirements,the traditional mooring system should be specially modified. Several components (or submodules), such as modified or specially-designed quick release hooks, stress pins, transmitters, a data acquisition module, and an upper computer,must be combined to achieve the desired overall functionality using some of the programmable logic control algorithms.The functions of each submodule of the system are described as follows:
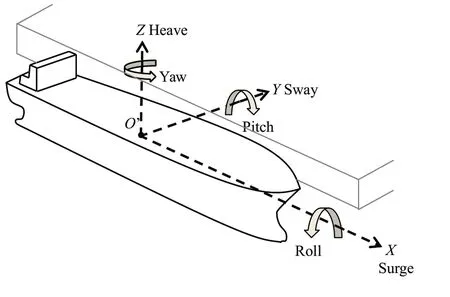
Fig.1 Six degrees of freedom of a moored ship
Quick release hooks: Quick release hooks are the load-bearing parts of mooring machines. A force sensor is installed on the connecting shaft of the mooring machine and a hook. Each mooring machine has three or four hook heads, and the head direction can be adjusted simultaneously with the tense line.In this case,the measured force is applied in the axial direction along the mooring line.
Stress pins: Stress pins are force sensor carriers. The pin surface slightly deforms due to the line tension passing through the hook head.A mechanical signal is generated when the physical deformation of the pin surface is detected.
Transducers: Transducers are electronic devices installed inside the stress pins for transforming mechanical signals into electric signals and amplifying the results.
Remote data acquisition module: The remote data acquisition module is a data processing device designed to complete data acquisition,conversion,and transmission work.
Host computer: The host computer is used to display the obtained mooring force, store the force data,and control the hook to release the mooring line.
The working process of the system is: (1) the tension generated by the mooring line is transferred as stress to the stress pin installed in the connecting shaft between the mooring machine and hook when the machine hook is pulled by the tense mooring line;(2)the physical quantity measured by the sensor is the deformation of the pin surface,which is converted into an electrical signal through the transducer after temperature- and zero-point correction; (3) the electrical signal is then collected and processed by the remote data acquisition module and transmitted to the host computer for subsequent application.
The submodules and signal transmission process are shown in Fig. 2.Fig.3 shows a sketch of the signal transmission process corresponding to Fig.2.The experimental mooring forces displayed on the host computer are expressed in tons.

Fig.2 Transmission processes of physical signals
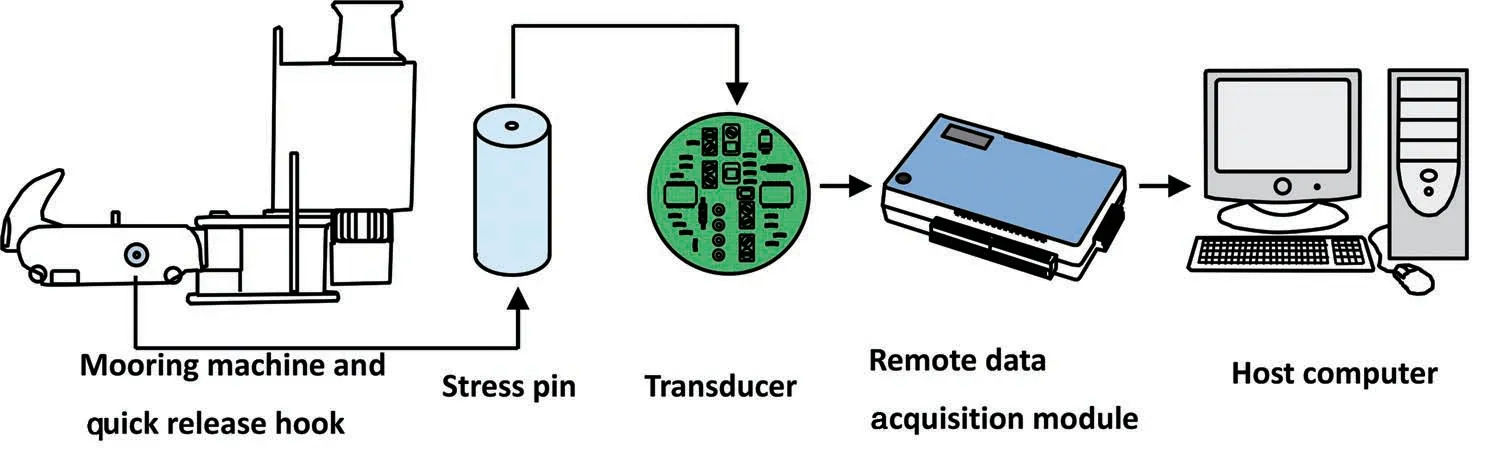
Fig.3 Sketch of the signal transmission processes and the relevant submodules
1.3 System construction
Each system component should be organically connected to a fieldbus to realize the overall function of the system.A fieldbus is a network that connects the measuring devices,processors,and controllers and accomplishes their digital communication.In the present work,electrical signals are transmitted through a fieldbus LAN. Based on the different functions of its components, the experimental system can be divided into four parts, namely, the hook control units, the data acquisition and processing platform, the central monitoring system, and the fieldbus LAN. The system configuration is shown in Fig.4.

Fig.4 Structure of the experimental system for determining mooring forces
The related performance indicators of the key devices in the system platform are shown in Tab.1.

Tab.1 Performance index of key system devices
2 Experiment design
The experiment plan should be properly designed after the system is completely constructed.To analyze the responses of the ship mooring force under external loads, the basic conditions of the experimental terminal and ship and their prevailing circumstances should be obtained in detail.
2.1 Terminal profiles
The experimental wharf is an open-type tanker terminal with a sphenoid-shaped arrangement.The berth meets the berthing requirements of a tanker,i.e.,a ship with a tonnage of 50 000-300 000 t.The terminal parameters are shown in Tab.2.
The terminal is composed of a working platform and 10 piers with approach bridges;here,four of the piers in the middle of the terminal are directly in contact with the ship’s side and its fenders.Every pier has one or two mooring machines,each of which has three or four quick release hooks to fasten mooring lines. The force-measuring element is directly connected to the hook head. After proper installation and special treatment,the mooring line tension in any direction can be read from the line axis.The planar arrangement of the experimental terminal is shown in Fig.5.

Tab.2 Relevant terminal parameters

Fig.5 Planar arrangement of the experimental terminal
2.2 Observations of relevant factors
To analyze the responses of large-ship mooring forces under the influence of the external environment, effective measures should be taken to record the wind, current, tide level and ship draft data at the same time when the mooring force of each line is determined[11].The flood and ebb rapids times are used to analyze the influence of various external factors affecting the ship mooring force.The observation requirements of external environmental elements are shown in Tab.3.

Tab.3 Observational requirement of environmental elements
3 Experiment process and results
3.1 General process description
A VLCC (very large crude carrier) was selected as the experimental ship based on its voyage plan to discharge cargo oil in the experimental terminal.Details of this ship are listed in Tab.4.
The ship arrived at the terminal apron at 11:30, finished berthing, and secured its mooring lines at 13:30 using 20 steel wire mooring lines(Minimum break strength:1 680 kN)with a mooring type of 3 322 (bow)/2 224 (stern). Details of the mooring pattern are shown in Fig.6. A petroleum pipeline was installed at 15:30 and discharge began(the scene of the liquid discharging operation is shown in Fig.7).The experimental system was switched on at 14:00.After 14.5 h of automatic operation and recording,the experimental system was switched off at 4:30 the next day.

Tab.4 Dimension data of the test ship
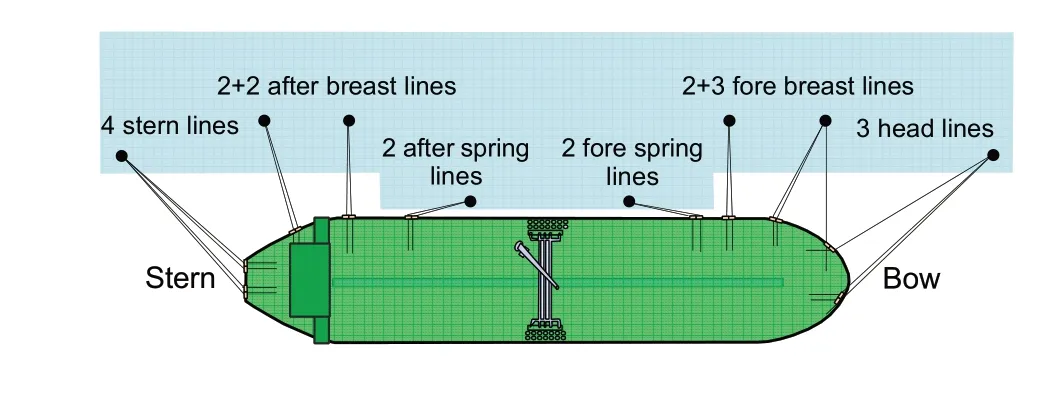
Fig.6 Mooring pattern of the test ship

Fig.7 Scene of the liquid discharging operation
The names of the mooring line,their numbers,and their purposes are listed in Tab.5[12].

Tab.5 Mooring line names,numbers and purposes
3.2 Environmental data
Data of the environment around the ship were collected in real-time according to the required sampling frequency. The recorded values reflect the multi-point averages of records taken over 1 min in the windward or counter-flow direction without obstruction.Analysis of tidal records reveals that the experimental sea tide flows as a reverse current with flood currents in the NW direction and ebb currents in the SE direction. In the experiment, the wave height, constant wave direction, and wave period were measured to be approximately 0.4 m,45°,and 5 s respectively.Other environmental features, such as wind, current, tidal level, and mean draft, were recorded by the corresponding recording tools at specific times and are shown in Tab.6. Fig.8 shows a curve of the tidal level as measured by an automatic tidal level recorder.

Tab.6 Tidal data obtained at specific times

Fig.8 Tidal level measured by automatic tidal level recorder
3.3 Experimental results
The mooring force curves are plotted in Cartesian coordinates based on continuous recordings of the mooring forces on 20 mooring lines. For better comparison of mooring lines with the same property, the same functions of mooring lines are sorted into groups for plotting. Figs.9-13 plot the dynamic time series curves of the mooring forces according to line groups. The mooring lines are numbered L1 to L20 from the bow to the stern, where lines L1 to L3 are considered the headlines,lines L4 to L8 the fore breast lines,lines L9 and L10 the fore spring lines,lines L11 and L12 the after spring lines,lines L13 to L16 the after breast lines,and lines L17 to L20 the stern lines.
The tension of the mooring lines was adjusted (or artificially intervened) several times by the ship’s sailors on duty throughout the experiment.These operations were made with consideration of the tidal level and ship draft,especially in case the overall force of the mooring lines was irregularly distributed and a security threat was imminent.Such operations changed the pretensions of mooring lines to some extent.The force curves plotted in the figures show instantaneous saltation of the mooring force.

Fig.9 Dynamic mooring force curves of head lines
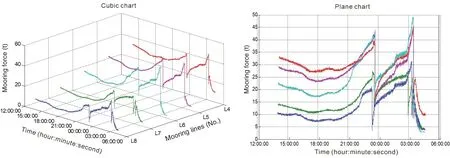
Fig.10 Dynamic mooring force curves of fore breast lines

Fig.11 Dynamic mooring force curves of fore and after spring lines

Fig.12 Dynamic mooring force curves of after breast lines

Fig.13 Dynamic mooring force curves of stern lines
4 Discussion
The figures above illustrate changes in the mooring force of each line over time. Preliminary analysis of the measurements indicates that: (1) the response of the ship mooring force is complex during the discharging operation; (2) the mooring force exerted by the mooring lines varies with changes in the external load of the ship;(3)the uniformity of the mooring forces acting on each part of the hull can be artificially intervened, which balances the overall mooring force exerted by lines in the same mooring group and throughout the entire mooring system; such a balance is a criterion for optimization of the safety performance of mooring systems;(4)although several differences in the forces exerted by the mooring lines with the same property can be observed,the development trends are nearly identical through changes in external load; (5) although mooring lines in the same group have the same properties, their development trends may not be consistent if their mooring lengths and mooring angles differ.
The curves of the resultant mooring forces exerted by lines with the same property are plotted in Fig.14 by algebraic addition of the mooring forces of lines in the same group.Here,different colors refer to the resultant forces of mooring lines with different properties.
Fig.14 Dynamic mooring force curves of total line force with the same property
The curves above reveal that the resultant force of fore breast lines is obviously larger than those of other lines, including after breast lines. This finding illustrates that the mooring force of breast lines is relatively independent of other lines with different properties.Instantaneous saltation of the mooring force is caused by changes in pretension by artificial intervention of veering out the lines. As seen from both the observations and the curve of each mooring line, the pretension appears to have a significant influence on the force exerted by the mooring lines,including their equalization(especially in Figs.8-11).
The vector sum of the transverse and longitudinal forces applied to the ship by the mooring lines can be obtained by force decomposition and superposition. The mooring force decomposition and superposition functions are shown in Eqs.(1)-(2),respectively.
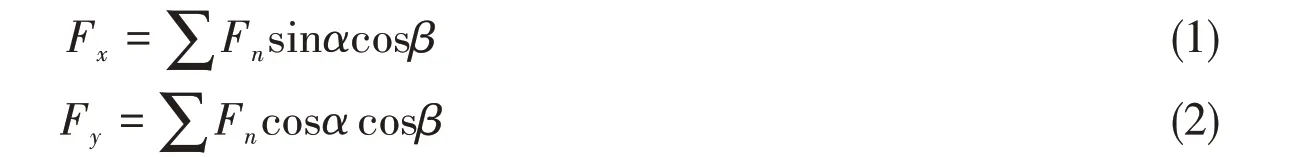
In these equations,FxandFyare the vector sum of the transverse and longitudinal forces applied to the ship by the mooring lines,respectively,αis the angle between the horizontal projection of a mooring line and the terminal front line,andβis the angle between a mooring line and horizontal plane.The longitudinal forceFyhas two components,i.e.,a longitudinal forward force and a longitudinal backward force. The forward component of the mooring force is mainly supported by the head and after spring lines, including several other lines with forward components, while the backward component is mainly supported by the stern and fore spring lines,including several other lines with backward components.
As shown in Fig.15,the transverse force applied to the ship by the mooring lines is larger than the longitudinal force. This finding illustrates that one of the main functions of mooring force is to provide the ship with a transverse component to resist influences from the external environment,including the defender reaction force. As shown in Fig. 14, the backward and forward longitudinal forces acting on the ship are basically equal, thus demonstrating a strong correlation between these forces despite environment changes. The difference between the forward and backward components is mainly the result of the resistance to the longitudinal external loads.The transverse component of the mooring lines is more independent than their longitudinal component.The correlation of the longitudinal forces of the mooring lines must be considered when artificial intervention is applied to the mooring system.

Fig.15 Dynamic mooring force curves of the transverse and longitudinal components
5 Numerical simulation calculation comparison
In order to verify the accuracy of the measured results, ship and environmental data at time of rapid flow is selected to carry out numerical simulation. The numerical simulation is mooring force calculation based on mooring force analysis software OPTIMOOR using the calculation method of ship external load recommended by OCIMF. The numerical optimization algorithm is used to perform the iterative calculation and simulate the mooring force output value which has a good simulation effect.The basic principle of calculation is shown in the following equilibrium control equation as Eq.(3).

whereFxis thexvector component of an externally applied force,e.g.,wind,current,or others;Pxis thexvector component of a mooring line force (fenders exert no force in thexdirection);Fyis theyvector component of an externally applied force,e.g.wind,current,or others;Pyis theyvector component of a mooring line force or fender force;Mxyis the moment in thex-yplane produced by an externally applied force, e.g. wind, current, or others;Nxyis the moment in thex-yplane produced by a mooring line force or fender force.
Two time points in the middle period are selected for calculations. They are 15:10 and 21:30,where at time 15:10 and 21:30 the sea current appeared to be ebb rapids and flood rapids respectively.In the simulations,mooring lines can be contracted or released to adjust the length artificially with an initial pretension of 150 kN. The mooring pattern model for numerical simulation is shown in Fig.16.

Fig.16 Mooring pattern model for numerical simulation
Tab.7 shows the output of the mooring force numerical simulation and the comparison with the measured value at the moment of ebb rapids (15:10), in which‘pull-in’stands for the length of the mooring line tightened by winch. Tab.8 shows the calculated stress condition of the bollards (quick release hooks). Fig.17 shows the comparison between measured forces and calculated values at the moment of ebb rapids (15:10).Through the chart, it is found that the numerical method can simulate the mooring force well. The difference between calculated results and measured value is mostly no more than 20%.The overallY-stress of the hooks can reflect the mooring line’s binding capacity to the ship’s transverse external load. The measured result of transverse overall stress is 230 t. There is only a 7% difference between the calculatedY-direction value and the measured transverse force (about 246.5 t).

Fig.17 Differences between calculated and real measured value at 15:10(ebb rapids)

Tab.7 Comparison between calculated value and measured forces at 15:10(ebb rapids)

Tab.8 Stress simulation results of the hooks at 15:10(ebb rapids)
Tab.9 shows the output of the mooring force numerical simulation and the comparison with the measured value at the moment of flood rapids (21:30), Tab.10 shows the stress simulation results of the hooks at the moment of flood rapids (21: 30) and Fig.18 shows the comparison of measured forces and calculated values at the moment of flood rapids (21:30). By contrast, the measured mooring force is in good agreement with the calculated results, with differences no more than 20%. The difference between the calculated overallY-stress of the hooks (256.8 t)and the measured result of transverse overall stress(258 t)is below 1%.

Fig.18 Difference between calculated values and real measured ones at 2 130(flood rapids)

Tab.9 Comparison between calculated value and measured forces at 21:30(flood rapids)
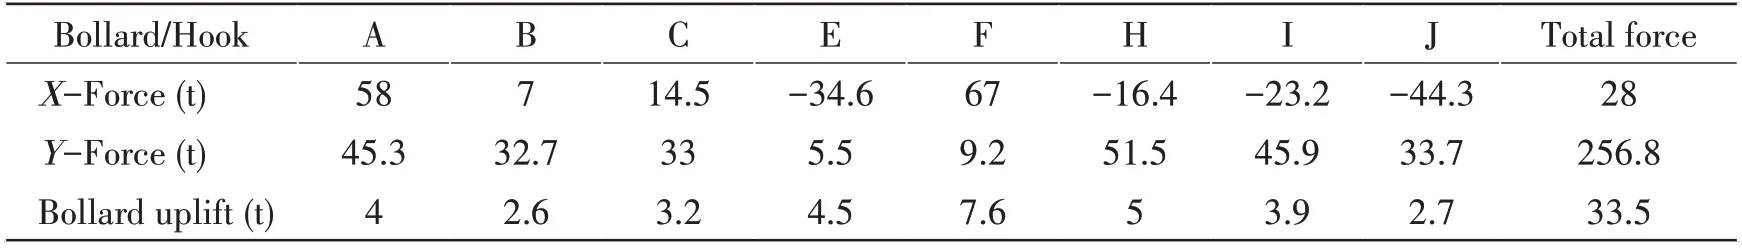
Tab.10 Stress simulation results of the hooks at 21:30(flood rapids)
From the above calculation and analysis,the mooring forces measured by the experimental system are in good agreement with the numerical simulation calculated results, which, to some extent,proves the credibility of this study. Practice has proven that the software has the advantage of simplicity and quickness in predicting the mooring force, but it is more important to study the mooring force mechanism with accurate and real-time stress.
6 Concluding remarks
The response of ship mooring forces in complicated cases presents strong regularities over time. These regularities form the basis for studies on large-ship mooring forces and their control.The time series data of ship mooring force in complicated cases can be extracted by constructing an experimental system of ship mooring forces accurately. Subsequent treatment of the extracted data using mathematical tools can yield conclusions on ship mooring forces with theoretical and practical implications on the safety of ports. Upon comparison between the mooring forces measured by the experimental system and the numerical simulation calculated results,it is proved that both the data involved in the discussion and the conclusions reached are credible.
In future work, the authors aim to extract the experimental data to analyze the multi-dynamic response mechanism of ship mooring forces. Construction of a multi-dynamic response module to realize dynamic control of a ship’s mooring system will be significant for port modernization.
杂志排行

船舶力学的其它文章
- Experimental Study on Fatigue Crack Growth of Compact Tensile Specimens Under Two-Step Variable Amplitude Loads with Different Cyclic Ratios
- Study on Influence Law of System Parameters on the Dynamic Response of High-static-low-dynamic Stiffness Vibration Isolator Working Under Off-design Condition
- Bivariate Kernel Density Estimation for Meta-ocean Contour Lines of Extreme Sea States
- Study on the Tip Vortex Control Effect and Rule of Pump Jet Thruster by Groove Structure
- On Scale Effect of Open Water Performance of Puller Podded Propulsors Based on RANS
- Main Engine Power Prediction for Large Vessels Based on Gaussian Mixture Model and Deep Neural Network