Experimental Study on Fatigue Crack Growth of Compact Tensile Specimens Under Two-Step Variable Amplitude Loads with Different Cyclic Ratios
2021-12-312b
-,,,2b,-
(1.Key Laboratory of High Performance Ship Technology(Wuhan University of Technology),Ministry of Education,Wuhan 430063,China;2a.School of Transportation;b.Green&Smart River-Sea-Going Ship,Cruise and Yacht Research Center,Wuhan University of Technology,Wuhan 430063,China)
Abstract: Due to the diversification of the routes of River-Sea-Going Ship (RSGS), the cyclic ratios of the sea and river are different. The impact of different cyclic ratios on the fatigue performance of a hull structure should be considered in the fatigue strength assessment of RSGS’s structure. Considering the load characteristics of RSGS, the crack growth tests based on standard compact tensile(CT)specimens were designed to explore the effect of cyclic ratios on crack growth. The crack propagation tests of CT specimens under a constant amplitude (CA) load and two-step variable amplitude (VA)loads (cyclic ratios of 1:1,1:2,1:3 and 1:4)were carried out respectively.By using the combination of theoretical analysis, experimental research and numerical calculation, the influence law of small amplitude loads on fatigue crack growth is revealed, and a modified model is proposed. The research can provide a theoretical basis and data support for fatigue assessment of RSGS and research on crack propagation of ship structures.
Key words:two-step variable amplitude loads;crack growth;different cyclic ratios;River-Sea-Going Ship;crack propagation tests
0 Introduction
From a safety perspective,it is important to study the failure mechanism and approaches of fatigue life prediction[1-2]. Many scholars have done a lot of research on fatigue problems, mainly on the fatigue life and the crack growth rate.
Scholars from various countries have made lots of research on constant amplitude (CA) fatigue problems. A well-known and widely-used crack growth rate relationship is Paris-Erdogan crack growth law[3]. The correction factor concerning the effect of boundary condition and modified Paris’equation was proposed[4].
However, the variable amplitude (VA) fatigue problem is more serious and difficult to explore.Some models have been developed to estimate the fatigue life of components subjected to variable amplitude loadings[5-8].
For instance, the Wheeler model[9]and the Willenborg model[10]were based on the calculation of the yield zone size of the crack tip. And Huang[11]introduced an engineering modified Wheeler model.
Another kind of VA model was based on crack closure. For example, Elber[12]introduced the crack closure concept which considers plastic deformation and crack face interaction in the wake of the crack, and a crack closure model was proposed by Newman[13]. What’s more, a crack growth model considering strain energy density factor was proposed[14].
However, most scholars focus on the overload or underload (single and transient force) of VA loads problems, which is different from the repeating two-step VA Loads problems in this paper.The difference is shown in Fig.1. Gan[15]explored the fatigue damage evolution of typical joints under the repeating two-step VA loading condition.

Fig.1 Difference of loading forms
Because a River-Sea-Going Ship (RSGS) passes through the river section and the sea section during the voyage,the loads of the river section and the sea section can be equivalent to the combination of a small load and a large load of two-step alternating.Meanwhile,the RSGS will not always sail along the same route. When it sails on different routes, the proportion of sea and river sections will change greatly. Therefore, it is particularly important to consider the fatigue problem under the VA load of different cyclic ratios.
The experiment in this paper used standard compact tensile (CT)test specimens to explore the impact of small loads and a fitting formula by increasing the proportion of small loads was proposed.
1 Calculation of fatigue life
The model with crack was created and the stress intensity factor could be calculated.The overall model CT specimen is shown in Fig.2,and the crack in CT specimen is shown in Fig.3.
The material used in the simulation was Q235, and the material parameters are shown in Tabs.1-2 (E,σs,σb,ρare elastic modulus, yield strength, tensile strength, material density). The overall element size was 2 mm and the element size of the singular mesh at the crack tip was 0.01 mm(the initial pre-cracking length of CT specimens was 6 mm).

Fig.2 Model of CT specimen in Franc3D

Fig.3 Crack in CT specimen

Tab.1 Chemical composition of Q235 steel

Tab.2 Properties of Q235 steel
The load was 6 kN, the stress ratio was 0.1, the frequency was 20 Hz, and the load was in the form of a sine curve. The crack propagation life is shown in Fig.4. The abscissa indicates the number of loading cycles,and the ordinate indicates the crack propagation length.The results show that when the crack is increased from 6 mm to 16 mm (the initial crack is 6 mm),the number of loading cycles is 99 000 times. The relationship between crack propagation length and stress intensity factor range(ΔK)is shown in Fig.5.

Fig.4 Crack propagation life

Fig.5 Change of ΔK
2 Experiments
2.1 Specimen
The design of specimen is shown in Fig.6. An advanced wire cutting method was used in the manufacturing process uses, and the precision of the pre-crack with a length of 6 mm is 0.02 mm.The actual test specimen after processing is shown in Fig.7.
16 test specimens were arranged, and the test specimens were divided into several sets of experimental conditions, as shown in Tab.3. All specimens are shown in Fig.8.NL(NH) is the number of low(high)load cycle.

Fig.6 Geometry information CT test specimen(dimension in mm)

Fig.7 CT specimen after actual processing

Tab.3 Experimental conditions

Fig.8 16 CT specimens
2.2 Experimental setup
Fatigue tests were carried out at room temperature and using MTS 322 fatigue testing machine located in Wuhan University of Technology.The MTS test machine is shown in Fig.9.The test specimen was fixed,as shown in Fig.10.

Fig.9 MTS fatigue testing machine

Fig.10 Tensile state of the test specimen
An industrial camera with an observation electron microscope was used as the observation equipment. Fig.11 shows the device. Crack growth at each short time could be observed under a high-precision camera,as shown in Fig.12.

Fig.11 Observing equipment

Fig.12 Crack observation by an industrial camera
2.3 CA load
The CA load is shown in Fig.13. CA experiments were used as reference standards to provide criteria for VA experiments.
2.4 VA load
The VA loads have different cyclic ratios (the ratio of the number of different loads cycles).The VA loads are shown in Tab.4.The loading process is shown in Fig.14.

Fig.13 CA experiment load

Fig.14 VA experiment load

Tab.4 VA load details
3 Test results
3.1 CA test result
Comparison shows that the simulation results are in good agreement with the test results, as shown in the Fig.15(occasional errors were removed).
3.2 VA tests results
VA tests results of CT specimens are shown in Tab.5. The average number of large load action of all tests are shown in Tab.6.
3.3 Result analysis
It can be clearly seen that the results of the CA tests are in good agreement with those of the simulation, and small loads accelerate crack propagation in VA tests, which confirms that underloads produce acceleration related to the background growth rate[5]. However, in this paper, the influence of small load would be further discussed.
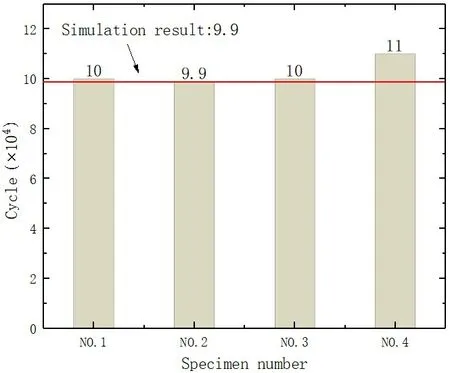
Fig.15 Comparison between experimental results and simulation ones

Tab.5 Two-step repeating VA loading fatigue tests results

Tab.6 Average number of large load action
Initially,the number of large loads and the corresponding crack length are separately extracted from the results,followed by a data fitting in the software Franc3D,as shown in Figs.16-19.

Fig.16 Data fitting when NL:NH=1:1

Fig.17 Data fitting when NL:NH=2:1
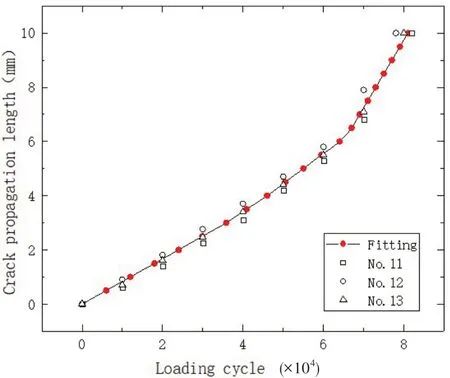
Fig.18 Data fitting when NL:NH=3:1

Fig.19 Data fitting when NL:NH=4:1
Comparison with the curve in Fig.4 shows clearly that,when the large load is the same,the difference in crack growth rate is only affected by the small load. According to Elber[12], the crack growth rate can be expressed as:

where the coefficientC= 5.21×10⁻¹³and exponentm=3[16]. And effective stress intensity factor range ΔKeffcan be calculated according to the following formula[17]:

whereKI,KIIandKIIIare the stress intensity factors corresponding to cracks of Type I, Type II, and Type III respectively.
The results of ΔKeffare shown in Fig.20 and the relationship between ΔKeffand crack length is fitted in Figs.21-24.

Fig.20 Change of ΔKeff

Fig.21 Data fitting for ΔKeff when NL:NH=1:1

Fig.22 Data fitting for ΔKeff when NL:NH=2:1

Fig.23 Data fitting for ΔKeff when NL:NH=3:1

Fig.24 Data fitting for ΔKeff when NL:NH=4:1
The formula can be used to calculate the effect of a small load of different cyclic ratios on the VA crack propagation.
According to Huang[11], an underload can deplete the resulting plastic zone and increase the field zone size so that it accelerates the crack acceleration. However, in this paper, a small amplitude block load is a collection of underloads,which can produce a cumulative acceleration.And the degree of acceleration is relative to the cyclic ratio. Thus, this paper proposes a new crack growth rate calculation formula considering the influence of load interaction.

4 Conclusions

Fig.25 Change of ΔKcyc
With five sets of experiments carried out, the experimental data were summarized and compared,and the differences and connections between different sets of data were found. The following conclusions are reached.
(1) By using the proposed method for exploring the effect of small load on crack growth, it is obtained that the effect of small load on crack growth rate is equivalent to that of effective stress intensity factor range.
(2) By comparison, it can be found that even in the form of repeating two-step VA loading,a small load still conforms to the normal law and still accelerates crack growth.Experiments with different cyclic ratios prove that the larger the ratio, the more obvious the acceleration effect. Therefore,the influence of different ratios should be considered during the actual routes of RSGS.
杂志排行
船舶力学的其它文章
- Responses of Large-ship Mooring Forces Based on Actual Measurement
- Study on Influence Law of System Parameters on the Dynamic Response of High-static-low-dynamic Stiffness Vibration Isolator Working Under Off-design Condition
- Bivariate Kernel Density Estimation for Meta-ocean Contour Lines of Extreme Sea States
- Study on the Tip Vortex Control Effect and Rule of Pump Jet Thruster by Groove Structure
- On Scale Effect of Open Water Performance of Puller Podded Propulsors Based on RANS
- Main Engine Power Prediction for Large Vessels Based on Gaussian Mixture Model and Deep Neural Network