Main Engine Power Prediction for Large Vessels Based on Gaussian Mixture Model and Deep Neural Network
2021-12-31-,,-,-,,-,
-,,-,-,,-,
(1.School of Information Science&Engineering,Lanzhou University,Lanzhou 730000,China;2.College of Electronic Information,Guangxi University for Nationalities,Nanning 530006,China)
Abstract: The marine main engine power is an important data for prediction of fuel consumption during navigation and for evaluation of exhaust emissions. However, the absence of vessel main engine power data hinders the prediction of fuel consumption and emissions of vessels based on large data.A main engine power prediction method for large vessels based on Gaussian mixture model (GMM) and deep neural network (DNN)is proposed in this paper to solve this problem.Firstly,the vessel data are analysed for correlation, and ship features which have large correlation coefficients with the engine power are selected as input of the GMM-DNN hybrid model. Then the clustering algorithm GMM is used to analyse ship characteristics,the result of which is used as an input of DNN.Finally,with DNN optimized by Adam-Dropout, the vessel power is predicted by DNN. In order to explore the effectiveness of the method, the multiple linear regression analysis, nonlinear regression, DNN and GMMDNN with respect to the main engine power prediction of vessels are compared.The experiment shows that the MAPE of GMM-DNN is 14.57%, which is 28.27% lower than that of multiple linear regression, 23.36% lower than that of non-linear regression, and 1.24% lower than that of DNN and shows that the GMM-DNN model is the best in the main engine power prediction for large vessels.
Key words:main engine power;Gaussian mixture model(GMM);deep neural network(DNN)
0 Introduction
With the continuous development of shipping and shipbuilding industry,the type,quantity and tonnage of vessels are increasing. Therefore, the shipping economy and environmental pollution assessment[1-2]is becoming more and more important. However, the vessel power data of Marine-traffic (a global ship tracking and service platform) and the ship net are not disclosed at present. The missing and inaccessible vessel power data have a great influence on the prediction and optimization of fuel consumption[3]and the assessment of vessel exhaust emissions[4-5]. It is more and more important to get the main engine power of vessels[6].
Nowadays, the prediction methods of the main engine power can be divided into three categories. The first category is multiple regression analysis, such as multiple linear regression, nonlinear regression, and etc.. Based on polynomial regression, Zhou et al[7]obtained regression formulas for the main power and main sizes of fishing and cargo vessels, and determined the power estimation method of the main engines for the inland ships. Based on the AIS data of 200 000 vessels around the world, Polish scholar Tomasz[8]obtained the regression formula of the parameters between load,design speed and length, breadth, draft, main engine power by regression analysis method. The regression formula can be used in the ship preliminary design. But it cannot be directly used to estimate the main engine power of vessels because load and design speed are not easy to obtain.
The second category is traditional machine learning, such as support vector machine (SVM),random forest regressor (RFR), and etc.. Gkerekos et al[9]presented a comparison between many methods for predicting ship main engine fuel oil consumption (FOC)based on vessel,in which various multiple regression algorithms including SVM, RFR, extra trees regressor (ETR), artificial neural network(ANN),and ensemble methods are employed.Based on a database of 400 vessels,Liu et al[10]established a prediction method for the effective power of vessels by using SVM. But the database data used in the experiment were too old,and there were few new ships in the last decade.
The third category is deep learning, such as deep neural network (DNN), convolution neural network (CNN)[11]and etc.. With the development of artificial intelligence, DNN has incomparable advantages in fitting high dimensional nonlinear functions. Bal Beşikçi et al[12]used an inexact method of artificial neural network (ANN) to predict ship fuel consumption for various operational conditions, and developed a decision support system (DSS) employing ANN-based fuel prediction model to be used on board ships on a real time basis for energy efficient ship operations. Farag et al[13]employed a combined technique of ANN and multi-regression (MR)to estimate the vessel power and fuel consumption.
In the report as shown in Ref.[14], there were 95 402 vessels (more than 100 GT propelling vessels) with a total capacity of 1.970 billion DWT in early 2019. These vessels differ greatly in structure,size,materials,purposes and other aspects.Even with the same type of vessel,their main dimensions and various parameters are different.Therefore,the identification of vessel main engine power cannot be distinguished by a single parameter. Based on the rough set theory, Tian et al[15]proposed a classification method for the vessel main engine power data, and extracted attribute set and decision set that can represent vessel information.Gao et al[16]used GMM to conduct clustering analysis on ship speed, main engine power and fuel consumption, and mined the data of the lowest fuel consumption under different working conditions.Raptodimos et al[17]used a two-stage approach to cluster the key performance parameters for a panamax container ship main engine cylinder. Initially,the data were clustered using the artificial neural network (ANN)-self-organizing map (SOM)and then the clusters were inter-clustered using the Euclidean distance metric into groups.
Based on the above theory,this paper proposes a new method to predict the main engine power of vessel based on GMM and DNN, with DNN specifically referring to an artificial neural network(ANN)with more layers,which has a stronger ability to model and create abstraction,and can simulate more complex models.Firstly,correlation analyses are made on ship features,and ship features with large power correlation coefficients are selected to the main engine as the input of GMM-DNN.Then, GMM is used to identify and cluster the main engine power, and the clustering results,length, breadth and depth of the vessel are used as the input of DNN. Finally, Adam-Dropout is used to optimize DNN for prediction of the main engine power. In order to explore the effectiveness of the method, we compare the estimation results of multiple linear regression, multiple nonlinear regression[18],DNN and GMM-DNN on the main engine power.
1 Construction of GMM-DNN model
The structure of the GMM-DNN model used in the paper is shown in Fig.1. The model consists of GMM, DNN and Adam-Dropout optimizer. In the figure,Lis the length of vessel,Bis the breadth,Dis the depth,Tis the vessel type,Cis the clustering result of GMM,giis the GMM input andGis the aggregation ofgi.

Fig.1 Structure of GMM-DNN
GMM is used for identification and clustering of ship features.In this paper,T,L,BandDare selected as input features. We considered that the input featuregifollows a Gaussian distribution expressed by Eq.(1).The probability density of all featuresGcan be expressed as the weighted sum of a single Gaussian density and expressed by Eq.(2).

In Eqs.(1)-(2),nis the data dimension,Mis the mixing coefficient,ωiis the weight,σiis the covariance matrix of vector,anduiis the mean value of vector.
GMM uses expectation-maximization (EM)[19]algorithm to estimate parameters. Firstly, the model needs the number of clusters,we need to obtain the estimated value of parameters and calculate the probability of data points belonging to the corresponding cluster.Then,the maximum likelihood function is used to divide the data points into clusters with higher probability.The mean value and covariance of GMM are updated at the same time. Finally, we need to repeat the above two steps until the likelihood function converges and the cluster ends, then the mean value and covariance matrices of GMM are obtained. After clustering, the clustering labels and ship features are sent into DNN.
The structure of the DNN model is shown in Fig.2. The model is composed of an input layer, multiple hidden layers and an output layer. In this figure,aiis the offset parameter between the input layer and hidden layer, andxiis the input.
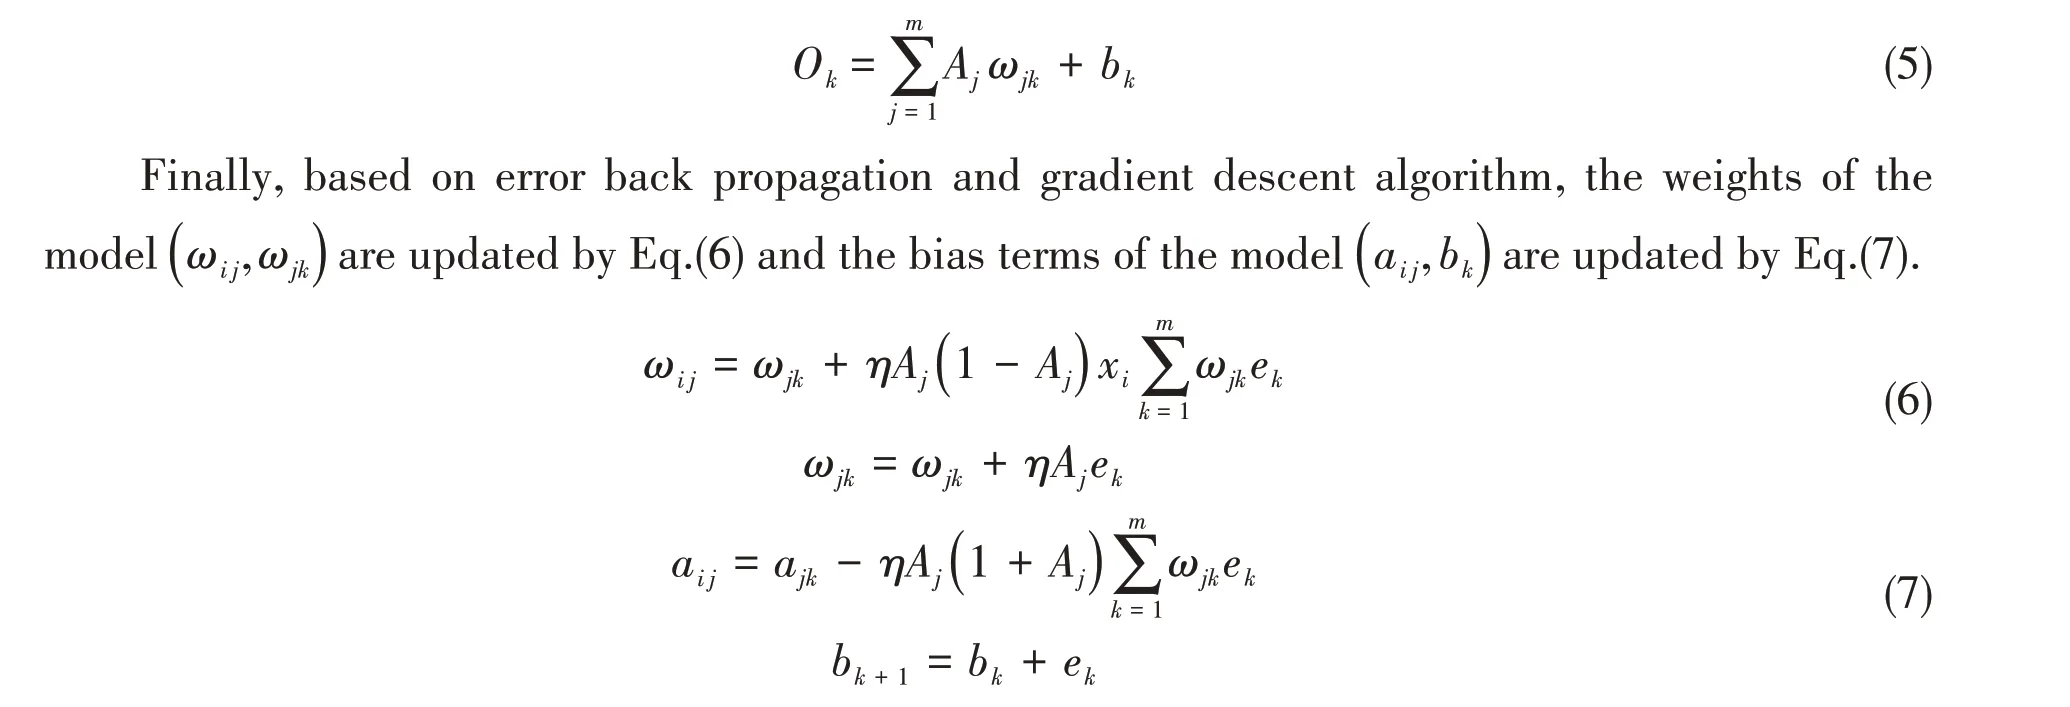
In the model training, the input vectorsX(L,B,D,T,C) linearly add to the weightωi jand bias termajwhen passing through hidden layer neurons, and we obtainAjin the output layer after the nonlinear activation function, as shown in Eq.(3), where the activation function adopts the ReLu function,whose definition is Eq.(4).

Fig.2 Structure of DNN

Then,the output of the hidden layer(Aj)passes through full connection layer and outputsOk,as shown in Eq.(5).

whereekis the prediction error,ηis learning rate,ωi jis the weight between input layer and hidden layer,ai jis the offset parameter between input layer and hidden layer,ωjkis the weight between hidden layer and output layer,andbkis the offset parameter between hidden layer and output layer.
In order to accelerate the convergence speed of the model and prevent the model from falling into local optimization,the adaptive moment estimation (Adam)optimizer is adopted to optimize the network parameters[19].The optimization strategy is Eqs.(8)-(10).

wheregtis the gradient of time-stept,mtis a biased first moment estimate,vtis a biased second raw moment estimate, bothβ1andβ2are exponential decay rates for the moment estimates,m^tis a bias-corrected first moment estimate,v^tis a bias-corrected second raw moment estimate,Mtis a parameter,andϵis a very small constant.
In order to solve over-fitting problems of a neural network withL-layer hidden layer,the Dropout is used to randomly reset the partial weight or outputs of any neuron in the hidden layer to zero.The principle is Eqs.(11)-(12)[20].

2 Experiment and analysis
2.1 Experimental data
The experimental data are 8 000 vessels which come from China Classification Society[21], including more than 30 fields,such as ship name,call sign,length,breadth,depth,type,main engine model, main engine power, and etc.. There are more than 10 types of vessels, including tankers,bulk freighters, container ships, chemical ships, tugboats, cargo ships and passenger ships. The basic experimental data are shown in Tab.1.

Tab.1 Basic information of experimental data

Tab.1(Continued)
The paper makes the correlation analysis of the experimental data,and the correlation coefficient matrix diagram is shown in Fig.3. It can be seen that the correlation coefficientRbetween main engine power and length, breadth, depth is 0.82, 0.72 and 0.74 respectively, and shows a strong positive correlation.
2.2 Experiment
2.2.1 Data preparation
In the paper, the data of 8 000 vessels are preprocessed.We not only delete the data which lack the field information, such as length(L), breadth(B), depth(D), type(T) and main engine power(P), but also delete the data which do not meet the screening standard.3698 pieces of data that meet the criteria are obtained and their order is randomly disrupted.

Fig.3 Correlation diagram of experimental data

The vessel type adopts One-Hot coding and for other fields of the vessel, data are normalized by Eq.(14).

whereX′ is the normalized data,XmaxandXminare the maximum and minimum values of the sample respectively.
2.2.2 Evaluation indicator of GMM-DNN model
In the paper, the experiment is evaluated by mean-square error (MSE), root mean-square error(RMSE),absolute percentage error (APE)and mean absolute percentage error (MAPE).The definitions are shown in Eqs.(15)-(18),whereNis the number of samples,yiandf( )xiare the true and predictive values for theith sample points.


2.2.3 Model establishing
Artificial neural network library (Keras) is used in experiments to build GMM-DNN model.The hidden layer is a fully-connected neural network.The loss function isMSEin Eq.(15).
The preprocessed data are randomly divided into training set and test set according to the proportion of 7:3.The model parameters are randomly initialized and trained by back propagation algorithm.Minimum values are obtained by multiple training to prevent the model from falling into local optimum.After the model training,the optimal training model is saved.
The trained model and input ship features are loaded in experiments so the main engine power can be predicted.At the same time,the prediction effect is evaluated by Eqs.(15)-(18).
2.3 Experimental results and analysis
2.3.1 Exploration of the best input type of DNN
In this paper, the optimal parameters of GMM-DNN model are determined by using multiple parameters and multiple experiments. Firstly, it is necessary to explore the optimal network layer number and neuron number of DNN. In the experiment, we use SGD, Adam and Adam-Dropout to optimize the model.The number of hidden layers is set as 3-13,the neurons number of each hidden layer is set as 1-50, and the number of iterations is set as 100-1000, then the experimental step and batch-size are set as 100 and 20 separately. Multiple experiments show that the best results can be got when there are 5 hidden layers and 11 neurons of each hidden layer in the model.Finally, 10 parallel experiments with six different input combinations are performed using the above rules.The best results of every experiment are recorded in Tab.2.Among these different input combinations, the input combination of‘L,B,DandT’shows the most outstanding prediction effect and itsMAPEof test set is 15.81%.

Tab.2 Comparison of DNN using different input combinations and optimizers
2.3.2 Main engine power prediction effect of GMM-DNN
In this paper,GMM uses ship characteristics to classify ships,DNN uses clustering results and ship characteristics to predict the main engine power.Firstly,the inputs of GMM and DNN are separately set asL,B,D,TandL,B,D,T,C. Then multiple experiments show that the clustering effect is the best when the number of GMM clusters is set as 4.Finally,a hundred vessel samples are randomly selected to evaluate the trained GMM-DNN models. The evaluation results are shown in Fig.4.

Fig.4 Comparison of predicted values and real values
In this experiment,theMAPEof GMM-DNN is 14.57%,the maximum and minimumAPEare 40.75%and 0.23%respectively.
The comparison of prediction effect between DNN and GMM-DNN based on the same dataset is shown in Fig.5.

Fig.5 Comparison of predicted values and real values
It can be seen from the figure that the error of GMM-DNN is smaller than that of DNN, which indicates that the GMM-DNN proposed in this paper effectively improves the anti-interference ability and the practicability of the system.Multiple experiments show that GMM can discover clustering rules hidden in a large number of data without any prior knowledge.In addition,as a pre-processing step of DNN, GMM can discover deeper knowledge. In this experiment, GMM can identify the same type of vessels and even different types of vessels with similar principal dimensions.It improves the overall efficiency and quality of the model.
2.3.3 Effect comparison of four models of main engine power prediction
In order to compare the prediction effect with the GMM-DNN mentioned above,we use a multivariate linear regression equation established by IBM SPSS® software, whose optimal parameters are obtained by multiple experiments. The main engine power is set as a dependent variable. The different combinations ofL,B,DandTare set as independent variables, where the vessel type needs to be converted into virtual variable. The model summary is shown in Tab.3. In the model,Ris the multiple correlation coefficient andR2is the proportion of explainable variance in the dependent variable variance.

Tab.3 Model summary
The experimental results show that when the independent variables areL,B,DandT,theR2of the model achieves the largest value while the standard error achieves the smallest one.The prediction of this model is effective and the results of variance analysis (ANOVA)are shown in Tab.4.

Tab.4 ANOVA
In the experiment,F-test is the overall test of the whole regression equation. Based onFboundary table,the critical value ofFis 1 669 248 303 and it is lower than that in Tab.4.So,every explanatory variable has a significant impact on the dependent variable and the sig value is less than 0.05.The model has statistical significance.
One hundred vessel samples are randomly selected to evaluate the trained model. TheRMSEof the main engine power is 4 870.717 0 kW and theMAPEis 42.86%.
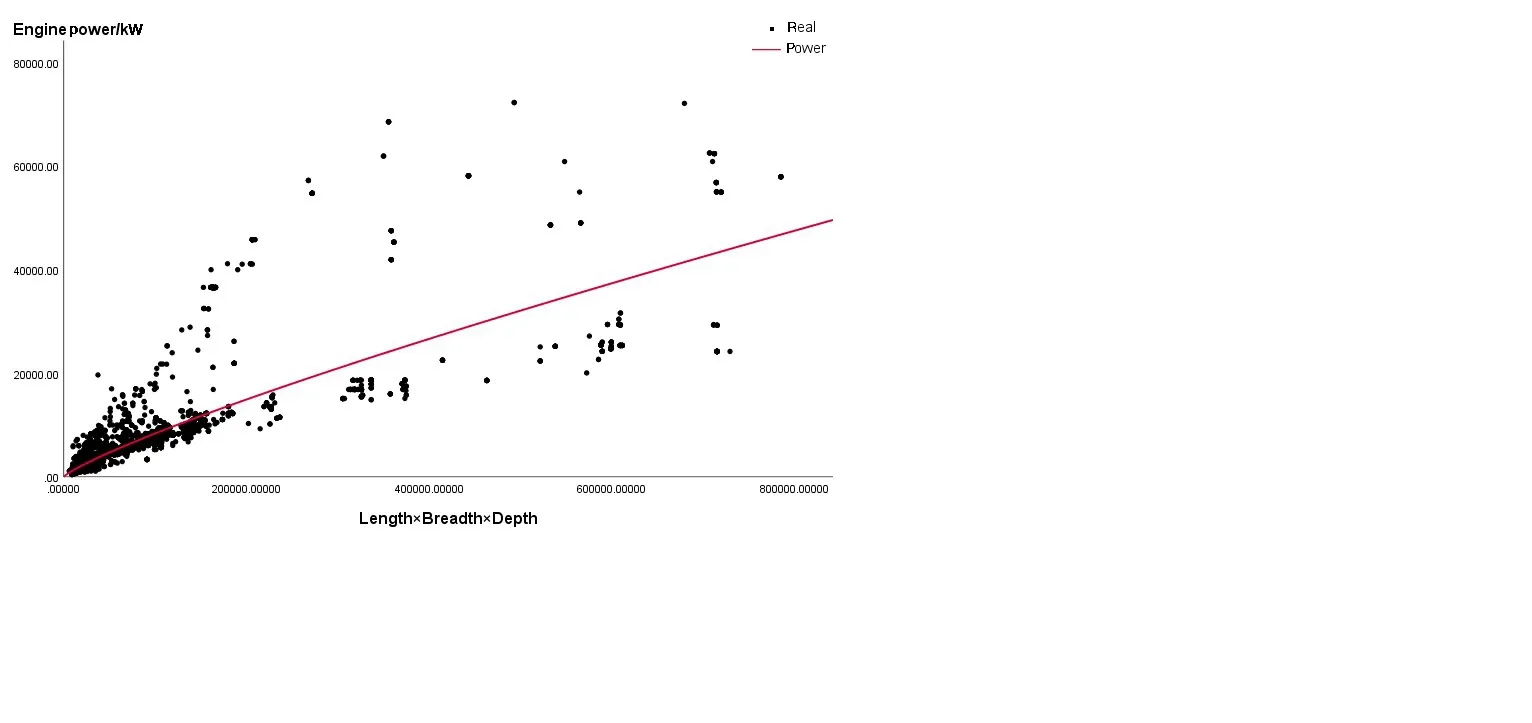
The nonlinear regression equation is also obtained by SPSS.The main engine power is set as a dependent variable. The product ofL,BandDis set as the variable. The summary of model curve estimation is shown in Tab.5.
The experimental results show that when the curve is a power function,R2achieves the largest value and the significant result is 0.000. This model passes the test of significance and the prediction is most effective.The regression results of this model are shown in Fig.6.
Based on the same pre-processed data, multivariate linear regression, nonlinear regression,and DNN are compared with GMM-DNN proposed in this paper.The experimental results are shownin Tab.6.TheMAPEof GMM-DNN is 14.57%,which is 28.27% lower than that of multiple linear regression, 23.36% lower than that of non-linear regression, and 1.24% lower than that of DNN. It can be seen that GMM-DNN has the best effect in the engine power prediction for large vessels.

Tab.5 Summary of model curve estimation

Fig.6 Regression analysis of power function
3 Concluding remarks

Tab.6 Results of different methods on power prediction
In this study,a power prediction method of main engine based on Gaussian mixture model and deep neural network is presented.The experimental results show that the accuracy of this method is significantly improved compared with the traditional method in the engine power prediction for large vessels.This method will provide methodological guidance and data support for perfecting engine power data of large vessels, and for predicting global vessel fuel consumption and regional exhaust emissions.
杂志排行
船舶力学的其它文章
- Responses of Large-ship Mooring Forces Based on Actual Measurement
- Experimental Study on Fatigue Crack Growth of Compact Tensile Specimens Under Two-Step Variable Amplitude Loads with Different Cyclic Ratios
- Study on Influence Law of System Parameters on the Dynamic Response of High-static-low-dynamic Stiffness Vibration Isolator Working Under Off-design Condition
- Bivariate Kernel Density Estimation for Meta-ocean Contour Lines of Extreme Sea States
- Study on the Tip Vortex Control Effect and Rule of Pump Jet Thruster by Groove Structure
- On Scale Effect of Open Water Performance of Puller Podded Propulsors Based on RANS
