Point-cloud segmentation of individual trees in complex natural forest scenes based on a trunk-growth method
2021-12-24QianweiLiuWeifengMaJianpengZhangYichengLiuDongfanXuJinliangWang
Qianwei Liu · Weifeng Ma · Jianpeng Zhang ·Yicheng Liu · Dongfan Xu · Jinliang Wang
Abstract Forest resource management and ecological assessment have been recently supported by emerging technologies. Terrestrial laser scanning (TLS) is one that can be quickly and accurately used to obtain three-dimensional forest information, and create good representations of forest vertical structure. TLS data can be exploited for highly signif icant tasks, particularly the segmentation and information extraction for individual trees. However, the existing singletree segmentation methods suf fer from low segmentation accuracy and poor robustness, and hence do not lead to satisfactory results for natural forests in complex environments.In this paper, we propose a trunk-growth (TG) method for single-tree point-cloud segmentation, and apply this method to the natural forest scenes of Shangri-La City in Northwest Yunnan, China. First, the point normal vector and its Z-axis component are used as trunk-growth constraints. Then, the points surrounding the trunk are searched to account for regrowth. Finally, the nearest distributed branch and leaf points are used to complete the individual tree segmentation.The results show that the TG method can ef fectively segment individual trees with an average F-score of 0.96. The proposed method applies to many types of trees with various growth shapes, and can ef fectively identify shrubs and herbs in complex scenes of natural forests. The promising outcomes of the TG method demonstrate the key advantages of combining plant morphology theory and LiDAR technology for advancing and optimizing forestry systems.
Keywords Terrestrial laser scanning · Point-cloud ·Northwest Yunnan · Natural forests · Single-tree segmentation · Trunk-growth
Introduction
Ef fective monitoring and management of forest resources plays a vital role in maintaining sustainable forest development, monitoring and control of forest pests, protecting biodiversity, and assessing f ire hazards (Oveland et al. 2017;Xiao et al. 2019; Ma et al. 2020; Windrim and Bryson 2020).Numerous studies have demonstrated that remote-sensing technologies can be used to ef fectively and reliably monitor and estimate forest resources (Strîmbu and Strîmbu 2015).As a popular remote-sensing technology, light detection and ranging (LiDAR) can be used to obtain information (such as target position, and height), characterize the spatial vegetation structure, and describe and monitor forest structure and functions (Liu et al. 2016, 2018, 2020; Lou et al. 2019;Yang et al. 2020).
The airborne laser scanning (ALS) method can be used to obtain a substantial amount of forest point-cloud data.However, the top-down scanning mode of this method only allows it to easily capture the crown part of a tree while largely overlooking its trunk and branch parts. This shortcoming limits ALS applicability, especially at the scale of individual trees (Zhong et al. 2017; Asadilla et al. 2020).Alternately, the terrestrial laser scanning (TLS) method adopts a bottom-up scanning mode which captures the trunk, branches, and leaf points with high density and integrity within a forest. This desirable TLS capability makes up for the afore-mentioned ALS shortcoming, and of fers great advantages in the study of forest understory structures(Liang et al. 2012; Cabo et al. 2018 ; Ma et al. 2019; Wang et al. 2019). Reasonable and accurate segmentation of a single tree from TLS point-cloud data can be ef fectively utilized to obtain key information for any tree (Lu et al. 2020),such as its height (Unger et al. 2014), crown width (Harikumar et al. 2017), diameter-at-breast height (DBH) (Henning and Radtke 2006), and biomass (Lu et al. 2020). Such information is of great signif icance for quick and accurate understanding of forest resource information, and for eliminating the costs of traditional f ield surveys.
The TLS-based single-tree segmentation method is more challenging than the ALS-based one. Maas et al. ( 2008) f irst estimated the position and DBH of a single tree by detecting circles centered at the single-tree position, visualizing an imaginary cylinder within a certain range and segmenting the individual tree. Cabo et al. ( 2018) projected the cloudpoint coordinates onto a two-dimensional plane and constructed a Voronoi diagram (Erwig 2000; Rushdi et al. 2017)for single-tree segmentation based on the detected position.The above methods achieve good single-tree segmentation results in forests with sparse-dispersed trees. However, in natural forests af fected by factors of sunlight and water, the stands are dense and individual trees are often of irregular shapes. Due to the lack of topological relationships among the TLS-based point-cloud data samples, canopies of individual trees with intersecting tree branches or overlapping canopies cannot be easily identif ied by cylinder or linear cutting methods. Xing et al. ( 2017) investigated the problem of extracting irregular-shaped trees of Mongolian oak (Quercus mongolicaFosch. ex Ledeb.) and achieved single-tree segmentation through point-cloud voxelization and hierarchical clustering. While this method works fairly well for artif icial forests, i.e., plantations, individual tree segmentation rate from 95 to 100%, its application in complex natural forests remains to be studied. Tao et al. ( 2015) proposed the comparative shortest-path (CSP) method. This method f irst uses the algorithm of density-based spatial clustering of applications with noise (DBSCAN) to identify individual trees. Then, a graph-theoretical method is followed to assign points to the shortest-path trunk. Finally, canopies are localized and single trees are thus segmented. However,shrubs and herbs are typically clustered in natural forests,and the DBSCAN-based identif ication of individual trees also causes serious over-segmentation.
To summarize, the existing single-tree segmentation methods are dif ficult to apply in natural forests with complex stand patterns. In this study, we seek to enhance the state of the art in single-tree segmentation through a trunk-growth(TG) algorithm and apply this to data collected in a natural forest in Shangri-La City, Northwest Yunnan, China. In this algorithm, key seed points are selected and used to extract the trunk of an individual tree. The branch points are then grown based on the trunk points. Finally, the nearest-neighbour distance allocates the branch and leaf points and completes the segmentation process. In this study, theF-score is used as an evaluation index to compare the TG method with various single-tree segmentation methods to study its segmentation accuracy and reliability.
Materials and methods
Study area
The study area is located in Shangri-La City (26° 52′–28° 52′N, 99° 20′–100° 19′ E) of the Diqing Tibetan Autonomous Prefecture in Northwest Yunnan Province. The landform is essentially alpine with an average elevation of 3460 m a.s.l.The region is mountainous with a low temperature, monsoon climate. Forest cover is as high as 76% and the vegetation is rich with multiple species, (includingPinus yunnanensisFranch.,Pinus densataMast.,Picea asperataMast., andQuercus aquifolioidesRehd. et Wils.) (Fig. 1).
Data acquisition and pre-processing
Sample plot usually refers to a plot which fully ref lects the average stand characteristics of the forest. Such a plot is typically a circle with a radius of 4–15 m (Liang et al. 2016).Two natural forest sample plots were selected in a natural forest in Shangri-La City in August 2016 and October 2019.A tape measure and laser rangef inder determined the extent of the plot, record the tree species and number of trees.Center coordinates, elevation, and slope were obtained with a handheld GPS instrument (Table 1). A Leica P40 TLS LiDAR was used to scan the plots and return the data ina multi-station mode (Table 2). The point-cloud data was spliced using Cyclone commercial software.

Fig. 1 Maps of the study area:a China and the Northwest Yunnan Province; b location of the study area in Yunnan; c digital elevation model (DEM)of Shangri-La City

Table 1 Description of the environment of the two sample plots
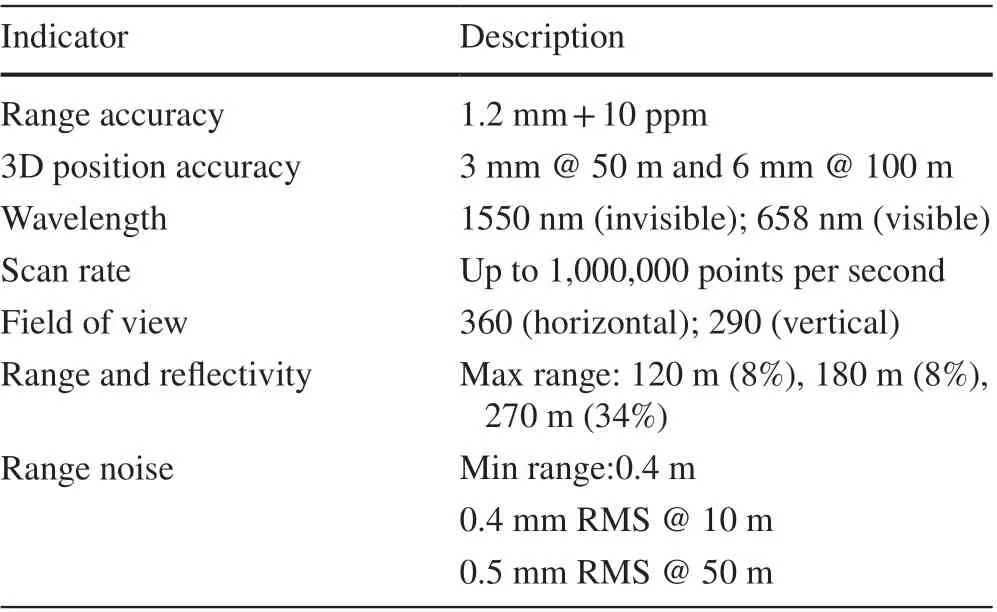
Table 2 Specif ications of the Leica P40 LiDAR
The two sample plots are sites with undulating topography where point-cloud data cannot be used directly and thus pre-processing steps are required. First, improved progressive triangulation f iltering (Zhao et al. 2016) identif ies ground points and carries out height normalization. The point-data is cropped to the size of the plot (plot 1 contains 3,638,235 points, plot 2 4,329,903 points, and stored in txt format) (Fig. 2).
Principle and steps of the trunk-growth algorithm
Principle
The trunk, branches, and leaves are closely related and largely inseparable; the trunk produces the branches and connects them with the leaves (Jin 2010). Based on plant morphology principles, the trunk of an individual tree is f irst extracted. Then the branches are grown out from the trunk. Finally, the nearest-neighbour method is used to distribute the branches and leaf points in order to complete the single-tree segmentation. Specif ically, our proposed methodincludes four steps of trunk extraction, fragment merging,trunk growth, and localization of branch and leaf points.Each of these four steps is discussed in detail below.
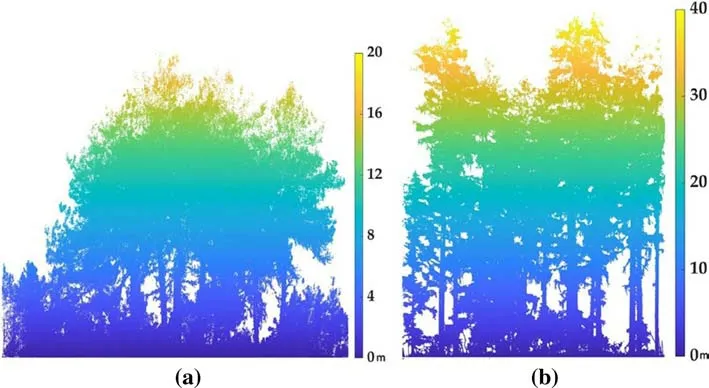
Fig. 2 Point-cloud data for the two forest plots: a Pinus densata point-cloud data for plot 1 after normalization; b Picea asperata point-cloud data for plot 2 after normalization
Trunk extraction
Extracting individual tree trunks is a prerequisite for singletree identif ication and segmentation in natural forests. Liang et al. ( 2012) calculated the normal vector at each cloud point and took the Z-axis componentZ n(0‒1) of the normal vector as the characteristic value of that point on the vertical plane.The smaller that value is, the closer the point to the vertical plane. This observation provides guidance for the extraction of the trunk of an individual tree. Calculating the normal vector at a certain point can be formulated as the problem of f itting a plane to that point and itsk-neighbouring points.Assuming thatP iis one point in the collected point-cloud data, the covariance matrix based onP iand itsk-neighbouring points is given by (Guo et al. 2018; Zhang et al. 2019):

?

Taking theZ nvalue and the normal vector as trunk extraction constraints, the region-growth algorithm is enforced to extract the trunk of each tree. The pseudo-code of this enhanced trunk extraction algorithm is as follows:
The algorithm traverses the point-cloud data, sets the points withZ nvalues below 0.05 as seed points, and then searches and traverses the adjacent points. When the normal vector angle between the seed point and a neighbour point is below a certain threshold, the neighbour point is assigned to the same trunk region. If theZ nvalue dif ference between the seed and neighbour points is small, the neighbour point is set as a seed point for further growth. While existing area growth methods require manual intervention, our algorithm can f ind seed points for trunk extraction in a highly automated manner.

?
Fragment merging
In f irst step, automating the search for seed points may result in the growth of some non-trunk points. These points produce many categories that are not trunk and should not be merged in categories. The points can only meet the growth conditions in a small area, resulting in a low number of category points. Therefore, in step (1), all category points are counted, and the categories with fewer points are removed.This completes the trunk extraction step.
Trunk growth
The branches connect and bridge the trunk with the leaves.The branches are assumed to be connected with the trunk,and the point-cloud data satisfy this assumption. By f inding the adjacent points around the trunk, the trunk can be grown again. The pseudo-code of the trunk-growth algorithm is as follows:
This trunk growth algorithm is similar to the trunk extraction algorithm in step (1). The former modif ies the selection conditions of seed points in order to enforce branch growth.The nearest-neighbour point of the trunk is taken as the seed point and calculates the normal-vector angle between the seed and k-nearest points. When certain conditions are satisf ied, the adjacent point is assigned the same category as the seed one. When the distance between the adjacent and the seed points does not exceed a certain threshold value,the two points are considered to belong to the same branch trunk. The threshold represents the maximum length that a branch can grow and is usually determined by the growth of the tree.
Distribution of branches and leaves
The above steps result in the extraction of the trunk and a part of the branches of an individual tree. In this current step, the remaining branches and leaves are added. In fact,the structure of natural forests is often associated with vertical stratif ication. The strata are classif ied according to the dif ferent heights to which their plants grow: a herb layer, a shrub layer, and a tree layer (Shugart et al. 2010; Zhao et al.2013). The United Nations Food and Agriculture Organization (FAO) def ines understory vegetation as perennial woody plants with heights > 0.5 and < 5.0 m at maturity(FAO 2003). Therefore, a height between 0.5 and 5.0 m was selected as the vertical stratif ication boundary to distinguish the tree and understory vegetation layers. A value of ‒1 was assigned to the category below this boundary, the distance from the branch point to the surrounding known points was calculated, and the nearest category for assignment was selected until all points were classif ied. The single-tree segmentation steps are therefore completed.
Segmentation performance evaluation
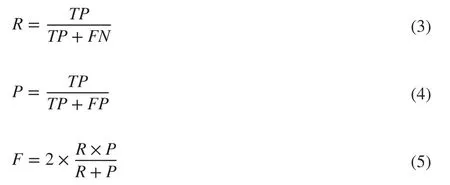
When an individual tree is successfully segmented, the result is counted as a true positive (TP). Otherwise, when a tree is incorrectly segmented as another nearby tree, the result is counted as a false negative (FN). When no individual tree exists but data points are segmented as belonging to one,the result is counted as a false positive (FP). Based on these values, we def ine the recall (R), the precision (P), and theF-score, respectively, as follows:
These metrics are computed and used for evaluating the single-tree segmentation outcomes. In addition, the performance of our method was compared against that of the comparative shortest-path (CSP) method (Tao et al. 2015). First of all, CSP uses DBSCAN clustering for trunk identif ication,calculates the DBH, and connects all point clouds to form a cloud map. Then, the transportation path from each point to the adjacent trunk diameter is calculated. Finally, tree crown points are assigned to the shortest transportation path, which is calculated as follows:the interested reader might consult Liu and Ramakrishnan( 2001) or Zhang et al. ( 2020).


Fig. 3 Comparison of singletree segmentation results of the TG, CSP, and PCS algorithms

Fig. 4 Comparison of the shrub-and-herb map segmentation results (after separation from the tree layer) of the TG,CSP, and PCS algorithms

Table 3 Performance measures for three single-tree segmentation methods applied to two plots
Results
Li et al. ( 2012a) proposed an ALS-based point-cloud segmentation (PCS) method that combines regional growth with thresholding. In this method, the tree height is set as that of the highest point in the point-cloud data, and a tree is obtained through regional growth. Then, the distances between a known individual tree and other points are computed for step-by-step single-tree segmentation. This algorithm is suitable for single-tree segmentation based on ALS data or, to some extent, TLS data. In our study, we compared the performance outcomes obtained by our TG algorithm against those of the classical PCS and CSP algorithms. The comparative results are shown in Figs. 3 and 4 (the segmented trees are displayed in dif ferent colours), and the f inal accuracy results are shown in Table 3. Additionally, we used software LiDAR 360 to implement CSP and PCS algorithm in laptop (Windows 10, CPU-i5-4210H@2.9 GHz, Memory 16 g) and Matlab 2019b to run TG. The runtime of TG algorithm was 7 min and 32 s in plot 1, and 7 min and 56 s in plot 2.
The TG method performed well on both plots (Table 3).For plot 1, theRvalue reached 1.00, and each tree was wellsegmented, with anF-score of 0.96. For plot 2, theRvalue was 0.95 and theF-score 0.95, but one of the trees grew so poorly that it was wrongly assigned to the shrub layer during fragment merging. TheF-score of the TG method is the highest among the three methods. Although the CSP method can segment individual trees fairly well, it is prone to errors due to the inf luence of shrubs and herbaceous plants. These errors result in a lowerPvalue, which ultimately decreases theF-score. The PCS method showed serious under-segmentation problems for both plots. Also, the PCS method lacks constraints and cannot easily separate two individual trees with intersecting canopies. This, in turn,leads to a lowRvalue and poor single-tree segmentation performance. Nevertheless, the TG and CSP methods have prior constraints for identifying individual trees, and hence they can be used to segment individuals more accurately.

Fig. 5 Comparison of the segmentation results for dif ferent tree shapes; a– d TG-based segmentation results; e– h CSP-based segmentation results; a, e canopy segmentation for standing trees; b, f canopy segmentation for irregular individual trees; c, g canopy segmentation for inclined individual trees; d, h separation of shrubs and herbs from trees
Discussion
Comparison of the TG and CSP segmentation results with dif ferent tree shapes
The TG and CSP methods (which exhibited higherRvalues than the PCS method) were compared on tasks of canopy segmentation and segmentation of individual trees with irregular trunk shapes.
(1)Canopy segmentation: Both the TG and CSP methods resulted in canopy over-segmentation (Fig. 5 a, e).Naturally formed individual trees in natural forests usually have no restrictions on their growth locations. The distance between two individual trees is also typically uneven, causing crowns to intersect during growth. The points of the two trees blend. At present, high-quality canopy segmentation cannot be obtained using either the TG or the CSP methods. Solutions for this problem should be investigated in future work.
(2)Irregular trunk and canopy segmentation: Individuals of the same species in a stand compete for nutrients due to sunlight, moisture, and other factors. In fact, the more nutrients a single tree obtains, the more divergent the growth of its branches and leaves becomes. With limited space, trees with few nutrients suf fer more, and exhibit slow growth and poor development. Likewise, the conventional growth direction of a t species may be changed to a certain extent. For example, the trunk may take anSshape (Fig. 5 b, e). Both the TG and CSP methods handle better the identif ication and segmentation of such irregular-shaped trees. In particular, the TG method assigns crown points according to the nearest tree trunks, and results in good performance under appropriate parameter settings. The CSP method identif ies the crown points by seeking the shortest path within a graph representation.
(3)Segmentation of trees with inclined trunks(Fig. 5 c, g):For an individual tree, the TG method identif ies the trunk,and then continues to grow the trunk and branch points.This approach enables the identif ication of individuals with large tilt angles, while canopy segmentation maybe unsatisfactory. The CSP method performs poorly on inclined trunks due to its tendency to split a tree into two segments. This limitation can be ascribed to the fact that the CSP algorithm prioritizes the identif ication of a single tree at DBH. When a tree has a large tilt angle or forms a fallen tree with a trunk height below 1.3 m, the tree will be wrongly identif ied or missed altogether. For handling such a tree, the TG algorithm has an obvious advantage.
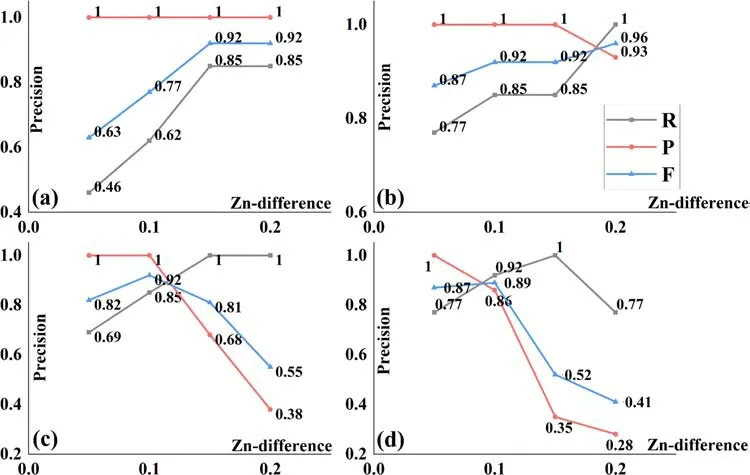
Fig. 6 Ef fects of the normal vector angle (threshold 1)and the Z n value dif ference(threshold 2) on the recall ( R),precision ( P), and F-score ( F)of the TG-based single-tree segmentation outcomes; a the normal vector angle is 10°; b the normal vector angle is 20°; c the normal vector angle is 30°;d the normal vector angle is 40°
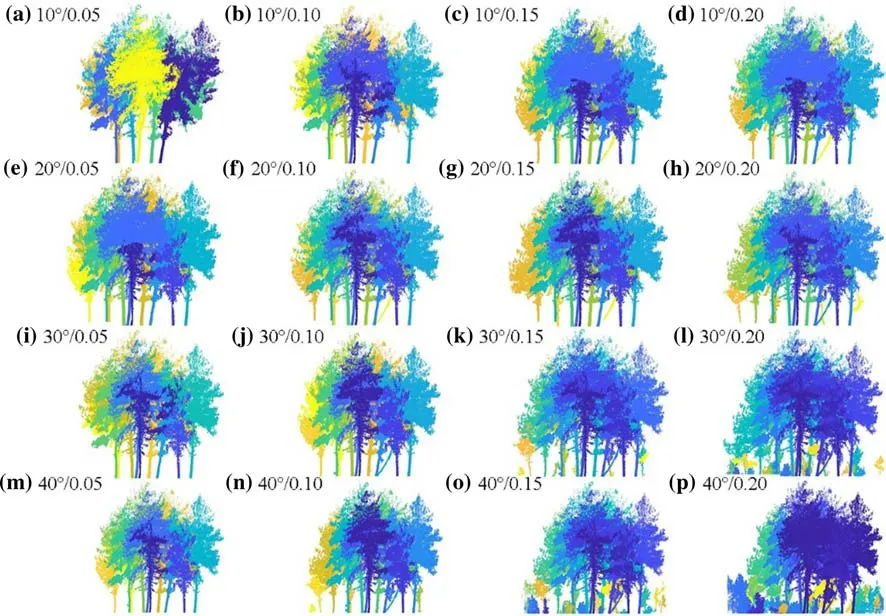
Fig. 7 Visual segmentation results with dif ferent threshold combinations (threshold 1/threshold 2)
(4)Identifi cation of shrubs and herbs: Shrubs and herbaceous plants are competitors of trees in natural forests.Studies have demonstrated that shrubs and herbs usually interfere with the estimation of single-tree parameters(tree position, DBH, etc.) (Li et al. 2012b). As shown in Fig. 5 d, h, the CSP-based single-tree segmentation cannot accurately separate the trunks, herbaceous vegetation, and shrubs. This is because the algorithm considers all points in a sample plot to be tree points, ignoring the complexity of natural forests. Indeed, separating non-trunk points near the trunk using the shortest-path method is challenging, and both types of points are often mixed into one class. The TG algorithm sets a f ixed height that can ef fectively separate the understory environment (including shrubs and herbs) from the trees.
Parameter sensitivity for the TG method
In the proposed TG method, the trunk extraction process obviously has a great impact on the f inal crown segmentation. Trunk extraction is highly inf luenced in turn by the selection of two growth parameters: the normal vector angle (threshold 1) and theZ nvalue dif ference (threshold 2) between the seed and neighbour points. In our work, we vary these parameters in the intervals [10°, 40°] and [0.05,0.20], respectively, and investigate the parameter ef fects on the recall, precision, andF-score of the single-tree segmentation outcomes (Fig. 6).
When threshold 1 is 10° and threshold 2 is low, the results of trunk extraction and subsequent growth are poor, with anRscore of only 0.46. In fact, many individual trees that do not meet the conditions are wrongly included in the shrub and herb layers. By increasing threshold 2, the segmentation accuracy also increases, reaching the peak at 0.15 after which the accuracy does not increase. When threshold 1 is 20°, and threshold 2 is between 0.05 and 015, thePvalue is the highest. When threshold 2 is 0.20, thePvalue decreases,whileRreaches the highest value of 1.00. In addition, all individual trees are segmented at that threshold, but oversegmentation inevitably occurs and some of the shrubs and herbs are wrongly counted as tree parts. When threshold 1 is 30°,Rreaches the highest value of 1.00 at a threshold 2 value of 0.15, and all individual trees are segmented.As threshold 2 increases, more and more non-tree parts are wrongly segmented, andPgradually decreases. When threshold 1 is 40° and threshold 2 is 0.15, all individual trees are segmented, but over-segmentation occurs as well.When threshold 2 reaches 0.20, multiple trees are merged together, and theF-score andRshow trends of deterioration.WhenRreaches 1, theF-score curve gets closer to thePcurve. When threshold 1 is unchanged, the TG-based singletree segmentation accuracy increases with the increase of threshold 2, then decreases, showing a transition from undersegmentation to over-segmentation (Fig. 7).This demonstrated sensitivity of the TG algorithm to the two thresholds is the key to performance tuning in singletree segmentation.
Recommended TG parameter settings
In this paper, the proposed method is based on the patterns of plant morphology. The characteristicZ nvalue is used as an essential constraint for trunk extraction, branch growth,and separation of understory vegetation. Good results were obtained in the two study plots. The calculation ofZ nrequireskneighbour points. In earlier studies, the value ofkwas usually taken as between 8 and 32 (Zhang et al.2018). Fewer neighbourhood points are expected to lead to incomplete segmentation. However, more points increase the computational cost, so in the TG method, we take the median value of 20 as the number of domain points. For plot 1, the threshold 1 value is 30°, the threshold 2 value is 0.14, and a height of 3 m is the threshold between trees and understory vegetation. For plot 2, the threshold 1 value is 40°, threshold 2 is 0.10, and the height threshold between trees and understory vegetation is 5 m. Therefore, we recommend the following parameter ranges: a threshold 1 range of 30°–40°, a threshold 2 range of 0.1–0.2, and an understory height threshold of 3.0–5.0 m.
When the trunk of a forest tree is blocked and has no associated point-cloud data, the branch points cannot be grown; the canopy points are better assigned to the closest category and theZ nvalue becomes more sensitive in upright trees. Also, trees with bending at the roots cannot be easily segmented by the TG method.
Botany is the science of studying plant morphology, ecology, distribution, etc. It provides a solid foundation for the study of LiDAR-based forestry methods. Tao et al. ( 2015)proposed the CSP algorithm based on plant ecology. Burt et al. ( 2018) carried out tree segmentation using the volume of the crown, the height, and the allometric growth relationship of crown width. Our paper summarizes the shortcomings of previous studies and proposes the TG algorithm according to the idea of “the trunk grows the branches, and the branches connect the leaves”. To a certain extent, the TG algorithm can be better applied to the sample plots in the natural stand in Shangri-La City. For future work, an indepth study would be made to combine plant morphology theory with point-cloud data analysis.
Conclusions
Ef fective and accurate approaches for single-tree segmentation help with quickly understanding single-tree information and achieving ef ficient management of forest resources.Such approaches are highly needed for monitoring forest biodiversity, water, and soil conservation capabilities. Based on the plant morphology theory, we sought to propose a novel method named the trunk-growth (TG) method. In this work, the segmentation accuracy and applicability of our algorithm were tested on point-cloud data collected for forest sample plots in a natural forest in Shangri-La City, northwest Yunnan, China. The performance of the TG method was evaluated using theF-score, comparing it with the CSP and PCS methods. TheF-scores of CSP and PCS were in the range of 0.36‒0.46, while the average TGF-score was 0.96,and the segmentation accuracy of TG was more successful.The trunk-growth method is able to handle inclined trees and more ef fectively reduce the interference of understory vegetation than the other methods.Nevertheless, the TG algorithm expands segments outward by extracting the single-tree trunk as the core because such a trunk is usually limited by neighbouring trunks. When the trunk is blocked in the canopy, some of the required data becomes missing, posing dif ficulties on TG-based canopy segmentation. The TG parameters need to be adjusted continuously to achieve the best results. Besides, theZ nvalue was used as the basis for extracting the trunk and can also be replaced by curvature or other feature values when the trunk is dif ficult to extract. Further performance improvements in canopy segmentation are expected to be the focus of future research.
Open AccessThis article is licensed under a Creative Commons Attribution 4.0 International License, which permits use, sharing, adaptation, distribution and reproduction in any medium or format, as long as you give appropriate credit to the original author(s) and the source,provide a link to the Creative Commons licence, and indicate if changes were made. The images or other third party material in this article are included in the article’s Creative Commons licence, unless indicated otherwise in a credit line to the material. If material is not included in the article’s Creative Commons licence and your intended use is not permitted by statutory regulation or exceeds the permitted use, you will need to obtain permission directly from the copyright holder. To view a copy of this licence, visit http://creat iveco mmons.org/licen ses/by/4.0/.
杂志排行
Journal of Forestry Research的其它文章
- Genome-wide identif ication and cold stress-induced expression analysis of the CBF gene family in Liriodendron chinense
- Decay rate of Larix gmelinii coarse woody debris on burned patches in the Greater Khingan Mountains
- Characterizing conservative and protective needs of the aridland forests of Sudan
- Accuracy of common stem volume formulae using terrestrial photogrammetric point clouds: a case study with savanna trees in Benin
- Appropriate search techniques to estimate Weibull function parameters in a Pinus spp. plantation
- A plotless density estimator with a Norton‑Rice distribution for ordered distances
