Letter to the Editor Soil carbon availability affects nitrogen transformation under irrigated lucerne
2021-12-22AdrianoS.NASCENTE,JonathanNU?EZ,ScottL.GRAHAM等
Dear Editor,
Approximately 55% of the agricultural land in New Zealand is grazed grassland to support the expanding dairy and meat industries.Intensified management practices such as irrigation,nitrogen(N)fertiliser application,and of forage crop provision are increasingly being adopted to meet the growing production demands.Given its ability in fixing N from symbiont rhizobia, thereby reducing the reliance on inorganic N fertilisers,lucerne(alfalfa,Medicago sativaL.)has been promoted as a forage species for dryland systems.Moreover, its deep roots can gain access to water during dry periods (Moot, 2012). Although grazing systems are economically profitable, 14% of national greenhouse gas emissions in New Zealand are accounted for by agriculturally derived nitrous oxide(N2O)emission.Furthermore,intensified management has been linked to nitrate(NO-3)leaching(Cameronet al.,2013)and losses of soil carbon(C)(Whiteheadet al., 2018). Accordingly, identifying management practices that can promote reduction in N2O emission whilst maintaining or enhancing soil C has become a priority.
Numerous previous studies have examined soil physical,microbial,and environmental variables that contribute to regulation of mineral N(NO-3and ammonium(NH+4))transformation to gaseous N2O in agricultural fields(Saggaret al., 2013). Addition of a C substrate to soil has been demonstrated to reduce mineral N transformation,thereby leading to reduction in NO-3leaching and N2O emission(Cameronet al., 2013). Reduction in mineral N transformation can occurviaimmobilisation resulting from increased microbial consumption of N in response to high C availability and enhanced microbial activity(Chaveset al.,2008).Transformation of mineral N to N2O can occur through different pathways depending on environmental conditions,including nitrification and complete denitrification to N2(Cameronet al.,2013).However,in highly fertile welldrained agricultural soils, nitrogenous gases such as N2O are derived from substrates predominantlyvianitrification(Liuet al.,2016),which is principally associated with the abundance of ammonia-oxidising bacteria(AOB)(Diet al.,2009).
Shepherdet al. (2010) applied C as sucrose at rates up to 24 Mg ha-1and sawdust at 9 Mg ha-1, along with urine as a N source, to ryegrass/white clover pasture and observed a reduction of up to 66%in mineral N leaching with the sucrose treatment compared with urine alone,but they did not measure N2O emission. Talbotet al. (2019)found that applications of urine at 12 Mg ha-1and sucrose at 24 Mg ha-1to ryegrass/clover and lucerne resulted in reduced soil mineral N leaching compared with the control with no C added,whereas the addition of a more recalcitrant C source(sawdust)had no effect;no significant treatment effect on N2O emission was detected though soil AOB abundance remained lower in the treatment with sucrose than in the control for up to 112 d after the start of treatment.Despite these observations on the effect of C input on N transformation,there is currently a lack of data on explicit effect of soil C availability on N transformation.Therefore,we tested the hypothesis that the addition of a C substrate would enhance C availability for microbial activity in soil,which would lead to C-mediated immobilisation of inorganic N and thereby reduction in nitrification and N2O emission.
We performed a 36-d preliminary field experiment to determine the direct effect of sucrose addition on C availability,microbial activity,mineral N concentration(NO-3and NH+4)in soil and N2O emission, as well as AOB abundance as an indicator of microbially driven N transformation,under irrigated lucerne over late summer(February and March)in 2019 at the Ashley Dene Research and Development Station(43.40°S,172.20°E,35 m above sea level),Lincoln,New Zealand.Irrigation was applied at approximately 3 mm d-1over the course of the experiment. The soil at the study site was an excessively drained stony Balmoral silty loam(Hewitt,2010),classified as a Udic Haplustept(Soil Survey Staff, 2006), with a mean bulk density of 1 380 kg m-3,a shallow topsoil of 0.2 m in depth, and 38% stone. The experiment was in a randomised block design with two treatments,sucrose addition at 3 Mg ha-1(equivalent to 1.27 Mg C ha-1)(SA)and a no-sucrose control in which the same amount of water was applied instead (CK), in four replicates.Each plot was 2 m×2 m,with a 0.5-m-wide buffer strip separating the plots,and the layout was orientated in a north to south direction to minimise differences in incident irradiance.Sucrose dissolved in 10 L water was applied on January 31 and February 15, 2019, and measurements of soil temperature(Ts),gravimetric water content(Ws),pH,C availability index(Ic),respiration rate(Rs),cold(Cc)and hot(Ch)water-extractable C concentrations,and NH+4and NO-3concentrations and N2O emission were made on the first day(February 1)and second day(February 17)after sucrose addition and subsequently at 3-d intervals.
At random locations within each plot,six soil samples were collected from depths of up to 100 mm using a steel corer(20 mm diameter)at 3-d intervals throughout the experiment(12 times). The sampling depth of 100 mm was selected because this zone shows most of the microbial activity in shallow stony soils(Diet al.,2009).After visible roots were removed,the collected samples were passed through a 2-mm sieve and then stored in air-tight polyethylene bags at 4°C.In the laboratory,measurements of pH were made using fresh soil samples at a soil to water ratio of 1:2.5. Subsamples from each fresh soil sample were weighed, oven dried at 105°C to a constant mass,and then reweighed to calculateWs. Water was added to 4 g subsample of each fresh soil sample to obtainWsat 60%of the maximum value.These suspensions were sealed in vials with a septum and incubated at 22°C. The rates of basal respiration were determined by removing gas samples from the air space above the soil using a syringe at 3 and 4 h after the start of incubation and injecting them into a stream of carbon dioxide(CO2)-free air leading to an infra-red gas analyser (Model LI-7000,LI-COR Biosciences,USA)for measurement of CO2partial pressure.This procedure was repeated using a duplicate set of samples. Values forIcwere calculated by dividing the basal respiration rates by the substrate-induced respiration rate(Chenget al.,1996).
Measurements ofCcandChwere made using the method in Haynes and Francis (1993) with modification. Fresh soil samples(3 g dry mass)were placed in polypropylene centrifuge tubes,shaken in 30 mL distilled water for 30 min,and centrifuged for 20 min at 3 500 r min-1.After filtering through a 0.45-mm cellulose nitrate membrane filter, the supernatant was collected for analysis ofCc.A further 30 mL of distilled water was added to the supernatant,and the tubes were shaken on a vortex shaker for 10 s,capped,and placed in a hot-water bath at 80°C for 16h.Each tube was then further shaken for 10 s and centrifuged for 20 min at 3 500 r min-1,and the supernatants was filtered again for analysis ofCh.Total C(inorganic and organic,although the inorganic fraction was less than 4%of the total)for both extracts was measured using a total organic C analyser (Model TOC,Shimadzu Corporation, Japan).Soil NH+4and NO-3were measured with a flow injection analysis system (Lachat QuikChem 8500 series 2,Lachat Instruments,USA)using 4 g sieved soil(adjusted to maintain a constant water content)that had been mixed with 40 mL 2 mol L-1KCl solution,shaken for 1 h,centrifuged,and filtered.
Measurements ofTsin the field plots were made between 9 and 10 AM at a depth of 50 mm using a hand-held thermocouple (Type E, Omega Engineering Ltd., USA).Measurements ofRswere made at a single location in each plot between 9 and 10 AM by placing a portable respiration system(Model LI-8100,LI-COR Biosciences,USA)within a PVC collar(100 mm diameter)that had been inserted in the soil to a depth of 50 mm 1 week prior to the start of measurement.The N2O emission was measured using one static chamber(250 mm diameter, 200 mm deep)in each plot.The chambers were sealed,and two gas samples were extracted from the headspace after 0,30,and 60 min using a syringe attached to a three-way stopcock.The gas samples were transferred to pre-evacuated glass vials and analyzed using a gas chromatograph (Model GC-17 A, Shimadzu Corporation,Japan)equipped with a63Ni-electron capture detector.A sample of the ambient air at the site was collected on each visit and used as a reference for calculating N2O emission.
Soil samples for DNA analysis were frozen in liquid N immediately after collection and stored at-80°C.DNA was extracted from 500 mg frozen soil using a NucleoSpin™96kit for soil(Macherey-Nagel,Germany)following the manufacturer’s protocol.Changes in AOB abundance was measured by determining the marker gene(amoA)abundance using quantitative polymerase chain reaction(qPCR)(Rotthauweet al.,1997).
The data obtained for all variables were assessed for normality and homoscedasticity using Anderson-Darling and Levene’s tests(Stephens,1976),respectively,with SAS software(SAS Inc.,USA).Differences in the means of variables were analyzed for significance using a one-way analysis of variance(ANOVA)between treatments and time,incorporating repeated measures. A least significant difference(LSD)test atP <0.05 was used to determine significant differences among mean values.
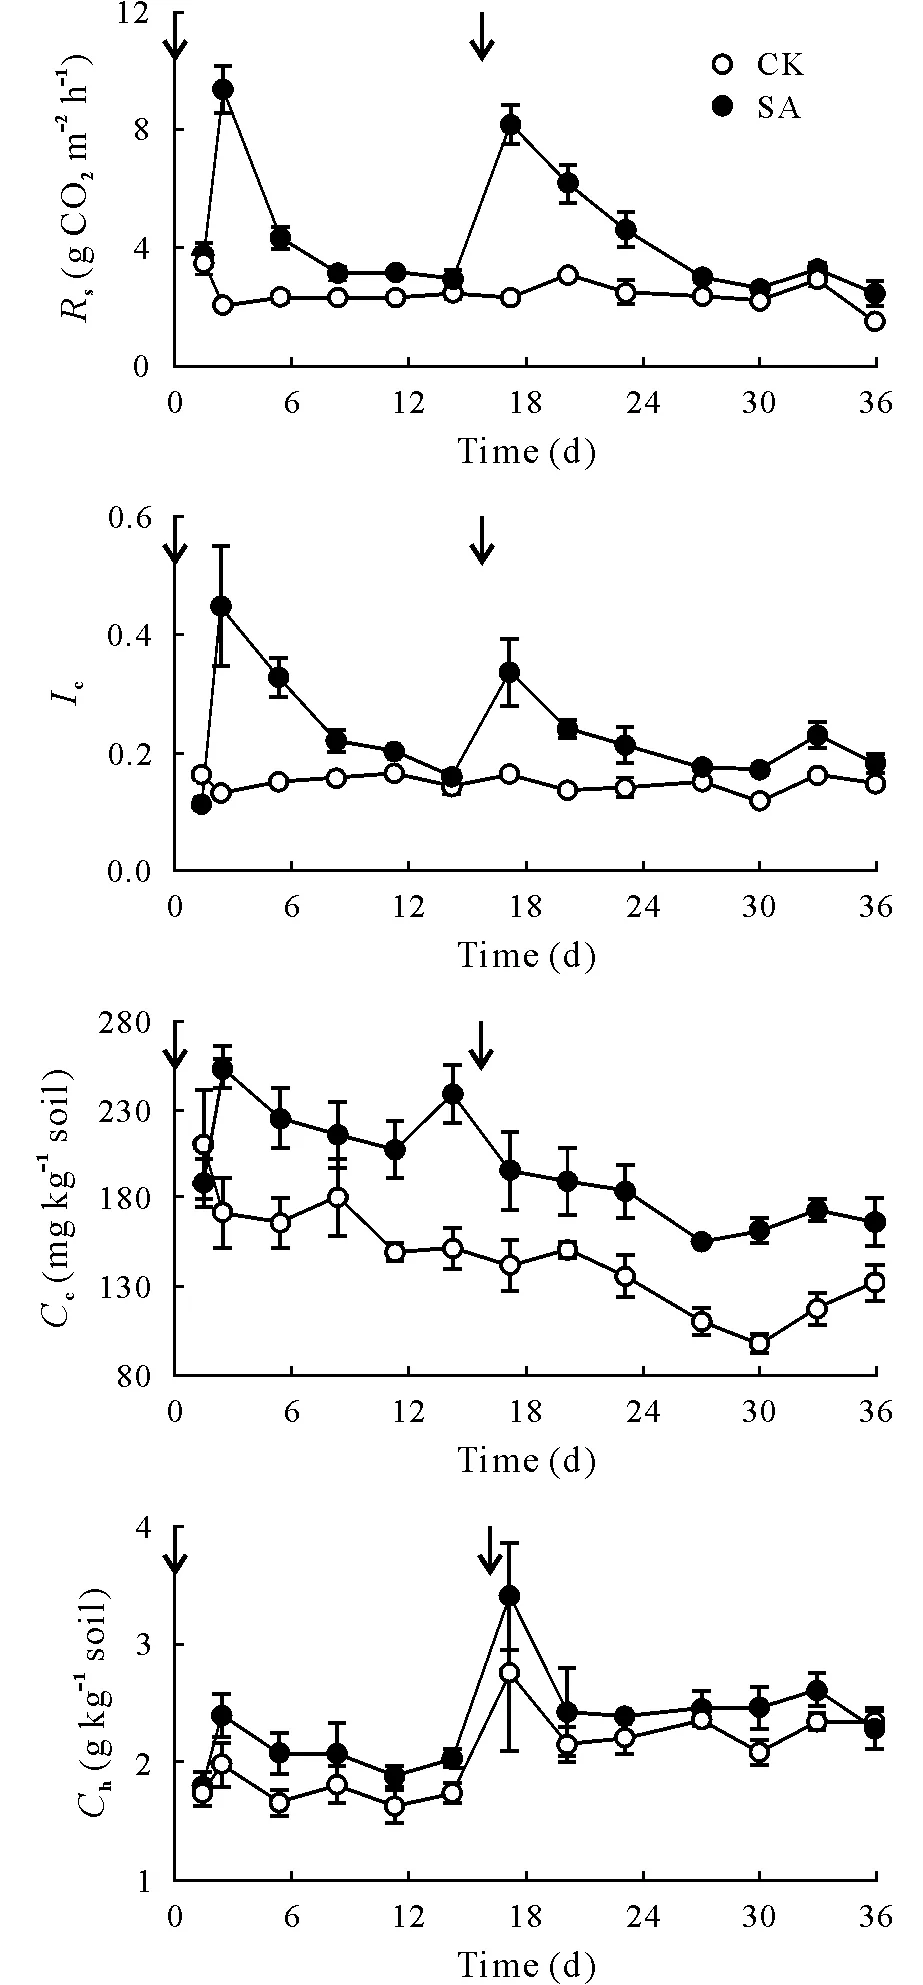
During the measurement period,Tsranged from 12 to 22°C,and bothTsandWswere slightly higher in SA than in CK(Fig.S1,see Supplementary Material for Fig.S1).However,even with irrigation,Wsdid not increase sufficiently to promote the development of anaerobic conditions.Values of pH measured in the different treatments remained similar until the second application of sucrose.After day 16,soil pH was slightly lower in SA than in CK.The applications of sucrose promoted initial increases inIcandRs,followed by declines over the subsequent 15 d (Fig. 1). Values ofCcwere likewise higher in SA,confirming that the amount of C applied was sufficient to increase C availability in the soil.The differences between treatments were considerably smaller with respect toCh. This relative insensitivity ofCh, along with the order of magnitude difference inChrelative toCc,indicated that hot water extraction may release larger recalcitrant C pools that are not readily available for microbial activity and thus was not affected by the application of sucrose.

Fig.1 Soil respiration rate(Rs),C availability index(Ic),and cold(Cc)and hot(Ch)water-extractable C concentrations in the field plots under irrigated lucerne with two treatments, sucrose addition at 3 Mg ha-1(equivalent to 1.27 Mg C ha-1)(SA)and a no-sucrose control in which the same amount of water was applied instead(CK).The arrows indicate the time points at which sucrose or water was added.Values are means±standard errors(n=4).
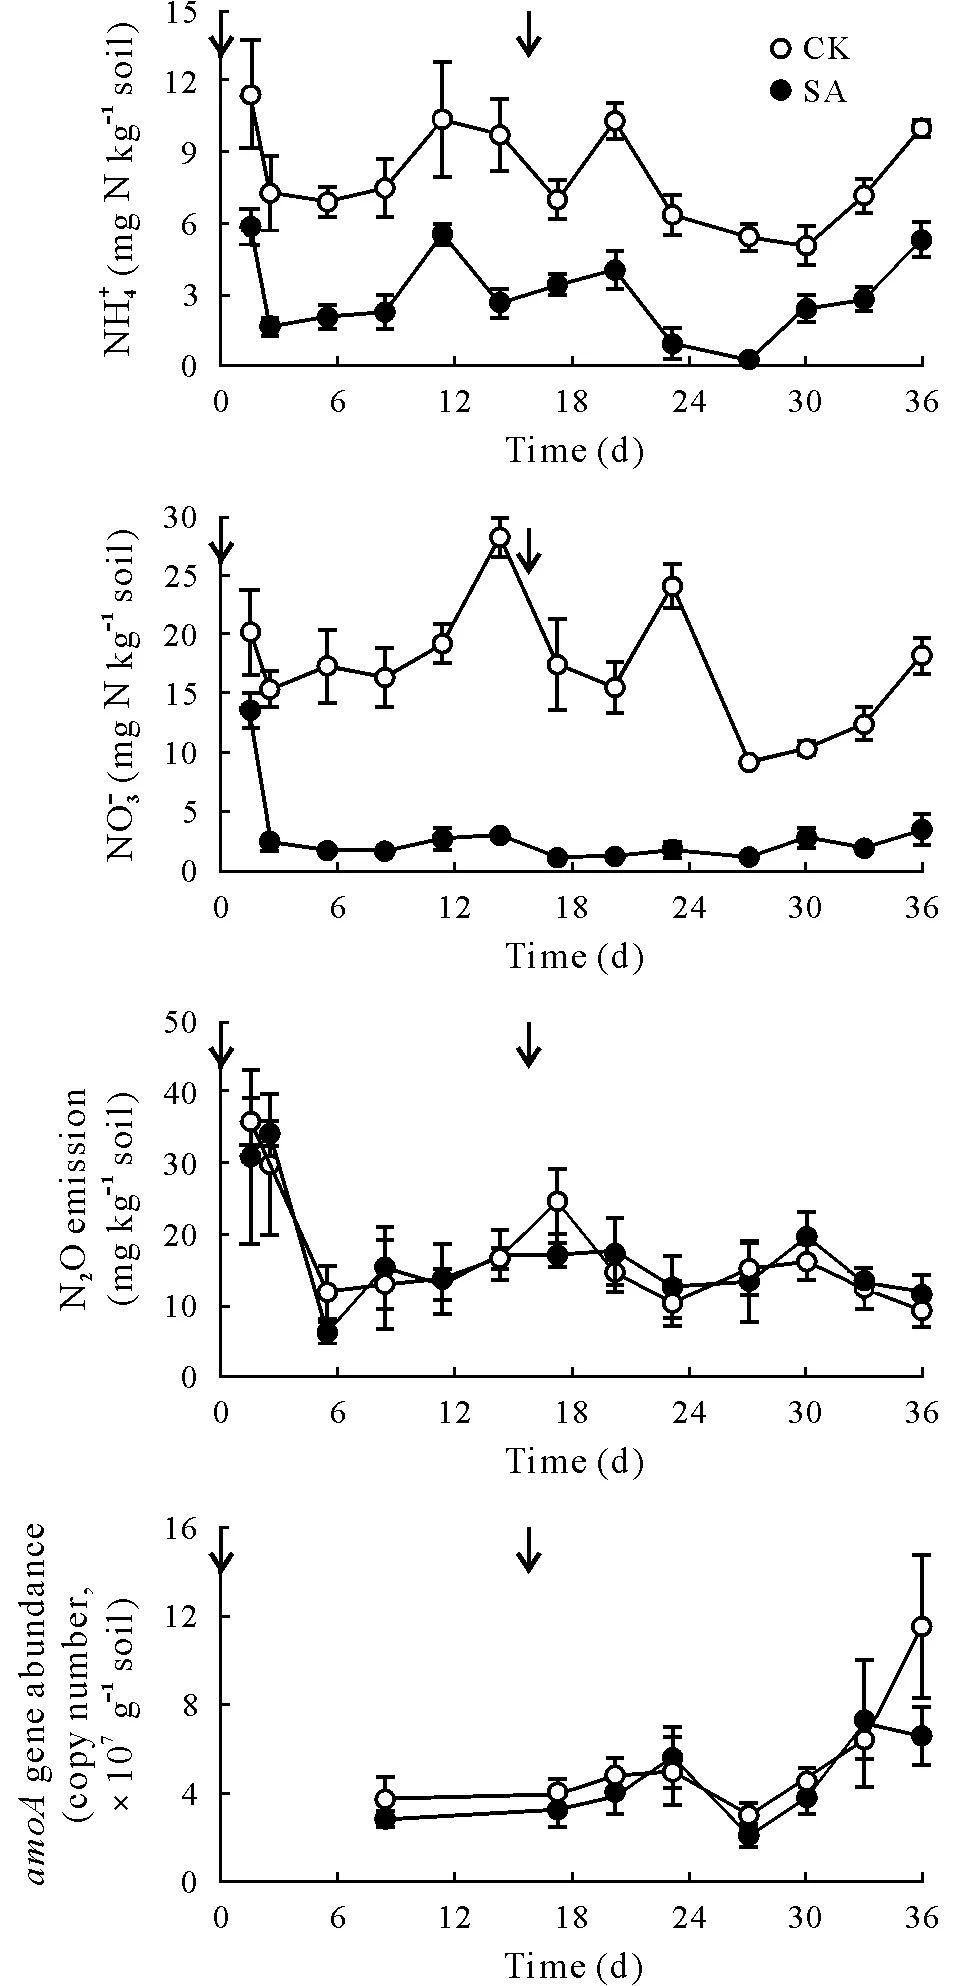
Soil NH+4and NO-3concentrations varied with time and were higher in CK than in SA with no interaction between factors(Fig.2,Table SI,see Supplementary Material for Table SI). Soil NO-3concentration decreased rapidly after the initial application of sucrose and remained low throughout the remainder of the 36-d experiment, even though C availability had fallen substantially by 15 d(Fig.1).Along with this reduction in soil NO-3concentration in response to C addition, there was also a trend indicative of reduced N2O emission (Fig. 2), although the observed differences were not statistically significant(Table SI).We should not discount the possibility that C addition resulted in enhanced complete denitrification to N2;however,consistent with the absence of a statistically significant effect on N2O emission,we detected no significant treatment effect on AOB abundance associated with nitrification(Table SI).

Fig.2 Soil mineral N(NH+4 and NO-3 )concentrations and bacterial amoA gene abundance and N2O emission in the field plots under irrigated lucerne with two treatments,sucrose addition at 3 Mg ha-1 (equivalent to 1.27 Mg C ha-1)(SA)and a no-sucrose control in which the same amount of water was applied instead (CK). The arrows indicate the time points at which sucrose or water was added.Values are means±standard errors(n=4).
In summary,applying sucrose as a readily available C substrate increasedCc,Ic,andRssignificantly and decreased N2O emission,though not significantly.We believe that no significant reduction in N2O emission may be attributed to the lack of anaerobic conditions in the well-drained soil constraining denitrification and N2O production(Cameronet al.,2013),despite the large reductions in soil NH+4andconcentrations in response to sucrose application throughout the experiment.We assume that the reduction in soilcould be ascribed to increased microbial biomass associated with increasingRsand enhanced N immobilisation with sucrose application,consistent with the findings of previous studies(Chaveset al.,2008;Shepherdet al.,2010;Talbotet al.,2019).Although N2O emission decreased significantly with increased C availability,the lack of difference between the treatments in AOB abundance confirmed that the effect of C availability on N transformation was attributable to N immobilisation rather than to microbial nitrification.In conclusion, we provided evidence in support of a direct link between increased C availability and N immobilisation,which we believe to be an important mechanism for reducing mineral N concentrations and N leaching from soil.However,the regulation of AOB activity and N2O emission under field conditions in this study was attributable to environmental drivers other than C availability.
ACKNOWLEDGEMENTS
Adriano Nascente’s visit to New Zealand was funded by the New Zealand Government through the Global Research Alliance Livestock Emissions and Abatement Research Network(LEARN)Awards Programme.Support for the New Zealand collaborators was funded by the New Zealand Agricultural Greenhouse Gas Research Centre and the Ministry for Business,Innovation and Employment Endeavour,New Zealand(contract number C09X1610)to Manaaki Whenua- Landcare Research, New Zealand. Adriano Nascente is grateful to the Brazilian Agriculture Research Corporation(Embrapa)for allowing him to undertake this exchange.We acknowledge the farm mangers at Ashley Dene Research&Development Station,New Zealand for permitting the use of the experimental field site.We thank Carina Davis for her expert extraction of DNA from soil samples.
SUPPLEMENTARY MATERIAL
Supplementary material for this article can be found in the online version.
杂志排行
Pedosphere的其它文章
- Letter to the Editor Molecular characterization of an extensively drug-resistant Acinetobacter baumannii isolated from a corn culture soil
- Distribution characteristics and diversities of cbb and coxL genes in paddy soil profiles from southern China
- Assessment of compost and three biochars associated with Ailanthus altissima(Miller)Swingle for lead and arsenic stabilization in a post-mining Technosol
- Synthesis of an eco-friendly nanocomposite fertilizer for common bean based on carbon nanoparticles from agricultural waste biochar
- Short-term microbial responses to soluble inorganic P input in a tropical lowland rain forest in Amazonia
- Impacts of silver nanoparticles on enzymatic activities,nitrifying bacteria,and nitrogen transformation in soil amended with ammonium and nitrate
