Reclamation of oil-induced soil hydrophobicity in the hyper-arid Evrona Nature Reserve,southern Israel
2021-12-22ZhengLIZeevRONENFainaGELMANOnnCROUVIGilboaARYEandRavidROSENZWEIG
Zheng LIZeev RONENFaina GELMANOnn CROUVIGilboa ARYE and Ravid ROSENZWEIG
1Zuckerberg Institute for Water Research,Jacob Blaustein Institutes for Desert Research,Ben-Gurion University of the Negev,Sede Boqer Campus 8499000(Israel)
2Geological Survey of Israel,32 Yeshayahu Leibowitz St.,Jerusalem 9692100(Israel)
3French Associates Institute for Agriculture and Biotechnology of Drylands Blaustein Institutes for Desert Research,Ben-Gurion University of the Negev,Sede Boqer Campus 8499000(Israel)
(Received October 3,2019;revised February 17,2020)
ABSTRACT Two oil spills occurred in the Evrona Nature Reserve (southern Israel), in 1975 and 2014. This oil contamination induced highly persistent soil hydrophobicity.The objective of this study was to investigate the decrease in oil-induced soil hydrophobicity under different environmental conditions and to assess the relationship between the hydrophobicity and hydrocarbon content.A laboratory incubation experiment was conducted over 1.5 years to monitor the soil hydrophobicity and total hydrocarbon concentration under different environmental conditions.We hypothesized that the addition of water(20%or 50%saturation),nutrients,and biosurfactants can accelerate the reduction in hydrophobicity and decomposition of hydrocarbons.Water drop penetration time and molarity of ethanol droplet tests were used to assess soil hydrophobicity.In parallel,alkane composition and total petroleum hydrocarbons were evaluated to indicate oil attenuation. The addition of water, nutrients, and biosurfactants resulted in a concomitant reduction in hydrophobicity and hydrocarbon concentration of varying degrees,exhibiting enhanced degradation and hydrophobicity reduction observed in treatments to which nutrients and biosurfactants were added.At the end of the incubation,however,soil hydrophobicity in all treatments remained severe,even though total petroleum hydrocarbon removal was fairly high and reached 40%—80%in the treatments to which water with or without nutrients and/or surfactants was added.
Key Words: biodegradation,biosurfactant,hydrocarbons,oil spill,soil water repellency,water drop penetration time
INTRODUCTION
Oil spills have received considerable attention in recent years since they can result in a severe damage to ecosystems which can last for decades.Terrestrial oil spills often induce soil hydrophobicity,which can adversely affect the ecological and physical functions of soil (Liet al., 1997; Roy and McGill, 1998; Adamset al., 2008; Takawiraet al., 2014;Lourençoet al.,2015;Marín-Garcíaet al.,2016;Gordonet al., 2018; Hewelkeet al., 2018). Soils become water repellent due to the coating of soil particles with hydrophobic molecules(Adamset al.,2008).It has been shown that oilinduced soil hydrophobicity can persist for decades after the pollution event (Roy and McGill, 1998; Doerr and Ritsema,2006).Several studies have shown that even soils with low hydrocarbon concentrations and no apparent signs of contamination,such as odor or smell,may exhibit severe hydrophobicity (Liet al., 1997; Roy and McGill, 1998;Adamset al.,2008).
Sandy soils exhibit more severe water repellency than clayey soils,due to the significantly lower specific surface area of sand (Doerret al., 2000). Further, the severity of water repellency was positively and linearly correlated with the total petroleum hydrocarbon (TPH) concentration of the soil(Adamset al.,2008),specifically it was related to polar compounds in the petroleum,which bridge the natural organic matter in the soil with the nonpolar hydrocarbons(Litvinaet al.,2003).
Several mitigation strategies have been suggested to alleviate oil-induced soil hydrophobicity. These include extraction with various solvents(Roy and McGill,1998;Royet al.,1999;Litvinaet al.,2003)and alkaline desorption(Roy and McGill,2000;Adamset al.,2016).These treatments,however,entail relatively high costs,and therefore,are not suited for large areas. Another approach to alleviate oilinduced hydrophobicity is through TPH mass reduction,which can be stimulated by humid conditions and addition of nutrients(Takawiraet al.,2014).
Biodegradation is one of the most important natural attenuation processes allowing the removal of contaminants and remediation of soil water repellency(Müller and Deurer, 2011). Roper (2006) reported that inoculation of wax-degrading bacteria in sandy soils can significantly reduce the water repellency caused by organic matter.Field studies at a crude-oil spill site in India indicated that up to 75%of the hydrocarbons can be biodegraded within a year if proper geochemical and microbial consortia exist(Gogoiet al.,2003).Moreover,it has been proposed that the alkane degradation rate is linearly correlated with the population of alkane-degraders in oil-contaminated soils incubated in the laboratory(Wuet al.,2017).
Moisture and nutrient availability are among the most critical factors limiting oil biodegradation (Skoppet al.,1990;Braddocket al.,1997),especially in arid soils.Supplemental nutrients were found to be necessary to accelerate biodegradation (Hesnawi and Adbeib, 2013). In contrast,Townsendet al. (2000) reported that addition of inorganic nutrients to crude oil did not significantly increase the populations of oil-degraders in a coastal wetland. Under dry conditions,the soil water content limits microbial activity. However, if too much water is applied and the soil gets saturated,oxygen-limiting conditions may evolve due to rapid aerobic respiration, which can inhibit microbial activity(Bahmaniet al.,2018).For instance,in a study of oil-contaminated soil from Shaanxi Province,China,addition of nutrients and water to 20%soil moisture was found to promote the population of hydrocarbon-degrading bacteria(Wuet al.,2017).
In the present study,we investigated the oil-induced soil hydrophobicity in the Evrona Nature Reserve in southern Israel. This reserve has experienced two oil spills in July 1975 and December 2014(Gordonet al.,2018;Stavi and Rosenzweig,2020).The two contaminated areas are situated close by,separated by only a few hundred meters(Notherset al.,2017).Although more than 40 years have passed since the first oil spill,the contaminated soils remain remarkably hydrophobic(Gordonet al.,2018).Moreover,it has been shown that the density of young trees at the polluted site is lower than in the neighboring non-polluted areas(Notherset al.,2017),and that oil contamination inhibits seed germination and seedling growth in the contaminated soils(Tranet al.,2018).
To the best of our knowledge,previous studies related to oil-induced soil hydrophobicity have only been conducted in cold-temperate climate,e.g.,Alberta in Canada(Roy and McGill,1998,2000; Royet al.,1999),humid continental climate,e.g., Bavaria in Germany (Buczkoet al., 2006)and Poland(Hewelkeet al.,2018;Hewelke and Gozdowski,2020),warm summer continental climate,e.g.,Minnesota in the USA(Adamset al.,2016)and humid tropical environments,e.g.,Mexico(Adamset al.,2008;Marín-Garcíaet al., 2016) and Zimbabwe (Takawiraet al., 2014). The oil spill in Evrona is the only example of oil-induced soil hydrophobicity under hyper-arid conditions(Gordonet al.,2018; Stavi and Rosenzweig,2020).Gordonet al.(2018)reported the persistence ofin-situsoil hydrophobicity over 42 years, as indicated by the high water drop penetration time(WDPT)and contact angle at the 1975 pollution site,which were equivalent to or even higher than those at the 2014 site.
The objective of our study was to examine the permanence and reduction of soil hydrophobicity under different environmental conditions(different soil moistures,with and without the addition of nutrients and biosurfactant)in both the 2014 and 1975 contaminated soils.A second objective was to investigate the relation between soil hydrocarbon content and the severity of soil hydrophobicity in the polluted soils of the Evrona reserve.This research is unique because it provides a rare opportunity to study soil hydrophobicity in a hyper-arid environment,where the soil has experienced two spill events and has been exposed to oil for over 42 years.
MATERIALS AND METHODS
Soil sampling and batch incubations
Oil-contaminated soils were collected from the 1975 and 2014 spill sites in the Evrona Nature Reserve in late May 2017(Fig.1).These sites are characterized by a hyper-arid climate,with mean annual rainfall of 30 mm,annual potential evaporation of 2 600 mm, and daily mean temperature of 25°C (Gordonet al., 2018). The soil from the 1975 site was classified based on the United States Department of Agriculture soil texture classification (Soil Survey Staff,1993)as loamy fine sand,with 81%±2.9%sand,15.4%±3.3%silt,and 3.7%±1.3%clay(Gordonet al.,2018).The soil from the 2014 site was of sandy loam texture,consisting of 64.4%±6%sand,26%±1.7%silt,and 9.4%±2.8%clay.In a survey conducted in 2016,the TPH concentrations at the 2014 and 1975 sites were reported as 27 790±15 720 and 7 768±3 655 mg kg-1, respectively (LDD, 2016).Unfortunately,the TPH concentration at the 1975 site at the time of the spill is not known.
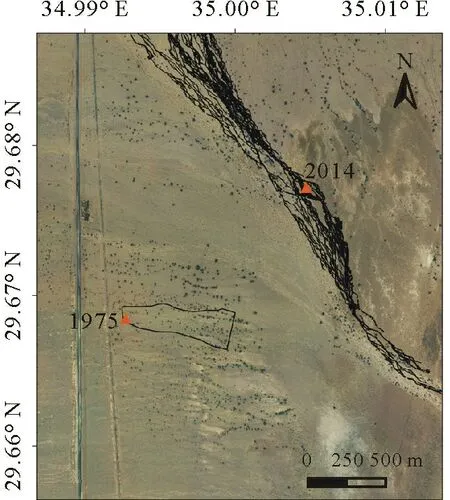
Fig.1 Map showing the two soil sampling points(triangles)at the 1975 and 2014 oil spill sites in the hyper-arid Evrona Nature Reserve,southern Israel.The black lines indicate the streams contaminated during the 2014 oil spill event and the area contaminated during the 1975 oil spill event.
Soil batches (about 2 kg each) were incubated under different conditions to assess the permanence of soil hydrophobicity and the attenuation of hydrocarbons.We tested two water saturations (20% and 50%), to determine the hydration conditions under which natural attenuation is optimized.In several studies,it has been postulated that microbial activity is optimized at a saturation of about 50%(Skoppet al.,1990).However,it would be desirable if equivalent or higher activity can be obtained under lower saturation,as it will reduce the amount of water required,and consequently the interference with the hyper-arid ecological system of the nature reserve. We also tested the addition of nutrients to determine if they could stimulate biodegradation.Finally,the addition of surfactants was tested to investigate if they could enhance biodegradation by increasing the bioavailability of hydrocarbons.
Seven treatments were set up for the 2014 contaminated soil: 20% water saturation (14W20), 20% water saturation with the addition of nutrients(14W20Nut),20%water saturation with the addition of surfactants (14W20Surf),20% water saturation with the addition of both nutrients and surfactants(14W20NutSurf),and 50%water saturation(14W50).Untreated contaminated soil from the 2014 site was used as a control(14control),and clean soil from the same site was used for comparison(14clean).For the 1975 contaminated soil,three treatments were set up:20%water saturation(75W20),20%water saturation with the addition of nutrients(75W20Nut),and untreated contaminated soil as a control(75control).
Water saturation was calculated based on field measurements of a bulk density of 1.5 g cm-3,corresponding to a calculated porosity of 43%.The nutrient solution consisted of 3 g L-1ammonium sulfate and 150 mg L-1potassium phosphate dissolved in tap water(deionized water was not used to avoid soil dispersion). Rhamnolipids (Agaetech,USA)at 200 mg L-1were used to test the effect of surfactants on oil degradation and hydrophobicity reclamation.Rhamnolipids were chosen because they are used as model biosurfactants and have extensively been investigated in the context of bioremediation(Mulligan,2005).Incubated soils were stored in sealed containers at room temperature (25°C),and were mixed every two days to aerate the soil and homogenize the samples.Water contents were kept constant by weekly weighing the samples and adding deionized water to compensate for evaporative loss.Soil batches were periodically sampled to measure the level of hydrophobicity and hydrocarbon content.
Hydrophobicity characterization
Thirty grams of soil samples were oven-dried at 65°C for 2 d, left in the open air for 1 d, and sieved to 2 mm before measurements. The soil was placed in a petri dish to generate a smooth soil surface (Takawiraet al., 2014).The degree of soil hydrophobicity was evaluated by the WDPT (Letey, 1969) and the molarity of ethanol droplet(MED)(Watson and Letey,1970;King,1981;Dekker and Ritsema,1994)techniques.In the WDPT method,the degree of hydrophobicity is assessed by measuring the time required for a 50-μL droplet of water to penetrate the soil surface.If the WDPT value was higher than 3 600 s,a value of 4 000 s was arbitrarily assigned.Measurements were conducted in triplicates.In the MED test,the hydrophobicity is assessed by pipetting a 50-μL droplet of aqueous ethanol solution and determining the lowest volume percentage of ethanol at which the solution penetrates the soil surface within 5 s.A series of aqueous ethanol solutions, ranging from 15%to 75%with a gradient of 2.5%,were tested to determine the lowest concentration of ethanol solution that penetrated the soil within 5 s.Thus,the determination of the MED value required multiple trials for each sample. To make testing feasible, no replicates were set up for this test. The MED value,in terms of the molarity(mol L-1)of the solution,was calculated based on the molecular weight of ethanol(46 g mol-1)and the specific gravity of the ethanol-water mixture at 25°C(Perry and Green,1985).Values between 1.2 and 2.2 mol L-1indicate moderately severe water repellency,values between 2.2 and 3 mol L-1indicate severe water repellency, whereas those above 3 mol L-1indicate very severe water repellency(King,1981).
Hydrocarbon extraction and analysis
Ten grams of soil samples were oven-dried at 65°C for 2 d.Then,5 g of the dried soil were placed into 40-mL Environmental Protection Agency(EPA)glass vials and mixed with 1 g of anhydrous Na2SO4, followed by the addition of 15 mL of dichloromethane (BioLab, Israel). The vials were sonicated in an ultrasonic bath at room temperature for 10 min,and the extract was filtered.Aliquots of 1 mL of the extract were analyzed by a gas chromatography-mass spectrometry(GC-MS)system(6890 N-5975,Agilent,USA)equipped with a Rxi-5HT capillary column(length 30 m,inner diameter 0.25 mm,film thickness 0.25 μm)(Restek,USA). The GC oven was heated from 50 to 300°C, at a rate of 10°C min-1,and maintained at this temperature for 10 min.Helium was used as a carrier gas,and the injector was maintained at 280°C.The GC-MS was operated in a selective ion monitoring(SIM)mode,monitoring mass-tocharge ratio(m/z)=85 and 191.Identification of individualn-alkanes was conducted according to the retention time of the standards(nC10—40)(Sigma-Aldrich,Germany),and indicative ratios were calculated based on the peak area.Analyses of TPHs(diesel and oil range organics)were performed in a certified laboratory(Aminolab,Israel),according to the standard EPA Method 8015(EPA,1999).
Statistical analysis
Statistical analyses were performed using Prism 7(GraphPad, USA). Statistically significant differences in WDPT and TPH concentration between the different treatments at the end of the incubation were determined using one-way analysis of variance(ANOVA).If theFvalue from the one-way ANOVA was significant(P <0.05),the difference between the means of the WDPT or TPH concentration between different treatments was compared usingttest.
RESULTS AND DISCUSSION
Soil hydrophobicity
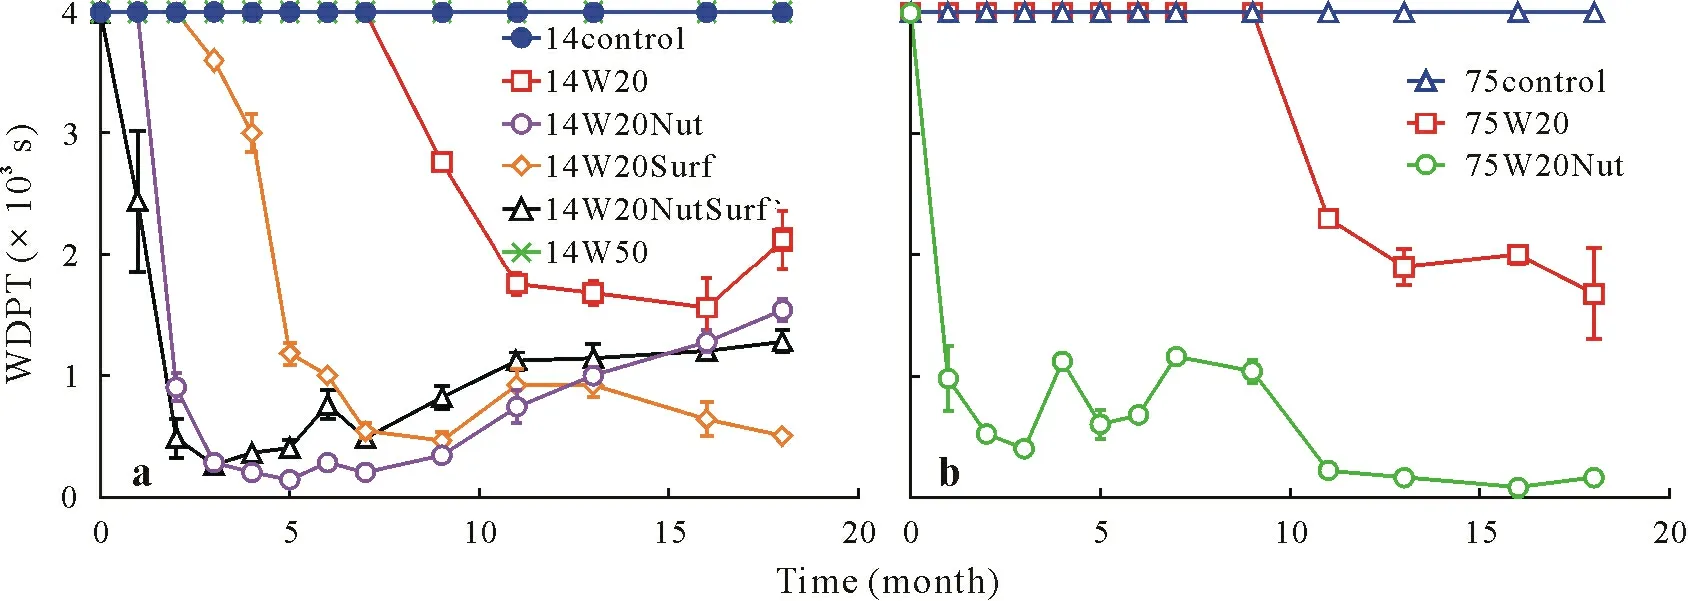
Fig.2 Water drop penetration time(WDPT)changes during the incubation experiment for the different treatments of the soils collected from the 2014(a)and 1975(b)oil spill sites in the hyper-arid Evrona Nature Reserve,southern Israel.Error bars are standard deviations(n=3).For the 2014 contaminated soil:14control=no addition of nutrients or surfactants;14W20=20%water saturation;14W20Nut=20%water saturation with the addition of nutrients;14W20Surf = 20% water saturation with the addition of surfactants; 14W20NutSurf = 20% water saturation with the addition of both nutrients and surfactants;14W50=50%water saturation.For the 1975 contaminated soil:75control=no addition of nutrients or surfactants;75W20=20%water saturation;75W20Nut=20%water saturation with the addition of nutrients.
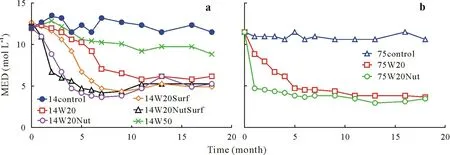
Fig.3 Molarity of ethanol droplet(MED)changes during the incubation experiment for the different treatments of the soils collected from the 2014(a)and 1975(b)oil spill sites in the hyper-arid Evrona Nature Reserve,southern Israel.For the 2014 contaminated soil:14control=no addition of nutrients or surfactants;14W20=20%water saturation;14W20Nut=20%water saturation with the addition of nutrients;14W20Surf=20%water saturation with the addition of surfactants;14W20NutSurf=20%water saturation with the addition of both nutrients and surfactants;14W50=50%water saturation.For the 1975 contaminated soil:75control=no addition of nutrients or surfactants;75W20=20%water saturation;75W20Nut=20%water saturation with the addition of nutrients.
The evolution of soil hydrophobicity over time was quantified by the WDPT and MED methods (Figs. 2 and 3, respectively). The clean reference soil was found to be completely wettable (WDPT = 0 s, MED = 0 mol L-1;data not presented), whereas the control soil was found to be extremely non-wettable. The addition of nutrients and biosurfactants accelerated the rate of WDPT decrease(Fig.2).The fastest decrease in hydrophobicity occurred in 75W20Nut,where the WDPT decreased from the maximal value of 4 000 to 980 s after only 1 month,exhibiting a 77%decrease.The 14W20NutSurf treatment exhibited the second most rapid rate,where the WDPT decreased from 4 000 to 2 440 s after 1 month, and then to 480 s after 2 months,showing an 88% reduction. There was a small lag in the reduction of the WDPT in 14W20Nut,decreasing by 77.5%after 2 months. The WDPT of the 14W20Surf treatment exhibited a decrease only after 3 months,converging to the values of the former two treatments after about 8 months.The 14W20 and 75W20 treatments exhibited prolonged lag times of 9 and 12 months,respectively,before the WDPT decreased significantly. This suggests that the addition of water alone can induce hydrophobicity reduction,provided a sufficient incubation time. The controls (14control and 75control) and 50% water saturation treatment (14W50)did not show any change in their WDPT during the 1.5-year incubation period, and were classified as extremely non-wettable soils, according to the soil water repellency classification proposed by Dekker and Jungerius (1990).Although all treatments to which nutrients and/or surfactants were added(14W20NutSurf,14W20Nut,14W20Surf,and 75W20Nut) and the 20% water saturation treatments(75W20 and 14W20)showed a substantial decrease in their WDPT,they were still classified as strongly non-wettable(14W20Surf and 75W20Nut) and severely non-wettable(75W20, 14W20, 14W20Nut, and 14W20NutSurf) at the end of the experiment,suggesting that further reduction of hydrophobicity is required to alleviate its negative effects.
Although the treatments were found to be significantly different at the end of the experiment,as indicated by one-way ANOVA(P <0.000 1)andttest(P <0.05)between each two treatments,the differences between the four treatments(14W20,14W20Surf,14W20Nut,and 14W20NutSurf)narrowed down during the experiment. The flattening of the WDPT curves and the increase in hydrophobicity measured in some of the treatments suggest that further reduction in hydrophobicity is inhibited by either a physical,chemical,or biological mechanism.Such possible mechanisms will be discussed later.
The results of the MED measurements presented similar trends to those of the WDPT test;all treatments exhibited a significant decrease in MED after a 1.5-year incubation period, except for the control and 50% water saturation treatments(Fig.3).The rate of decrease in hydrophobicity differed between the treatments. For the 2014 soil, after the first 3 months of incubation, the fastest decrease in MED(53%)was observed in 14W20NutSurf,followed by 14W20Nut(44%)and 14W20Surf(16%).The second-lowest rate was observed in 14W20,showing only a 4%decrease in MED value.In contrast to the WDPT test,the results of the MED test showed a small reduction in the hydrophobicity also in the 2014 soil with 50% water saturation. For the treatments of the 1975 soil,the MED exhibited the fastest decrease in 75W20Nut,exhibiting a 62%reduction,while a 42%reduction was recorded in MED value after 3 months in 75W20.Although some treatments exhibited a significant decrease in their MED values,at the end of the incubation period,the soil water repellency in all treatments was still classified as very severe(MED >3 mol L-1).
The attenuation of the degree of hydrophobicity in the soil with 20% water saturation from both the 2014 and 1975 sites commenced earlier in the MED test than in the WDPT test.Towards the end of the incubation period,the differences in the MED values between the treatments for the 2014 soil(excluding 14control and 14W50)became progressively smaller,reaching a difference of only 18%between the highest and lowest MED values(compared with 145%,after 5 months of incubation).This was consistent with the WDPT test,indicating that addition of nutrients or biosurfactants accelerated the rate of decrease in hydrophobicity, while affecting the MED values at the end of incubation to a lesser extent.
It was evident from the results that the addition of water, nutrients, or surfactants induced a reduction in the hydrophobicity in the first few months of incubation when compared with the control.This effect could be attributed to the enhancement of biodegradation(as will be shown in later sections),leading to the oxidation of hydrocarbons(Atlas,1981; Leahy and Colwell, 1990). Oxidation of aliphatic hydrocarbons results in the formation of fatty acids which are less hydrophobic(Sangster,1989;Abbasianet al.,2015).Rhamnolipids, the biosurfactant used in this experiment,were found to stimulate the biodegradation of alkanes(Zhang and Miller,1992)and decrease the hydrophobicity of alkanedegrading cells(Zhang and Miller,1994),thus facilitating a direct physical contact with hydrophobic compounds and enhancing the biodegradation of hydrocarbons (Zhaoet al., 2011). This biosurfactant can also decrease surface tension and emulsify oil, thus increasing the solubility of hydrophobic materials and further improving the ability of bacteria to degrade hydrocarbons(Dézielet al.,1996).
Interestingly,in some of the treatments,an increase in WDPT was recorded after the first few months of decline.This increase in hydrophobicity was also recorded in the MED test,which strengthened our hypothesis that it was not a measurement artifact,but a consequence of a change in the chemical composition of the soil towards a more hydrophobic one. Accumulation of microbial biomass containing hydrophobic components could be one of the possible reasons for this observation(Lozanoet al.,2014).In Lozanoet al.(2014),WDPT was found to be positively correlated with the concentration of phospholipid fatty acid biomarkers and the number of actinobacteria.As actinobacteria were found to be a dominant phylum in the polluted soils of Evrona at both the 1975 and 2014 oil spill sites(Girsowiczet al.,2018),this could possibly explain the increase in hydrophobicity at the end of the incubation period.Another possible explanation could be the production of polar compounds during the course of degradation,which link between the soil and nonpolar hydrocarbons,and thereby promote hydrophobicity(Litvinaet al.,2003).However,further research should be conducted to verify these hypotheses.
As illustrated in Fig.4,MED was positively related to WDPT after the WDPT began to decrease.The fitted linear relations exhibit a good fit for two of the six treatments(14W20,R2=0.79;14W20Surf,R2=0.97).The results for the 2014 treatments are in line with the findings of Takawiraet al.(2014),who reported a positive correlation,albeit of a power function, between the average WDPT and MED values of soils from two oil-contaminated sites in Zimbabwe. Interestingly, the slopes of the relation for the 2014 and 1975 treatments exhibit the same range of values. The MED values show a sharper reduction with WDPT for treatments with the addition of surfactants or nutrients when compared with the addition of water alone.When comparing the influence of the addition of water in the 2014 and 1975 soils for the same WDPT value,the MED value of the 2014 soil is larger than that of the 1975 soil. The data indicate that while both WDPT and MED quantify hydrophobicity and are positively correlated,a unique, universal relation between the two measures is not available for oil-induced soil hydrophobicity.This is in agreement with the results of Doerr (1998), who found a high correlation between the two measures,but no consistent relation.
Evaluation of hydrocarbon content
Chromatograms of GC-MS analyses obtained for the hydrocarbons extracted from the contaminated soils are shown in Fig. 5. The chromatogram of the untreated contaminated 2014 soil from July 2017, before incubation, revealedn-alkanes ranging fromn-C14ton-C34,withn-C20as the main peak(Fig.5a).After 1 year of incubation,the control presented a slightly modified chromatogram,where C14and C15had disappeared and the main peak had shifted ton-C22(Fig. 5b). Figure 5c illustrates the changes after 1 year of incubation in the presence of nutrients(14W20Nut),showing the almost-complete removal of lower carbon(C)-numbered alkanes and the shift of the main peak ton-C32.The chromatogram of the untreated contaminated 1975 soil from July 2017 is typical of that of weathered oil,containing alkanes ranging fromn-C15ton-C34,with the main peak atn-C21(Fig.5d).As in the 2014 soil,after 1 year of incubation,the chromatogram of the 1975 control(Fig.5e)shifted slightly towards higher-molecular-weightn-alkanes,resembling that of weathered oil,without the C13—C18n-alkanes and only small pristane(Pr)and phytane(Ph)peaks.Incubation of this soil with nutrients substantially accelerated the biodegradation of oil,showing the complete removal of low-molecularweight alkanes and domination of high-molecular-weight alkanes,with the main peak atn-C31(Fig.5f),after 1 year of incubation.
The microbial degradation rate is commonly characterized by ratios of relative abundances of specific hydrocarbons such as Pr/n-C17and Ph/n-C18(Wang and Fingas, 2003), and the ratio between the relative abundances of low-molecular-weight alkanes (Σ(n-C14—n-C21)) and high-molecular-weight alkanes (Σ(n-C22—n-C34)) (L/H).In the early stages of biodegradation,the removal of more biodegradable alkanes occurs,with the conservation of more degradation-resistant isoprenoids(Pr and Ph),resulting in an increase in the Pr/n-C17and Ph/n-C18ratios(Barakatet al.,2002).However,in the later stages of biodegradation,Ph and Pr are also degraded, leading to a decrease in the Pr/n-C17and Ph/n-C18ratios(Frontera-Suauet al.,2002).
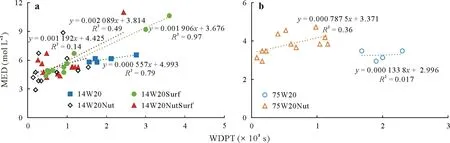
Fig.4 Correlations between the molarity of ethanol droplet(MED)and water drop penetration time(WDPT)during the incubation experiment for the different treatments of the soils collected from the 2014(a)and 1975(b)oil spill sites in the hyper-arid Evrona Nature Reserve,southern Israel.For the 2014 contaminated soil:14W20=20%water saturation;14W20Nut=20%water saturation with the addition of nutrients;14W20Surf=20%water saturation with the addition of surfactants;14W20NutSurf=20%water saturation with the addition of both nutrients and surfactants.For the 1975 contaminated soil:75W20=20%water saturation;75W20Nut=20%water saturation with the addition of nutrients.
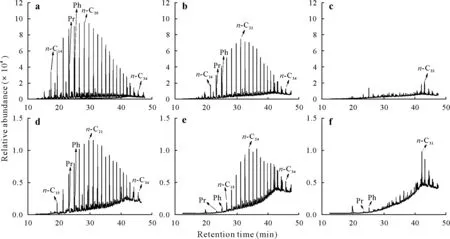
Fig.5 Gas chromatography-mass spectrometry(GC-MS)chromatograms of hydrocarbons extracted from the soils collected from the 2014(a—c)and 1975(d—f)oil spill sites in the hyper-arid Evrona Nature Reserve,southern Israel.Untreated(control)soils before(a and d)and after(b and e)one year of incubation and soils treated with water(20%water saturation)and nutrients for one year(c and f)are presented.Pr=pristane;Ph=phytane.
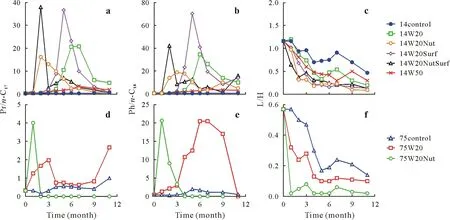
Fig.6 Changes in relative abundance ratios of pristane/n-C17(Pr/n-C17),phytane/n-C18(Ph/n-C18)and low-molecular-weight alkanes(Σ(n-C14—n-C21))to high-molecular-weight alkanes(Σ(n-C22—n-C34))(L/H)during incubation in the different treatments of the soils collected from the 2014(a—c)and 1975(d—f)oil spill sites in the hyper-arid Evrona Nature Reserve,southern Israel.For the 2014 contaminated soil:14control=no addition of nutrients or surfactants;14W20=20%water saturation;14W20Nut=20%water saturation with the addition of nutrients;14W20Surf=20%water saturation with the addition of surfactants;14W20NutSurf=20%water saturation with the addition of both nutrients and surfactants;14W50=50%water saturation.For the 1975 contaminated soil:75control=no addition of nutrients or surfactants;75W20=20%water saturation;75W20Nut=20%water saturation with the addition of nutrients.
The evolution of these ratios in the different treatments during the first year of incubation is presented in Fig.6.As in most of the treatments,Pr and Ph were completely degraded during the first year of incubation, results are not shown for the rest of the incubation period. Obviously, Pr/n-C17and Ph/n-C18remained almost constant in 14control and 75control,whereas these ratios changed significantly in the other treatments during incubation.Although during the first 6 months of incubation,degradation was more pronounced in the samples with the addition of nutrients and/or surfactants,during the next months of the experiment,significant degradation of hydrocarbons was also observed in the samples supplemented with water to 20%saturation.The change in alkanes in the different treatments was concomitant with the results of hydrophobicity described in earlier sections.The decrease in the L/H ratio of the control treatments reflects the degradation of the low-molecular-weight alkanes observed in the chromatograms (Fig. 5) and can be attributed, at least in part,to the intensive mixing and aeration performed throughout the incubation experiment.
Figure 7 illustrates the TPH concentration for all treatments during the entire incubation period. The reduction rate over the pseudo-linear portion of the TPH concentration curves and the percentage of TPH removal during the 1.5-year incubation period are shown in Table I. For the 2014 soil, the fastest decrease in TPH concentration occurred in 14W20NutSurf,followed by 14W20Surf and then by 14W20Nut.The 14W20 treatment exhibited the slowest rate of decrease;however,this can be misleading as sampling was not conducted often enough to get a reliable measure of the rate.The 14W50 treatment showed a lag time of 1 year,following which its TPH concentration reduced significantly,at a rate comparable to that of the other treatments.
For the 1975 contaminated soil, during the 1.5-year incubation period, the TPH concentration decreased by 82.6% with the addition of nutrients (75W20Nut) and by 41.7%when only water was added(75W20).In contrast to the significantly accelerated biodegradation of hydrocarbons in the treatments with addition of water, nutrients, and/or surfactants,only small decreases in TPH concentration were observed in 14control(17.6%)and 75control(7.7%).
Similar to the results of the WDPT and MED tests,at the end of incubation,the differences between the 2014 treatments in terms of TPH removal were rather small(differenceof 18%between the extreme values,P=0.48).Furthermore,the order of TPH removal among the treatments(14W20Surf>14W20NutSurf>14W20Nut>14W20%) correlated with the reduction in the MED and WDPT values at the end of the experiment.
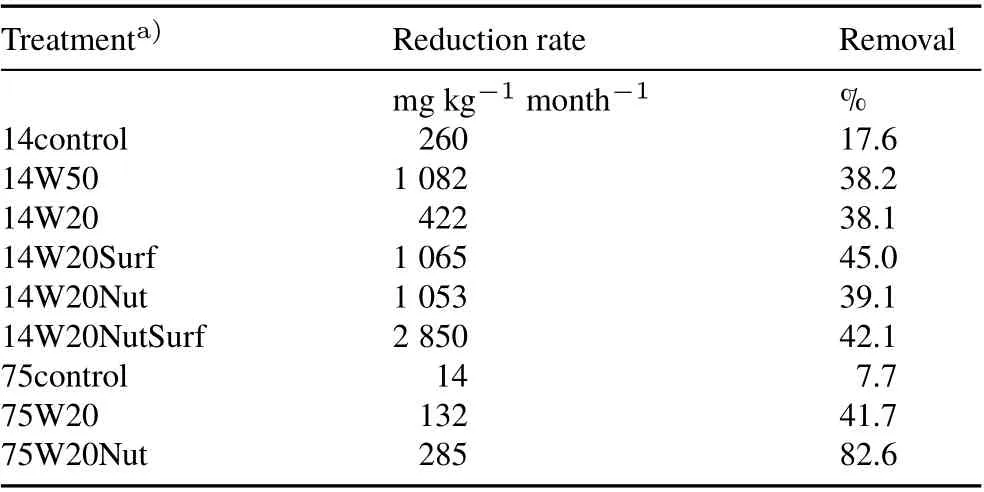
TABLE I Reduction rates of total petroleum hydrocarbon(TPH)concentration over the pseudo-linear portion of the TPH concentration curves(see Fig.7 for TPH concentration curves)and percentages of TPH concentration removal during the 1.5-year incubation in the different treatments of the soils collected from the 2014 and 1975 oil spill sites in the hyper-arid Evrona Nature Reserve,southern Israel
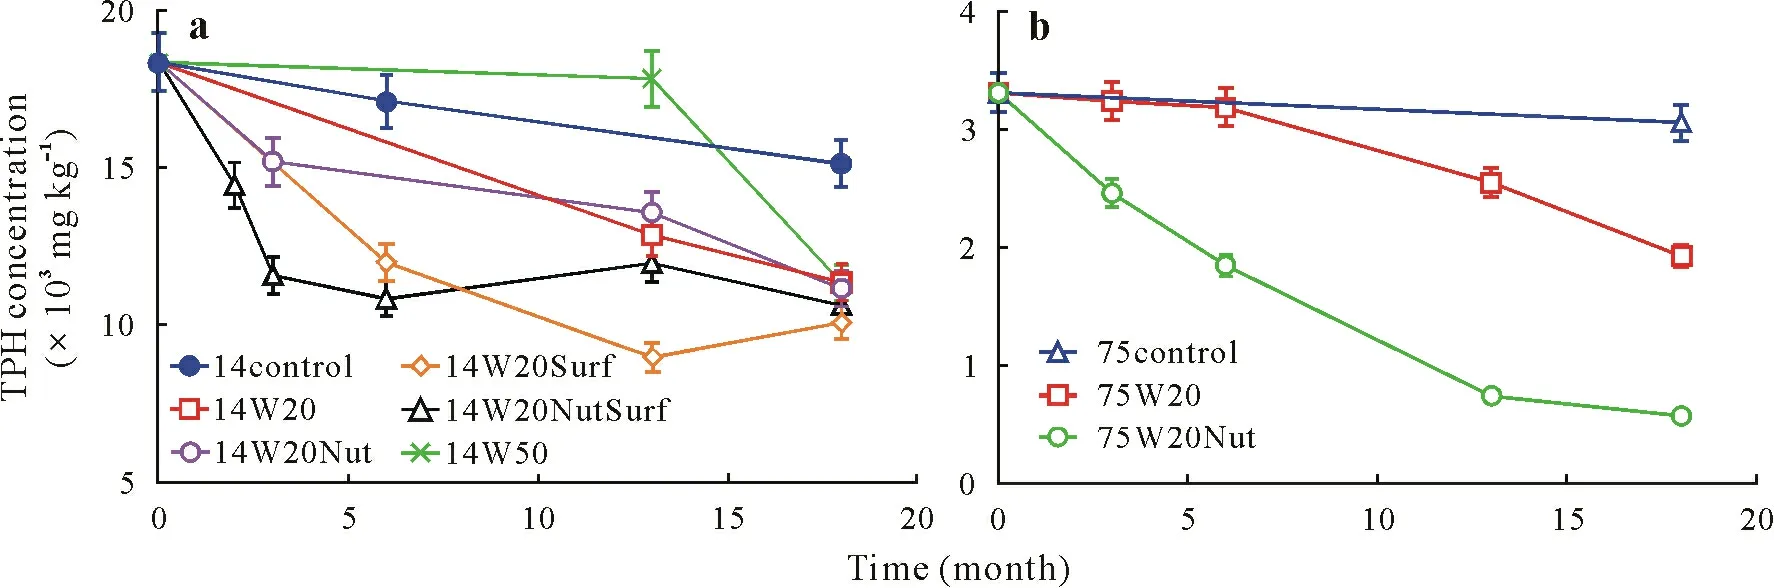
Fig.7 Changes in total petroleum hydrocarbon(TPH)concentration during incubation in the different treatments of the soils collected from the 2014(a)and 1975(b)oil spill sites in the hyper-arid Evrona Nature Reserve,southern Israel.Error bars are standard errors associated with the analytical method.For the 2014 contaminated soil:14control=no addition of nutrients or surfactants;14W20=20%water saturation;14W20Nut=20%water saturation with the addition of nutrients;14W20Surf=20%water saturation with the addition of surfactants;14W20NutSurf=20%water saturation with the addition of both nutrients and surfactants;14W50=50%water saturation.For the 1975 contaminated soil:75control=no addition of nutrients or surfactants;75W20=20%water saturation;75W20Nut=20%water saturation with the addition of nutrients.
Susceptibility to microbial degradation generally decreases in the following order:n-alkanes>branched alkanes>low-molecular-weight aromatics>cyclic alkanes(Leahy and Colwell, 1990). The biodegradation rate would slow down once the easily-degraded alkanes and low-molecularweight aromatics have been completely removed.Some of the high-molecular-weight polycyclic aromatic hydrocarbons(PAHs)may not be degraded at all(Atlas and Bragg,2009).Wrennet al. (2006) found that the nutrient demand for oil-spill bioremediation decreased as the oil biodegradation progressed.They suggested that after the easily degradablen-alkanes are almost completely depleted,nutrients no longer limit the biodegradation rate of less degradable organic compounds.Although aromatic fractions were not analyzed in the present study,it is reasonable to hypothesize that in our experiment,the addition of nutrients did not accelerate the biodegradation rate once the more resistant hydrocarbons had begun to degrade. Conversely, biosurfactant addition continuously increased the bioavailability of hydrocarbons to microorganisms.This may explain the observation that the TPH in 14W20NutSurf and 14W20Nut decreased rapidly during the first few months,but did not exhibit the highest TPH removal at the end of the incubation. This may also contribute to the lowest hydrophobicity in 14W20Surf at the end of the incubation,as indicated by both WDPT and MED tests.
In the high saturation treatment(14W50),the long lag time can be attributed to the development of anaerobic conditions(developed in spite of stirring the samples),which could have slowed the growth and activity of the microorganisms, compared to the other treatments in which water content was lower.We hypothesize that over this prolonged period of incubation,anaerobic microorganisms adapted to the high-saturation conditions and started to degrade the hydrocarbons.This is in accordance with the results of hydrophobicity,where the slowest and mildest hydrophobicity reduction was obtained in 14W50.
Altogether,even withca.40%reduction in TPH concentration for the 2014 treatments and with 41.7% and 82.6%reduction for 75W20 and 75W20Nut,respectively,the soils remained severely water repellent,demonstrating the permanence of hydrophobicity.
Figure 8 illustrates the relationship between TPH concentration and MED.A weak linear correlation was found for the 1975 soil, while a better, yet different correlation was obtained for the 2014 soil. This is in partial agreement with the results of a previous study conducted at a hydrocarbon-contaminated site in humid tropical climate,where an asymptotical relationship between TPH concentration and water repellency (MED),and a linear relation for low TPH concentration(<2 000 mg kg-1)was reported(Adamset al.,2008).As was shown in Gordonet al.(2018),Fig.8 shows that the contaminated soils from the two sites exhibit similar levels of hydrophobicity,although the TPH concentrations for the 1975 soil were three times lower than those for the 2014 soil.It is expected that the aging time of hydrocarbons,i.e.,the time that the contaminants have been in contact with the soil,highly decreases the bioavailability of PAHs, through sorption or diffusion into small pores(Hatzinger and Alexander, 1995). Therefore, it is highly possible that relatively stable aged hydrocarbons(e.g.,high molecular-weight PAHs)have a greater contribution to the hydrophobicity of the 1975 contaminated soil,compared to the un-weathered oil in the 2014 soil.
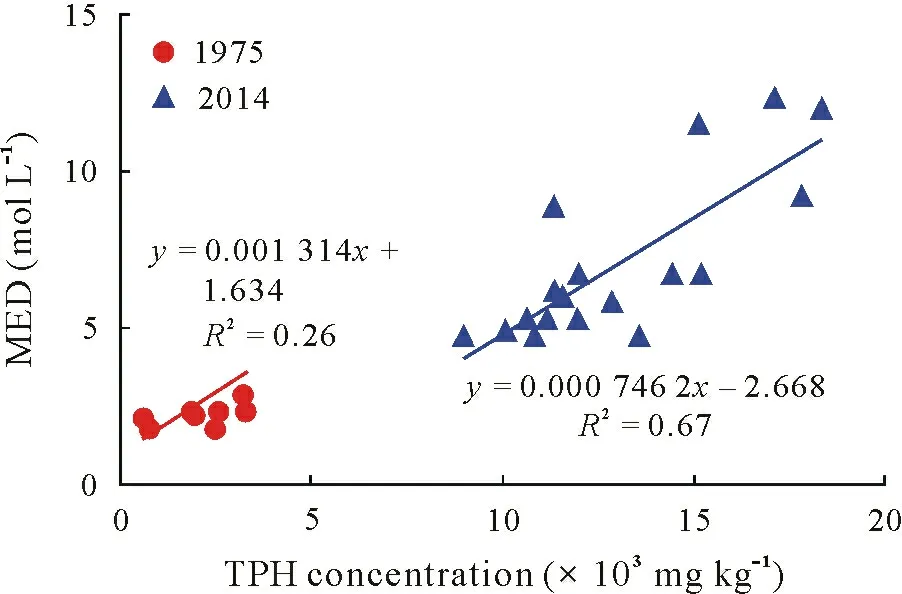
Fig.8 Relationship between the molarity of ethanol droplet(MED)and total petroleum hydrocarbon(TPH)concentration values from all treatments of the incubation experiment with soils collected from the 2014 and 1975 oil spill sites in the hyper-arid Evrona Nature Reserve,southern Israel.
The aging of organic compounds and probably the poorer composition of degradable hydrocarbons at the 1975 site might have also been the limiting factors for further biodegradation.In the 2014 soil,however,the composition of hydrocarbons is more degradable.Therefore,it is more likely that the cessation of biodegradation in these treatments was related to either the lack of micro nutrients or the accumulation of toxic byproducts that inhibited microbial activity.
CONCLUSIONS
This study investigated the decrease in oil-induced soil hydrophobicity under different environmental conditions and the relationships between the hydrophobicity and hydrocarbon content at two adjacent sites which experienced oil-spills in 1975 and 2014.In comparison to other sites in temperate and tropical climates(Adamset al.,2008;Takawiraet al.,2014),the hydrophobicity of the untreated soil was extremely high, even after 40 years of the 1975 spill event. Similar levels of severe soil hydrophobicity have been reported at the Bemidji site in the dry and cold Minnesota(Adamset al.,2016).This site was contaminated by oil in 1979 and was subsequently burnt to reduce the concentration of oil.While the high temperatures probably contributed to the severe and persistent hydrophobicity at our sites,at the Bemidji site the extreme hydrophobicity may be,at least in part,attributed to the post-spill burn.
The level of soil hydrophobicity was reduced in the treated soils from both the 2014 and 1975 sites after a 1.5-year incubation period.The addition of water,nutrients,and biosurfactants accelerated the rate of decrease in soil hydrophobicity.Water at 20%saturation was found to be more efficient in reducing soil hydrophobicity than that at 50%saturation.The rates of biodegradation of aliphatic alkanes and TPHs were in full agreement with those of the hydrophobicity reduction.Therefore,we conclude that addition of water(20%saturation),nutrients,and biosurfactants can stimulate the biodegradation of hydrocarbons and the remediation of hydrophobic soils. However, the hydrophobicity was still severe for all the treatments,even though TPH removal was fairly high(ca.40%removal for the 2014 soil and even 82%removal for the 1975 soil).In some of the treatments(e.g.,75W20Nut), subsequent remediation operations, such as mixing the soil with clay,may prove beneficial in reducing soil hydrophobicity to the slightly wettable category.We suggest that the size and composition of indigenous hydrocarbon degraders in the treated soils should be further studied to better understand the relationship between biodegradation of hydrocarbons and the reduction of hydrophobicity under different environmental conditions.The compositions and biodegradation of heavy oil residues should also be evaluated to explore the potential reasons for the present severe hydrophobicity demonstrated in all the treatments.
ACKNOWLEDGEMENTS
This work was funded by the Ministry of Environmental Protection of Israel.ZL acknowledges the financial support of the China Scholarship Council.
杂志排行
Pedosphere的其它文章
- Letter to the Editor Molecular characterization of an extensively drug-resistant Acinetobacter baumannii isolated from a corn culture soil
- Distribution characteristics and diversities of cbb and coxL genes in paddy soil profiles from southern China
- Assessment of compost and three biochars associated with Ailanthus altissima(Miller)Swingle for lead and arsenic stabilization in a post-mining Technosol
- Synthesis of an eco-friendly nanocomposite fertilizer for common bean based on carbon nanoparticles from agricultural waste biochar
- Letter to the Editor Soil carbon availability affects nitrogen transformation under irrigated lucerne
- Short-term microbial responses to soluble inorganic P input in a tropical lowland rain forest in Amazonia