Impacts of land use and salinization on soil inorganic and organic carbon in the middle-lower Yellow River Delta
2021-12-22YangGUOXiujunWANGXianglanLIMinggangXUYuanLIHaonanZHENGYongmingLUOandPeteSMITH
Yang GUOXiujun WANGXianglan LIMinggang XUYuan LIHaonan ZHENGYongming LUO and Pete SMITH
1College of Global Change and Earth System Science,Beijing Normal University,Beijing 100875(China)
2Institute of Agricultural Resources and Regional Planning,Chinese Academy of Agriculture Sciences,Beijing 100081(China)
3Key Laboratory of Coastal Zone Environmental Processes and Ecological Remediation,Yantai Institute of Coastal Zone Research,Chinese Academy of Sciences,Yantai 264003(China)
4Institute of Biological and Environmental Sciences,University of Aberdeen,Aberdeen AB24 3UU(UK)
(Received November 13,2019;revised December 17,2019)
ABSTRACT Soil inorganic carbon(SIC)is an important reservoir of carbon(C)in arid,semi-arid,and semi-humid regions.However,knowledge is incomplete on the dynamics of SIC and its relationship with soil organic C(SOC)under different land use types in the semi-humid region,particularly in coastal zones impacted by soil salinization.We collected 170 soil samples from 34 profiles across various land use types(maize-wheat,cotton,paddy,and reed)in the middle-lower Yellow River Delta(YRD),China.We measured soil pH,electrical conductivity(EC),water-soluble salts,and SOC and SIC contents.Our results showed significant differences in both SOC and SIC among land use types.The dry cropland(maize-wheat and cotton)soils had significantly higher SOC and SIC densities(4.71 and 15.46 kg C m-2,respectively)than the paddy soils(3.28 and 14.09 kg C m-2,respectively)in the 0—100 cm layer.Compared with paddy soils,reed soils contained significantly higher SOC(4.68 kg C m-2)and similar SIC(15.02 kg C m-2)densities.There was a significant positive correlation between SOC and SIC densities over a 0—100 cm soil depth in dry cropland soils,but a negative relationship in the paddy soils.On average,SOC and SIC densities under maize-wheat cropping were 15%and 4%lower,respectively,in the salt-affected soils in the middle-lower YRD than the upper YRD.This study indicated that land use types had great influences on both SOC and SIC and their relationship,and salinization had adverse effect on soil C storage in the YRD.
Key Words: C densities,C stocks,land use type,salt-affected soil,soil salinization
INTRODUCTION
Soil carbon(C),soil organic C(SOC)and inorganic C(SIC),plays a significant role in the global C cycle and climate change(Eswaranet al.,1993;Lal,2004).The global SOC pool was estimated to be 1 220—1 576 Pg in the 0—100 cm layer(Batjes,1996),which is about 2—3 times the C pool in the biosphere(Rosenzweig and Hillel,2000)and twice the C pool in the atmosphere(Schlesinger,1999).At present,SOC has received a lot of attention, while fewer studies have focused on SIC.Although limited studies indicate that the global SIC pool is also large (i.e., 695—1 738 Pg over 0—100 cm),there remains a large uncertainty in estimating the SIC pool(Eswaranet al.,2000).
A number of studies have shown that land use and management can have large impacts on SOC and SIC dynamics(Wuet al.,2003,2009;Mikhailova and Post,2006;Menget al.,2014).For instance,land cover with different vegetation types can significantly affect SOC content because of the large differences in the root systems and associated changes in microbial processes and soil chemical and physical properties (Zhaoet al., 2016; Hanet al., 2018; Jobbágy and Jackson,2000).Land management and agricultural practices(i.e.,cultivation,fertilization,and irrigation)have great influences on SIC storage(Wanget al.,2014;Bughioet al.,2016). A few studies have shown that both SOC and SIC stocks are much larger in croplands than in the non-cropland of Northwest China(Suet al.,2010;Wang J Pet al.,2015)and in the Kursk region of Russia (Mikhailova and Post,2006).
Limited studies have focused on the SIC-SOC relationship and showed inconsistent findings among different land uses.Some studies have shown that there is a negative SICSOC relationship in various ecosystems,including cropland(Zenget al.,2008),grassland,shrub land,and forest land(Zhaoet al.,2016)in the Northwest China.However,other studies suggest that SIC density is positively correlated with SOC density in cropland (Suet al., 2010; Bughioet al.,2016;Shiet al.,2017),forest(Gaoet al.,2017),and desert(Zhang Net al.,2010)in North China.Further investigation is necessary to elucidate the relationship of SIC with SOC across different land use types.
Over the past decade, most studies focusing on the influence of land use on SIC dynamics and their relationship have been conducted in the arid and semi-arid areas of China(Changet al., 2012; Tanet al., 2014; Wanget al., 2014;Zhanget al.,2015;Gaoet al.,2017).There are few recent studies on the variations of both SIC and SOC in the semihumid cropland of North China(Bughioet al.,2016;Guoet al.,2016;Shiet al.,2017).These limited studies demonstrate that SOC and SIC in the semi-humid cropland are influenced by fertilization management(Bughioet al.,2016),and SIC has a positive relationship with Ca2+and Mg2+levels(Guoet al.,2016).In addition,our previous analyses indicate that there are significant differences in SOC and SIC densities between salt-affected soils and those containing less salts(Guoet al.,2016;Shiet al.,2017),implying that salinization might also impact soil C dynamics under other land use types in the semi-humid region.
The Yellow River Delta(YRD)is characterized by various degrees of salinization with about 60%of land covered by salt-affected soils (Fanget al., 2005; Cuiet al., 2011;Liet al., 2014). Much of the land in the YRD has been exploited for use as cropland(i.e.,cotton and paddy)from natural wetland(Zhaoet al.,2018).Here,we hypothesize that land use types not only affect SOC and SIC densities but also their relationship in the YRD.The objectives of this study were to assess the impact of land use types on both SIC and SOC densities in salt-affected soils of semi-humid region and to evaluate the influences of salinization on SIC and SOC densities and stocks in the YRD.
MATERIALS AND METHODS
Study region
Our study area,covering the entire middle-lower YRD,is situated in the northeast of Shandong Province, China(Fig.1).The area has a typical temperate continental monsoon climate with four distinct seasons.Annual mean temperature is 11.7—12.6°C,and annual precipitation and evaporation are 530—630 mm and 1 900—2 400 mm,respectively.The land is flat, with low altitude (<25 m above sea level)in most parts(Yuet al.,2014).The soils are classified as Alluvic Primosols, Marinic Aqui-Orthic Halosols, and Ochri-Aquic Cambosols(Cooperative Research Group on Chinese Soil Taxonomy, 2001). The alluvial soils were mainly developed on redeposited loess carried by the Yellow River from the Loess Plateau.Soil texture is similar across the study area,which on average contains 6.69%±1.85%clay(<0.002 mm),33.3%±13.7%silt(0.002—0.02 mm),and 59.7%±13.3% sand (0.02—2 mm) (Liet al., 2016).The majority of land has been used for farming, and the rest is mainly wetland that is dominated bySuaeda(Suaeda salsa) and reed (Phragmites australis). The development of the cropping system is based on soil salinity,i.e., low salinity for wheat-maize and cotton and high salinity for paddy(Liet al.,2016).Thus,the main crop in the middlelower YRD is cotton and wheat-maize rotation,which has a rather longer cultivation history than paddy soils.For most of the paddies, farmers often use the freshwater from the Yellow River for salt-leaching in order to reduce soil salinity.Mineral fertilizers are applied regularly in cropland soils(i.e., wheat-maize, cotton, and paddy soils), and straw is incorporated in most of the wheat-maize soils.

Fig.1 Map of soil types and sampling sites under various land use types in the middle-lower Yellow River Delta,China.The map was generated using ArcMap 10.5(http://www.esri.com/).
Soil sampling and analyses
In order to study the influences of land use on the SOC and SIC distribution in the middle-lower YRD, we selected 34 soil sites across four types of vegetation in the fall of 2015 and 2016. The main cropping system in this study area is maize-wheat rotation,followed by cotton and then rice. Accordingly, we selected 10 maize-wheat rotation sites,12 cotton sites,8 paddy sites,and 4 reed sites(Fig. 1). For each site, 3—4 plots were randomly selected,and soil samples were collected from the 0—20, 20—40,40—60, 60—80, and 80—100 cm layers (5 cm in diameter),mixed for the respective layers in the field, air dried, and passed through a 2-mm sieve.Soil bulk density(BD)was determined for a few representative profiles for each land use type(i.e.,wheat-maize,cotton,paddy,and reed soils).Soil pH was measured at a soil:water ratio of 1:5 using a pH meter,electrical conductivity(EC)and total dissolved solids(TDS)using a conductivity meter(FiveEasy Benchtop FP30,Mettler Toledo, Zurich, Switzerland), and water-soluble Ca2+,Mg2+,and Na+using atomic absorption spectrometry by inductively coupled plasma mass spectrometry (ICPMS)(Agilent 7700x,Agilent,California,USA).Here,the changes in EC were used to infer variations in salinity(Zhanget al.,2011;Wanget al.,2017).Soil total C and SOC contents were analyzed using representative sub-samples(<0.25 mm)with a CNHS-O analyzer(Model EuroEA3000,Arvato,Venice,Italy).For SOC measurement,soil samples were preprocessed with phosphoric acid(H3PO4)to remove carbonate.The SIC content was obtained as the difference between soil total C and SOC contents.Detailed descriptions of methodology were given by Guoet al.(2016).
Data analyses
For each soil profile,densities of SOC,SIC,TDS,and water-soluble Ca2+/Mg2+(XDENSITY,kg m-2)were calculated using their contents(Xi,g kg-1),BD(Ei,g cm-3)and thickness(Di,cm)for layerias follows:
For each vegetation type in this study, the stocks of SOC and SIC(YSTOCK,kg)were then computed using the mean value ofXDENSITYin the 0—100 cm soil layer and corresponding area(m2)(Eq.2):

Areas of vegetation types were identified from the Shandong Statistical Yearbook-2016(http://tjj.shandong.gov.cn/tjnj/nj2016/indexch.htm),where the reed area was assumed to be the sizes of natural wetland,and the areas of other land use types were the sizes of corresponding land use types,taking the city areas(including Binzhou City and Dongying City,China)as the units of land use type areas(Shenget al.,2016).
We used analysis of variance(ANOVA)and Kruskal-Wallis tests for the data with normal and non-normal distribution,respectively,to assess the differences in soil properties among different vegetation types(i.e.,maize-wheat,cotton,and paddy)and soil layers.The Duncan’spost-hocmultiple comparisons(parametric test)or pairwise Wilcox test(nonparametric test) were used to compare the means atP <0.05 for dry land sites.Independent-samplet-test(parametric test)or Mann-Whitney test(non-parametric test)was used to compare soil properties between paddy and reed soils in the middle-lower YRD and also used to compare between middle-lower YRD and upper YRD.APvalue of<0.05(two tail)was considered to be statistically significant.Pearson correlation and linear regression were performed using SPSS(version 24),and maps were created using SigmaPlot(version 12.5)and ArcMap(version 10.5).
RESULTS
Soil chemical properties
Mean soil pH in the 0—20 cm layer was significantly(P <0.05)lower in dry cropland soils(8.28 and 8.46 for maizewheat and cotton,respectively)than in paddy soils(8.63)(Table I). Soil pH was not significantly different between paddy soils and natural wetland soils(8.41).Similarly,soil pH was significantly higher in paddy soils(8.79—9.01)than in dry cropland soils(8.47—8.61 and 8.68—8.70 for maizewheat and cotton,respectively)below 20 cm and in natural wetland soils(8.71)in the 80—100 cm soil layer(P <0.05).In general,soil pH was significantly lower above 40 cm soil layers than below 40 cm soil layers of dry cropland soils(including maize-wheat and cotton)and paddy soils(P <0.05).
There were no obvious differences in mean values of soil EC, TDS, and water soluble Ca2+and Na+contents in the 0—20 cm layer among the different land use types(Table I).Soil EC below 60 cm was significantly different(P <0.05) among the different land use types, with the largest value in reed soils (479—705 μS cm-1), followed by dry cropland soils(507—513 and 412—418 μS cm-1for maize-wheat and cotton,respectively),and the smallest in paddy soils(265—290 μS cm-1).The TDS was significantly higher in dry cropland soils(1 293—1 308 mg kg-1for cotton and 1 046—1 062 mg kg-1for maize-wheat)and reed soils(1 221—1 798 mg kg-1)than in paddy soils(668—733 mg kg-1) (P <0.05). Similarly, water-soluble Ca2+content was also significantly higher in cotton(108—118 mg kg-1)and reed (84—82 mg kg-1) soils than in paddy soils (81—88 mg kg-1)(P <0.05).Overall,the mean values of soil EC,TDS,and water soluble Ca2+and Na+contents for each land use type were not significantly different among different soil layers.
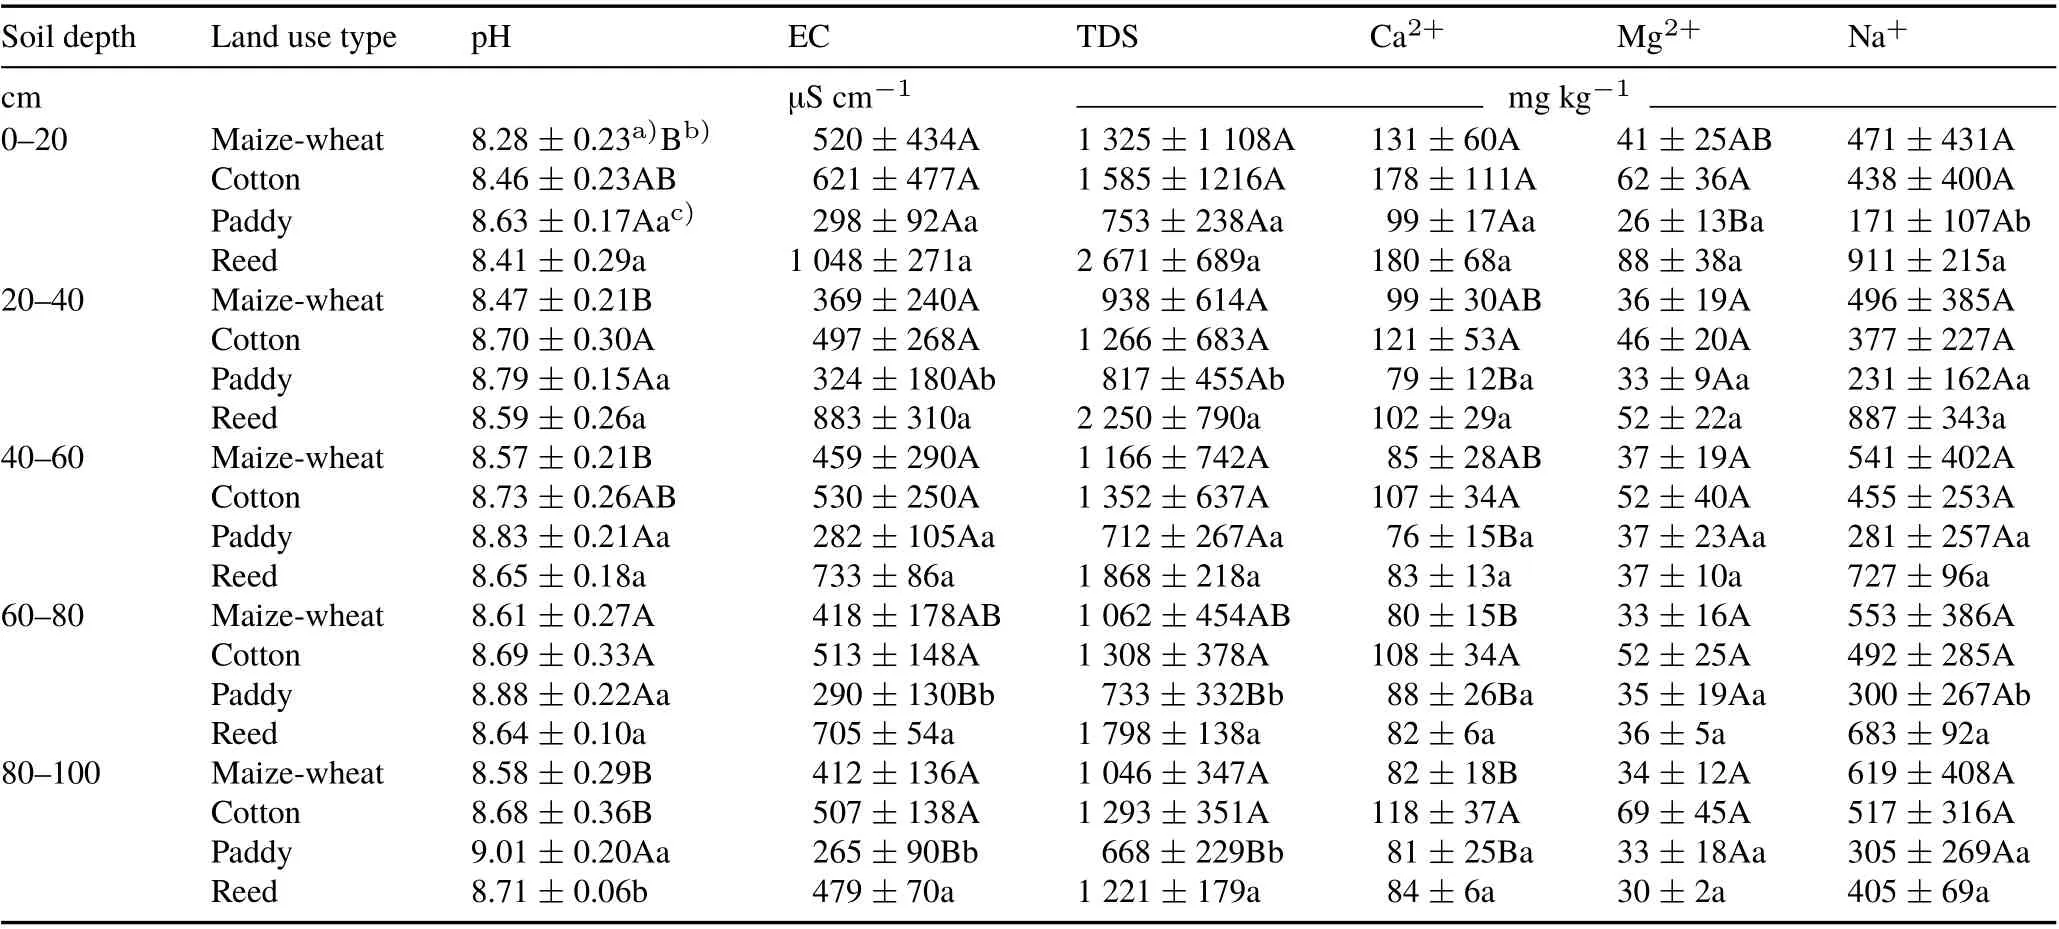
TABLE I Soil pH,electrical conductivity(EC),total dissolved solids(TDS),and water-soluble Ca2+,Mg2+and Na+in the 0—20,20—40,40—60,60—80 and 80—100 cm layers under different land use types in the middle-lower Yellow River Delta,China
Spatial distributions of SOC and SIC densities
Our data revealed small spatial variability in both SOC and SIC densities in the 0—20 cm layer(Fig.2a,b),showing a range of 0.99—2.65 and 2.04—4.30 kg C m-2,respectively.Overall,SOC density was higher in the west of the middlelower YRD which was far away from the coastal zone,while relatively higher SIC density was found in the east section close to the coastal zone.
There were small spatial variations in both SOC and SIC densities in the 20—40 cm layer as well(Fig.2c,d),with a range of 0.40—1.26 and 2.35—4.93 kg C m-2,respectively.However,there were large spatial variations in both SOC and SIC densities in the 40—100 cm layer(Fig.2e,f),showing a range of 1.02—2.89 and 6.17—12.7 kg C m-2,respectively.The spatial distribution was similar between SOC and SIC densities in the 20—40 and 40—100 cm layers (i.e., higher densities of SOC and SIC in the west).Besides,both SOC and SIC densities in the 20—40 and 40—100 cm layers revealed a decreasing trend from inland to estuary areas.Contents of SOC and SIC under different land use types
The SOC content decreased significantly with soil depth under all land use types (Fig. 3). Overall, SOC content decreased significantly from the 0—20 cm layer to the 20—40 cm layer.Mean values of SOC content varied greatly in the profiles of dry cropland soils (i.e., from 6.23—8.16 to 2.10—2.11 g kg-1)and reed soils(i.e.,from 7.56 to 2.56 g kg-1),with less SOC content in the profiles of paddy soils(from 4.87 to 1.68 g kg-1). We averaged SOC densities in the 0—20 and 20—100 cm layers for each land use type(Table II). Mean SOC density in the 0—20 cm layer was significantly (P <0.05) lower in paddy soils (1.26 kg C m-2)than in dry cropland soils(1.69 and 2.02 kg C m-2for maize-wheat and cotton,respectively)and natural wetland soils(1.81 kg C m-2).The SOC density in the 20—100 cm layer was significantly lower (P <0.05) in paddy soils(2.03 kg C m-2)than in dry cropland soils(2.75 and 2.95 kg C m-2in maize-wheat and cotton,respectively).
The SIC content showed different vertical trends across land use types(Fig.3).There was little vertical variation in SIC content under all land use types,i.e., 11.39—12.56,10.46—10.55, 10.33—10.34, and 10.55—12.82 g kg-1in maize-wheat, cotton, paddy, and reed soils, respectively.On average,SIC density in the 0—20 cm layer was not significantly different among paddy soils (2.70 kg C m-2),maize-wheat and cotton soils (2.84—3.11 kg C.m-2), and reed soils(3.08 kg C m-2)(Table II).There were significant differences in SIC density in the 20—100 cm layer in cropland soils(P <0.05),with the largest value in maize-wheat soils(13.39 kg C m-2),followed by cotton soils(11.84 kg C m-2),and the smallest value in paddy soils(11.39 kg C m-2).No significant difference in SIC density in the 20—100 cm layer was found between paddy and reed soils.
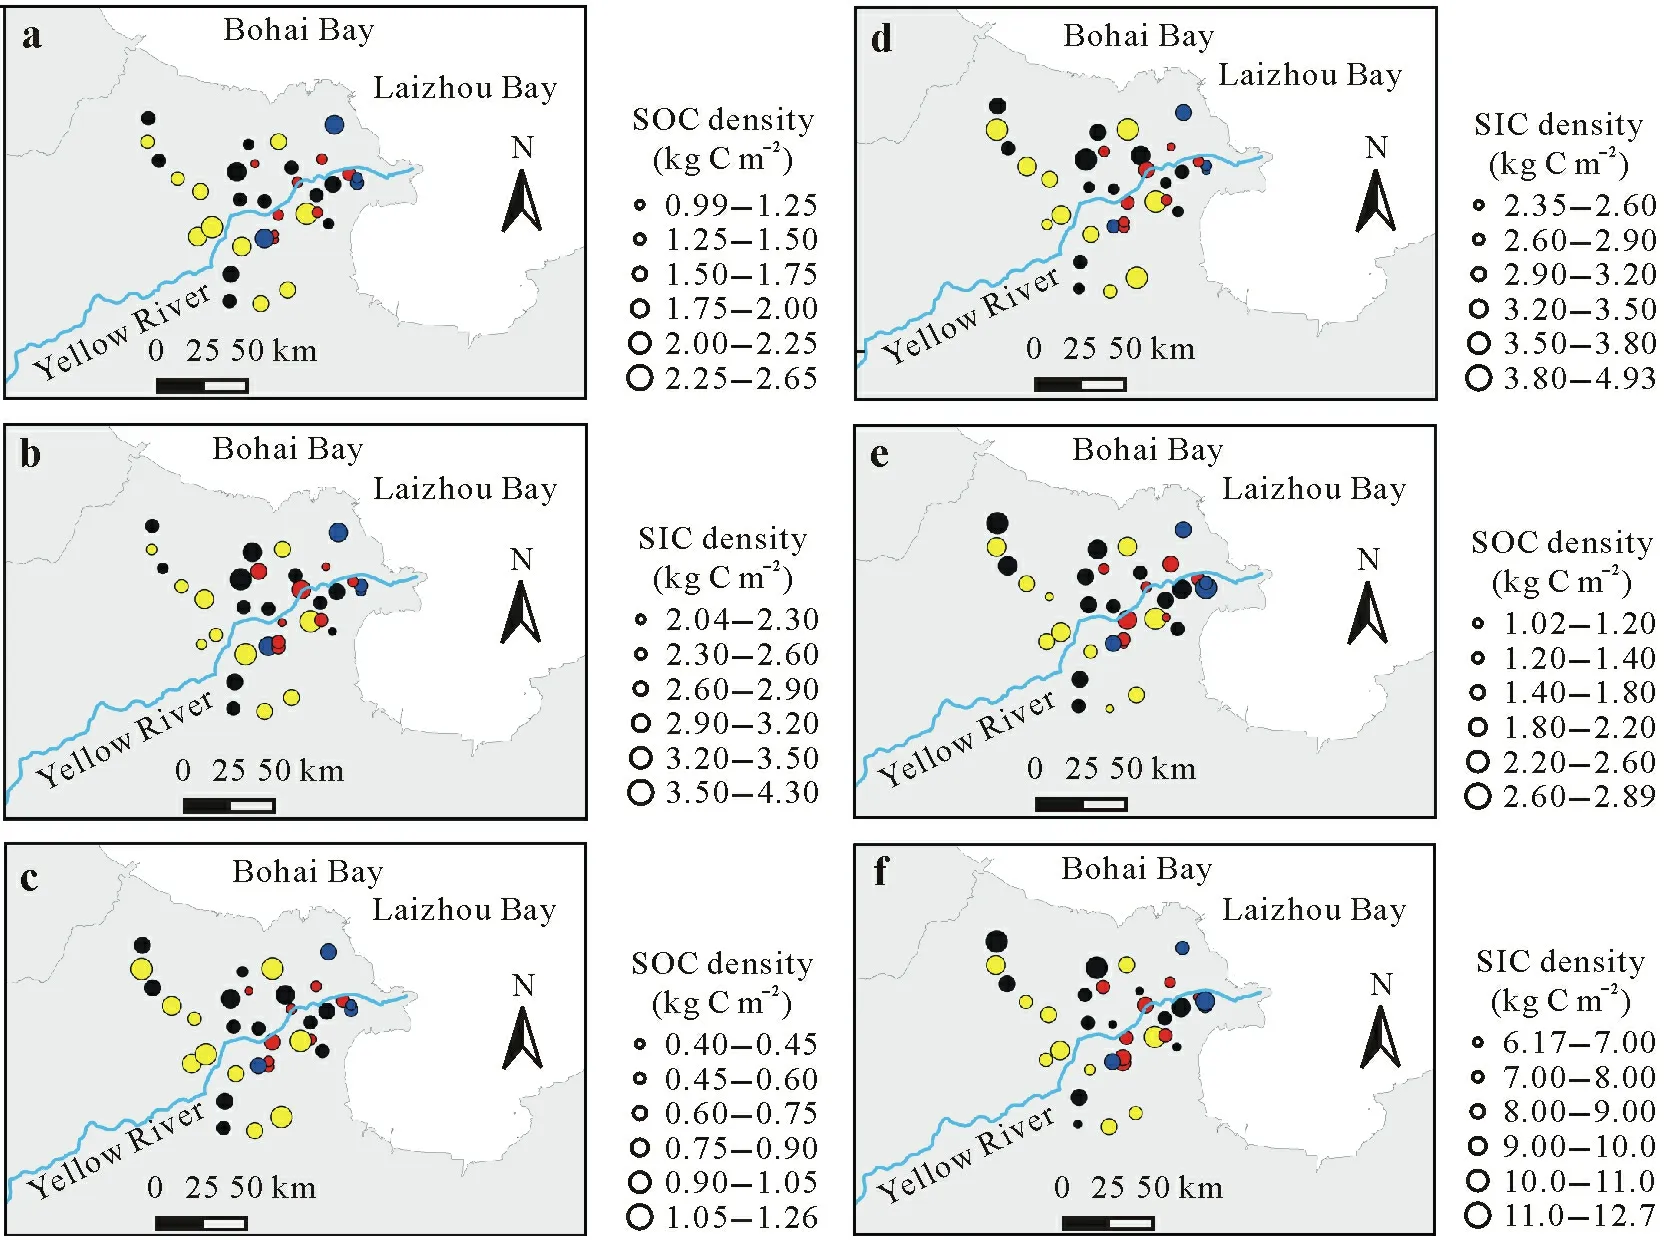
Fig.2 Spatial distribution maps of soil organic C(SOC)(a,c,and e)and inorganic C(SIC)(b,d,and f)densities in the 0—20(a and b),20—40(c and d)and 40—100 cm(e and f)layers under four land use types of maize-wheat(yellow circles),cotton(black circles),paddy(red circles),and reed(blue circles)in the middle-lower Yellow River Delta,China.The maps were generated using ArcMap 10.5(http://www.esri.com/).
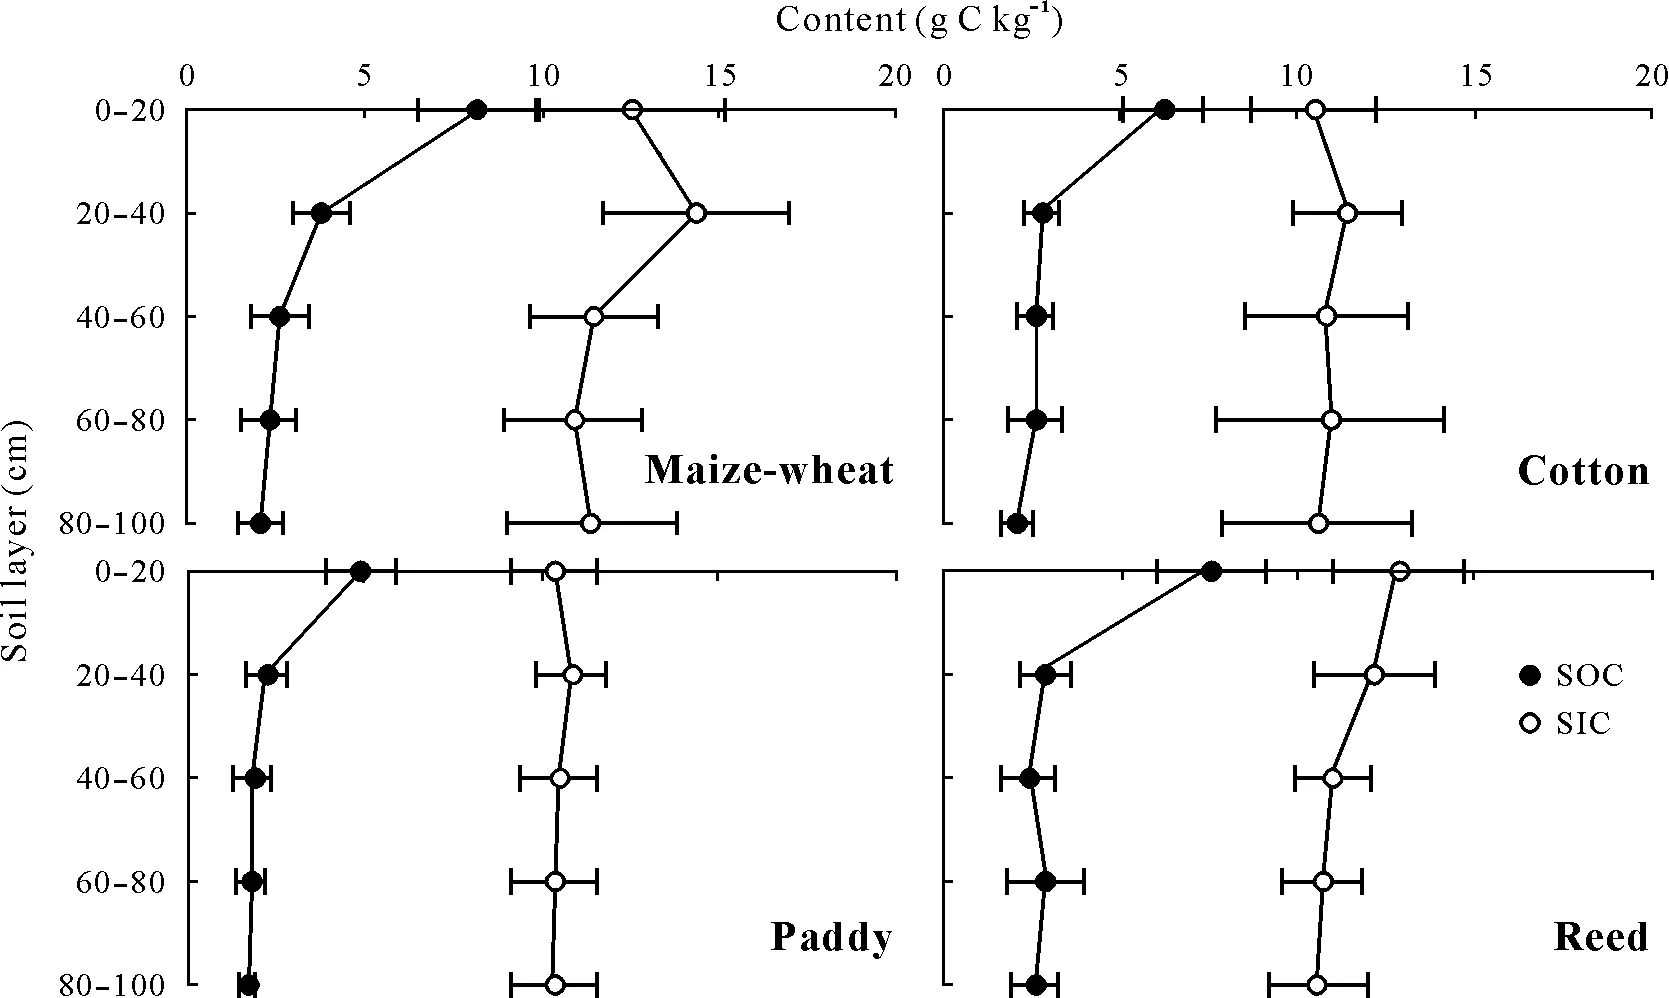
Fig.3 Vertical distributions maps of soil organic C(SOC)and inorganic C(SIC)contents in the 0—20,20—40,40—60,60—80,and 80—100 cm layers under four land use types of maize-wheat(n=10),cotton(n=12),paddy(n=8),and reed(n=4)in the middle-lower Yellow River Delta,China.Vertical bars indicate standard errors of the means.
Relationships between SOC and SIC under different land use types
There were similar spatial distributions between SIC and SOC stocks, especially in the 20—40 and 40—100 cm soil layers (Fig. 2). Our analyses showed that in dry cropland soils(including maize-wheat and cotton),SIC density had a significant positive correlation with SOC density in both the 0—20 and 0—100 cm soil layers(P <0.001)(Fig.4),with a greater slope of 2.3 in the 0—100 cm layer than in the 0-20 cm layer.Despite of the overall positive SIC-SOC relationship in the middle-lower YRD,higher SIC levels corresponded to lower SOC densities in paddy and reed soils,particularly in the 0—100 cm soil layer.
DISCUSSION
Influences of land use and salinization on SOC
Mean SOC density of dry croplands soils in our study(4.71 kg C m-2)is similar to the previously reported value(5.01 kg C m-2)in dry cropland soils of the lower YRD(Liet al.,2014),but lower than that(5.73 kg C m-2)in the upper YRD (Guoet al., 2016). The lower SOC density may be attributable to the shorter cultivation history in the middlelower YRD.In addition,our analyses also demonstrated that SOC stock had a significantly negative relationship with mean values of soil pH and EC in the 0—20 and 0—100 cm soil layers in the dry cropland soils in the middle-lower YRD (Table III), indicating that the relatively low SOC density in the middle-lower YRD may be partly caused by soil salinization that can lead to poor growth thus less inputs of organic C into soil profile(Liet al.,2014;Yuet al.,2016).Zhaoet al.(2017)also showed that lower levels of SOC are associated with higher soil salinity in the YRD.Furthermore,we compared pH and EC(representing salinization level)of dry cropland soils(maize-wheat and cotton soils)from this study with those of maize-wheat cropland soils from Guo Yet al. (2016) (Table IV). Mean values of soil pH and EC for each soil layer were significantly higher in the middle-lower YRD than in the upper YRD above 100 cm.Clearly, the mean value of SOC content was lower in the middle-lower YRD (with higher salinization) than in the upper YRD (with lower salinization), indicating that soil salinization has adverse effects on SOC density in the YRD.
Land use types can have a great influence on SOC dynamics (Menget al., 2014; Yuet al., 2016). Previous studies have shown that SOC density is greater in cropland than in non-cropland of northwestern China,which primarily results from fertilization and irrigation(Suet al.,2010;WangX Jet al., 2015). Our study shows a significantly higher SOC density in dry cropland soils(>4.44 kg C m-2)than in paddy soils(3.28 kg C m-2)in the middle-lower YRD.The relatively higher level of SOC in dry cropland soils may be due to longer history of cultivation with straw return,which leads to more organic C input into soil and thus SOC enhancement(Zhang T Tet al.,2010;Liet al.,2016).Han D Ret al.(2018)also reported that large SOC increase in the agriculture lands of the North China Plain from 1980 to 2010 is due to successful desalinization and subsequent increases of C inputs,such as improved cultivation managements(i.e.,fertilizer application and straw return).On the other hand,the relatively lower SOC in paddy soils may be due to salt washing, which could cause losses of soil C during saltleaching process(Jobbágy and Jackson,2001).Interestingly,SOC density in reed soils(4.68 kg C m-2)is comparable with that in dry cropland soils in the middle-lower YRD,which may be due to lower decomposition rates of soil organic matter under the anaerobic condition in natural wetland(Liet al.,2014;Zhaoet al.,2017,2018).

TABLE II Soil organic C(SOC)and inorganic C(SIC)densities in the 0—20 and 20—100 cm layers under four land use types of maize-wheat,cotton,paddy,and reed in the middle-lower Yellow River Delta,China
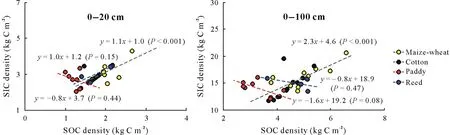
Fig.4 Relationships between soil inorganic C(SIC)and organic C(SOC)densities in the 0—20 and 0—100 cm layers in dry cropland soils(maize-wheat and cotton),paddy soils,and reed soils in the middle-lower Yellow River Delta,China.

TABLE III Correlation coefficients between soil organic C(SOC)and inorganic C(SIC)densities and soil electrical conductivity(EC)and water soluble Ca2+ and Mg2+ in the 0—20 and 0—100 cm layers in dry cropland soils(maize-wheat and cotton)and paddy soils in the middle-lower Yellow River Delta,China
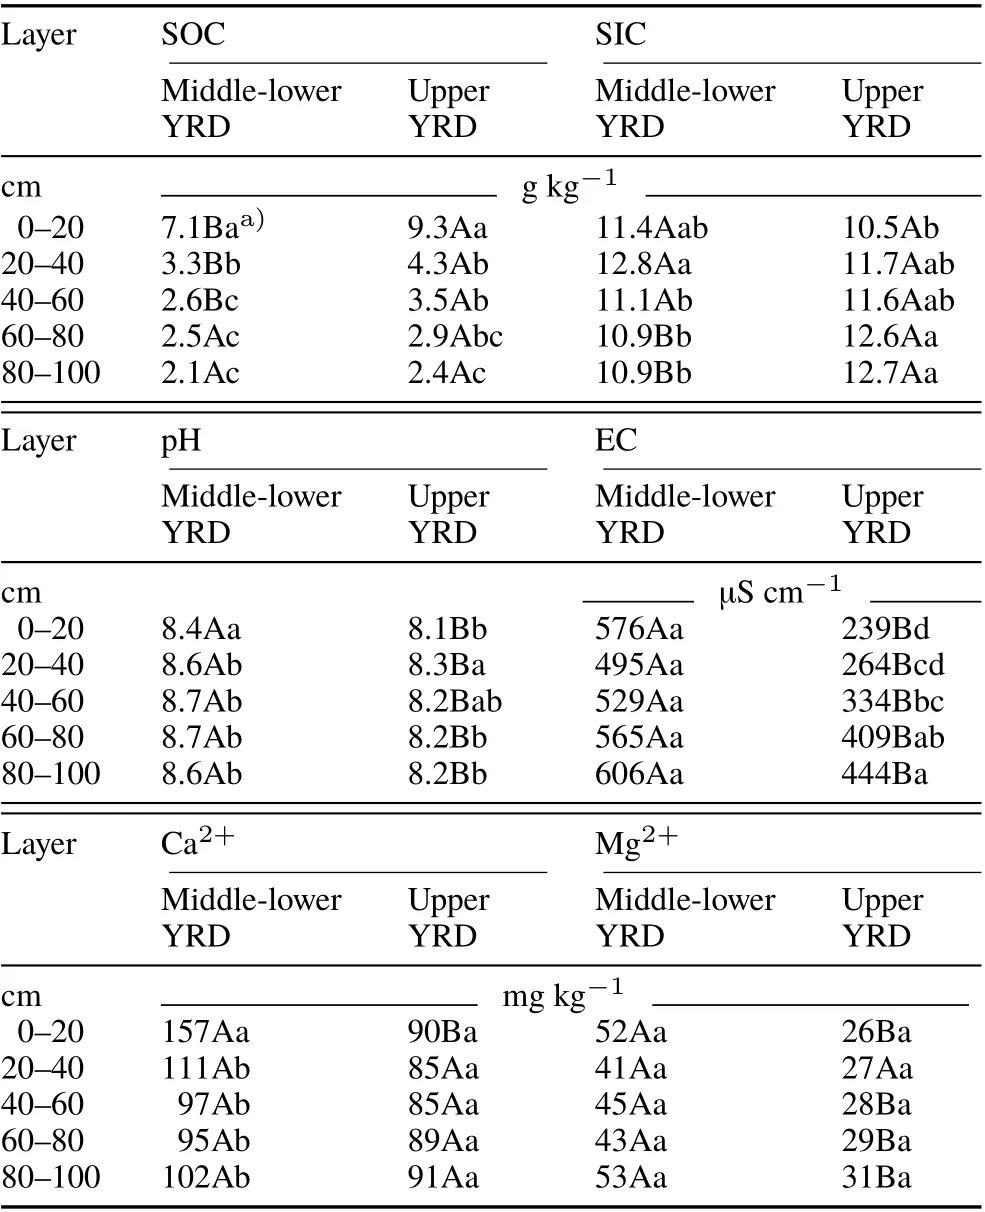
TABLE IV Selected soil basic properties,soil organic C(SOC),inorganic C(SIC),pH,electrical conductivity(EC),and water soluble Ca2+ and Mg2+, in the 0—20,20—40,40—60,60—80,and 80—100 cm in dry cropland in the middlelower (maize-wheat and cotton soils, n = 22) and upper (maize-wheat soils,n=31)(Guo Y et al.,2016)Yellow River Delta(YRD),China
The differences in SOC density among different land use types could be partly related to spatial heterogeneity in sedimentological and hydrological characters in this area(Fanget al., 2005). Furthermore, the development of cropping system in the middle-lower YRD was largely based on soil salinity,i.e.,wheat-maize and cotton on low salinity soils and paddy on high salinity soils(Liet al.,2016),implying that there might be some differences in soil C density prior to land use in the YRD.
Effects of land use and salinization on SIC
Mean SIC density of dry cropland(15.5 kg C m-2)over 0—100 cm soil layer in the middle-lower YRD is close to that(16.9 kg C m-2)in the upper YRD(Guoet al.,2016),but much lower than that of Northwest China(e.g.,21.6—22.1 kg C m-2in the Loess Plateau(Changet al.,2012;Zhanget al.,2015)and 42.0 kg C m-2in the Yanqi Basin(Wang J Pet al.,2015)).The large differences between the(semi-)arid regions and semi-humid areas may be attributable to the climatic conditions and associated hydrological cycles(Wanget al.,2018).For instance,relatively higher precipitation in the YRD could result in dissolution of soil carbonate,and subsequently the leaching of bicarbonate and Ca2+/Mg2+down to deeper soil or groundwater (Shiet al., 2017). In addition,the lower levels of SOC density in the middle-lower YRD can cause less CO2production,thus smaller C sources for carbonate precipitation,leading to lower levels of SIC density(Wang X Jet al.,2015).
Effects of land use on SIC are complex because carbonate precipitation and dissolution may be affected by both biotic and abiotic processes (Monger and Gallegos, 2000). Our study shows a lower SIC density in paddy(14.09 kg C m-2)and reed(15.02 kg C m-2)soils than in maize-wheat soils(16.24 kg C m-2) in the middle-lower YRD. Anaerobic conditions in flooded or saturated soil often inhibit microbial activities,causing a lower decomposition rate of soil organic matter(Zhaoet al.,2018),thus a smaller source of C,which is unfavorable for carbonate precipitation(Wang X Jet al.,2015).Such impact may be greater in paddy soils because of the lower levels of SOC.On the other hand,periodic salt washing and draining in paddy soils can cause dissolution of soil carbonate and removal of bicarbonate and Ca2+/Mg2+,leading to lower SIC levels in the upper part of soil profile(Sartoriet al.,2007;Tanget al.,2016).Our analyses show that water-soluble Ca2+content was significantly higher in dry croplands than in paddy soils,especially below 20 cm soil depth(Table I).There was a significant positive correlation(P <0.05) between SIC and water-soluble Ca2+in the 0—100 cm layer of the dry cropland soils.Similar findings on the SIC-Ca2+relationship was also reported for the maizewheat cropland soils of upper YRD (Guoet al., 2016).Apparently,land use and management have large influences on the formation and transformation of SIC in salt-affected lands.
Impacts of land use and salinization on the SIC-SOC relationship
Our analyses demonstrate that in dry cropland soil,SIC density has a significant positive correlation with SOC density in both the 0—20 and 0—100 cm soil layers(P <0.001)(Fig.4).Similar findings of positive SIC-SOC relationship were reported for the Hebei Plain in China(Shiet al.,2017)and the Yanqi Basin of Northwest China(Wang X Jet al.,2015).On the other hand,some studies showed a negative SIC-SOC relationship in the topsoil,including cropland in the Hebei Plain(Liet al.,2010)and non-cropland(grass,shrub,and forest lands)in the Loess Plateau(Zhanget al.,2015;Zhaoet al.,2016;Han X Yet al.,2018).
Limited studies have reported a significant negative relationship between SIC and SOC in paddy soils,e.g.,in the Hangzhou Bay(Duet al.,2012)and the Songnen Plain of East China(Tanget al.,2016).Despite the non-significant negative SIC-SOC relationship in the middle-lower YRD,higher SIC levels corresponded to lower SOC densities in paddy and reed soils, particularly in the 0—100 cm layer(Fig.4).
Negative relationship between SIC and SOC stocks in paddy soils may be explained by the equilibrium of carbonate precipitation and dissolution:

In general,more SOC can produce more CO2in the soil profile. The higher levels of CO2, together with water in paddy soils,would drive the above equation to the left,i.e.,the dissolution of carbonate,leading to lower levels of SIC.In fact, Sartoriet al. (2007) reported that decalcification might occur during the process of water percolation, and increasing SOM inputs could cause a reduction of SIC.
To better understand the effects of salinization on the SIC-SOC relationship,we compared the correlation in the dry cropland soils (maize-wheat and cotton) of middlelower YRD in this study with that in the upper YRD from Guoet al. (2016). While there was a significant positive correlation between SOC and SIC densities in both studies,the relationship differed largely(Fig.5).The intercept was greater in the middle-lower YRD than in the upper YRD,which reflects the differences in SOC and SIC densities,i.e.,significantly lower SOC in the middle-lower YRD(Tables II,IV,and V).The large SIC density in the middle-lower YRD may be due to the high levels of water soluble Ca2+/Mg2+(Table IV).Previous studies have indicated that high levels of Ca2+and Mg2+in high pH soils can lead to enhanced carbonate precipitation(Bughioet al.,2016;Shiet al.,2017).
Implications of land use and management for soil C storage
There are numerous studies addressing the influences of land use and management on SOC dynamics, mainly focusing on topsoil(Fanget al.,2012;Chenet al.,2019).However, there is evidence of a great capacity for soil C storage in subsoil(Jobbágy and Jackson,2000;Mikhailova and Post,2006),and an increasing number of studies have shown that SOC/SIC stocks in the subsoil are highly variable among different land uses and managements(Changet al.,2012;Zhanget al.,2015;Han X Yet al.,2018).Our analyses demonstrate that there are significant differences in both SOC and SIC densities below 20 cm among the different land use types,with significantly higher SOC and SIC densities and larger variations in the dry cropland soils(Table II).
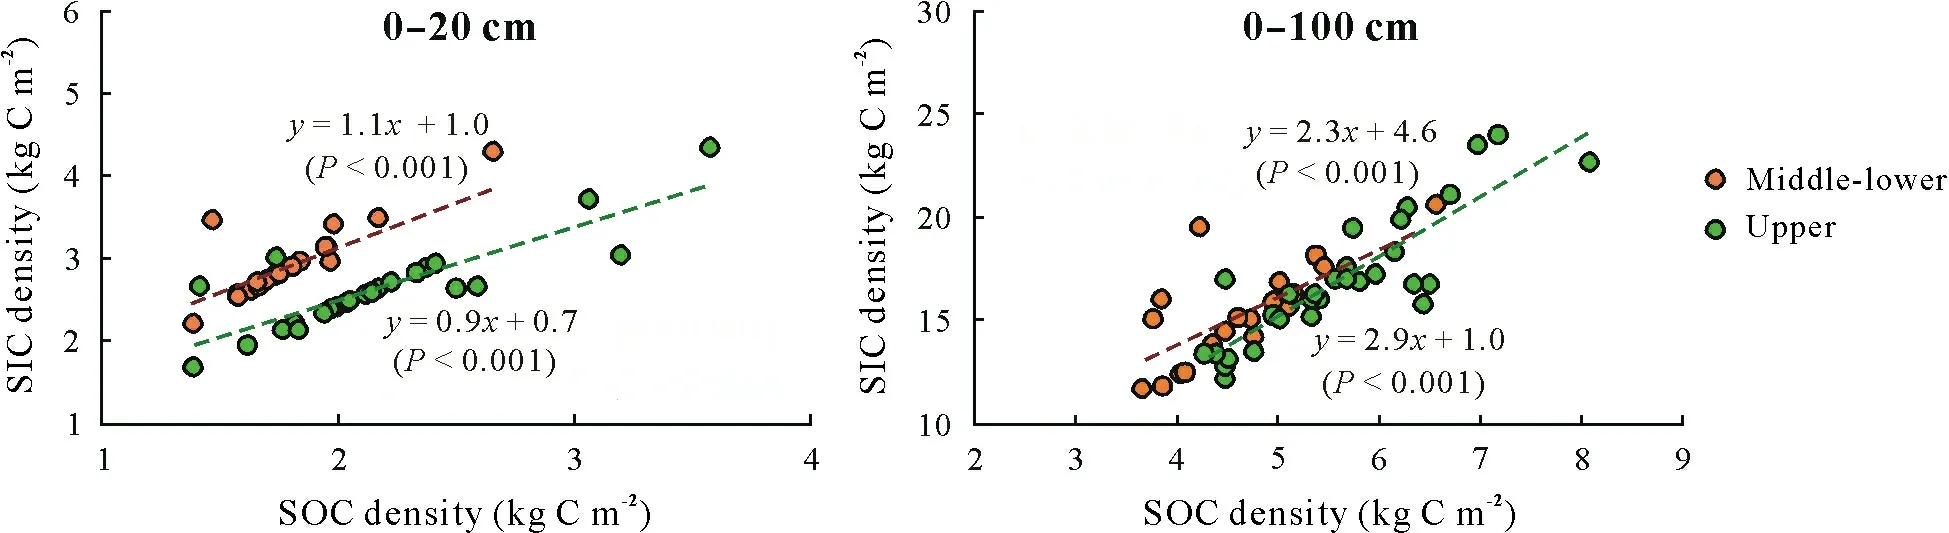
Fig.5 Relationship between soil inorganic C(SIC)and organic C(SOC)densities in the 0—20 and 0—100 cm layers in dry cropland soils of the middle-lower(maize-wheat and cotton)and upper(maize-wheat)(Guo Y et al.,2016)Yellow River Delta,China.
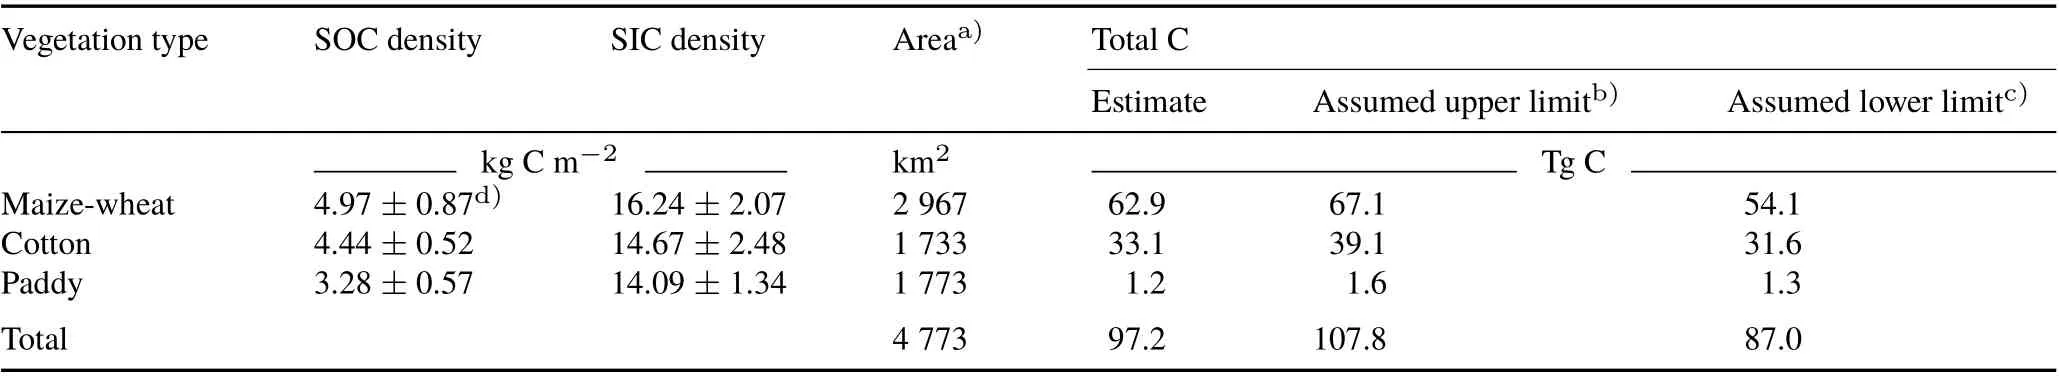
TABLE V Soil organic C(SOC)and inorganic C(SIC)densities and estimated total soil C stock in the 0—100 cm soil layer in cropland of the middle-lower Yellow River Delta,China
The cropland area(including maize-wheat,cotton,and paddy)in the YRD is approximately 4.8×10³km2;thus,we estimated that SOC and SIC stocks were 22.6 and 74.6 Tg C,respectively(Table V).Given that low-to-middle salinity lands can have a maize-wheat rotation system,and lands with high salinity can only be suitable for cultivating cotton and rice in the YRD,any changes in land gradation would have impacts on soil C storage.Amelioration of saline-alkaline soil not only results in improvements of soil physical and chemical properties(Nanet al.,2016;Menget al.,2019),but also leads to increased SOC and SIC densities (Lal,2002; Aminiet al., 2016). As shown in Table V, if soil salinization could be abated with soil quality improved as those in the upper YRD,soil C storage would be increased by 10%(10.6 Tg C)in cropland of the YRD.However, if soil degradation occurs,with worsened salinization(as in cotton and paddy soils),soil C storage might be reduced by 10%(10.2 Tg C)in cropland of the YRD.Therefore,land management has impacts not only on agricultural production,but also on soil C storage.
CONCLUSIONS
This study reports the spatial distributions of SIC and SOC under various land use types in the middle-lower YRD.For the upper 100-cm soil depth,both SOC and SIC densities were significantly higher(P <0.05)in dry cropland soils(maize-wheat and cotton)than in paddy soils.Compared with paddy soils,reed soils contained significantly higher(P <0.05)SOC and slightly higher SIC.Our analyses showed a significant positive SOC-SIC relationship in dry cropland soils,but a potentially negative relationship in paddy soils.On average,SOC and SIC densities were 15%and 4%lower in the middle-lower YRD than in the upper YRD for the maizewheat cropping system,due to the influences of cultivating history and soil salinization.This study demonstrates that soil salinization has adverse effects on soil C storage,and land use type can influence both SOC and SIC densities in the YRD.
ACKNOWLEDGEMENTS
This study was financially supported by the National Natural Science Foundation of China(Nos.41877028 and 41205104). This work also contributes to the activities of N-Circle projects, a UK-China Virtual Joint Centre on Nitrogen, funded by the Newton FundviaBiotechnology and Biological Sciences Research Council(BBSRC)(No.BB/N013484/1).
杂志排行
Pedosphere的其它文章
- Letter to the Editor Molecular characterization of an extensively drug-resistant Acinetobacter baumannii isolated from a corn culture soil
- Distribution characteristics and diversities of cbb and coxL genes in paddy soil profiles from southern China
- Assessment of compost and three biochars associated with Ailanthus altissima(Miller)Swingle for lead and arsenic stabilization in a post-mining Technosol
- Synthesis of an eco-friendly nanocomposite fertilizer for common bean based on carbon nanoparticles from agricultural waste biochar
- Letter to the Editor Soil carbon availability affects nitrogen transformation under irrigated lucerne
- Short-term microbial responses to soluble inorganic P input in a tropical lowland rain forest in Amazonia