补肾活血中药介导Wnt/β-catenin信号通路延缓椎间盘终板压力退变的机制研究
2021-11-15韩涛尹逊路展嘉文魏戌冯敏山于杰李学朋陈明朱立国
韩涛,尹逊路,展嘉文,魏戌,冯敏山,于杰,李学朋,陈明,朱立国*
椎间盘退行性变(intervertebral disc degeneration,IDD)是导致脊柱退行性疾病的根本因素,也是引起腰腿部疼痛、麻木的主要原因之一[1-2]。据相关数据统计,美国下腰痛就诊量在所有到医院就诊患者中排第2位,仅次于因呼吸道疾病就诊量[3]。当前,下腰痛这一类疾病无论在经济上还是对人类健康上,已经产生了严重影响[4-5]。终板位于上下椎体末端和邻近椎间盘交界处,其功能主要为对椎间盘的力学传导与营养传输。有研究表明,终板退变不仅能够引发临床上脊柱疼痛症状,而且还会加速椎间盘退变[2-3]。
临床研究证实,补肾活血中药可显著降低椎间盘源性腰痛患者的疼痛评分及复发率[6]。但补肾活血中药是否通过介导Wnt/β-catenin信号通路调控终板软骨细胞而发挥延缓IDD的作用,有待进一步证实。本实验将利用自主研发的脊柱运动节段离体培养和加载装置构建离体兔脊柱运动节段退变模型,采用荧光定量聚合酶链式反应法(RT-PCR)、Western blot和免疫组化等技术检测退变模型终板软骨细胞功能形态、组织中相关mRNA及蛋白表达分布的情况,旨在从分子水平探讨补肾活血中药在该信号通路中调控终板软骨细胞而发挥延缓IDD的作用机制,以期阐明该复方治疗IDD的药效作用,并为补肾活血中药的临床应用提供实验理论依据,为中药复方干预骨退变机制的研究提供基础。
1 材料与方法
1.1 研究时间 2019年。
1.2 实验动物 于北京市昌扬西山养殖场采购40只健康新西兰大白兔,雌雄各20只,体质量为2.5~3.0 kg,动物合格证编号:SCXX(京)2016-0007。
1.3 药物、试剂和仪器[7-10]
1.3.1 药物 补肾活血中药组成:杜仲15 g、补骨脂10 g、怀牛膝10 g、丹参12 g、威灵仙10 g、木瓜9 g。中药由中国中医科学院望京医院中药房提供。
1.3.2 试剂 DMEM/F12培养基(美国Gibco公司),胎牛血清(美国Gibco公司),苏木红及伊红染液(杭州化学试剂厂),DAB显色剂(北京中杉产品),WB一抗(Gelsolin兔多克隆抗体,美国Abcam公司,货号:Ab74419),WB二 抗(KPL山羊抗兔IgG,美国KPL公司,货号:074-1506),DL2000 DNA Marker(TaKaRa, 货 号:3427Q),PVDF膜(美国Millipore公司,货号:PVH00010)。特定基因引物购自北京Invitrogen公司,其中Wnt-3α上游引物序列为5'-GAGTTTGGTGGGATGGTGTC-3',下游引物序列为5'-TGTCGTACTTGTCCTTGAGCAC-3';β-catenin上 游引物序列为5'-CCTTAGGACTTCACCTGACCGAT-3',下游引物序列5'-CCTTCCATCCCCTCCTGTTTA-3'。
1.3.3 仪器 无菌培养箱(上海一恒科学仪器有限公司),干燥箱(日本三洋,型号:MIR153),恒温水浴箱(江苏太仓医用仪器厂,型号:DSHZ300),离心机(北京离心机厂,型号:LDZ5-2),电子D平(瑞士梅特勒公司,型号:AE100),切片机(德国徕卡仪器有限公司),凝胶成像系统(上海天能科技有限公司,型号:Tanon 1600),荧光定量PCR仪(Applied Biosystems,型号:ABI7500),脊柱运动节段离体加载和培养装置(自主研发,专利号:ZL 2014 20568511.9)。
1.4 方法
1.4.1 实验分组 将40只健康新西兰兔采用随机数字表法分为:对照组、中药组、中药抑制剂组、中药激动剂组,每组10只。对照组:模型+培养液+无药血清;中药组:模型+培养液+补肾活血中药含药血清;中药激动剂组:模型+培养液+SB216763+补肾活血中药含药血清;中药抑制剂组:模型+培养液+ICG001+补肾活血中药含药血清。培养液中含有20%胎牛血清、25 μg/ml抗坏血酸、50 mg/ml庆大霉素[11]。
1.4.2 标本制备与培养 将新西兰兔通过腹腔注射7%水合氯醛(5 ml/kg)全身麻醉后,从耳缘静脉给予肝素钠(0.5 ml/kg),5 min后空气栓塞处死;俯卧位固定,备皮后,用碘酒对腰背部皮肤进行常规消毒;取腰部正中线纵向切口,依次切开筋膜、肌肉组织,取出腰段及下胸段脊柱,将所取脊柱周围的软组织和椎弓等骨组织全部剔除,仅保留椎体和椎间盘,PBS冲洗3次;对取出的脊柱节段定位,自软骨终板与椎体结合处做钝性分离,最后将兔的L1~2、L3~4、L5~6脊柱运动节段完整取出,共计获得120个完整脊柱运动节段;并用PBS、HBSS交替对所取脊柱运动节段进行3次冲洗,随后将冲洗完成的样本置于含培养液的六孔板中保存备用。
将所取的脊柱运动节段放入加载培养装置中,并通过该装置予脊柱运动节段29.4 N压力。随后将离体模型放入37 ℃、5% CO2恒温培养箱中,隔天换液。取材时间为培养前(0 d)和培养后第1、3、7、14天。
1.4.3 取材 将四组脊柱运动节段离体模型在各时间点进行取材分离出椎体终板,其中一部分制作成蜡块标本,用于苏木精-伊红(HE)染色、免疫组化染色以观察椎间盘终板软骨组织形态结构,另一部分取出的椎间盘终板软骨组织进行冷冻处理,用于RT-PCR、Western blot检测Wnt-3α、β-catenin mRNA和蛋白的表达量。
1.5 主要观察指标
1.5.1 HE染色 将上述制作成的蜡块标本切成厚度为5 μm的石蜡带,并用载玻片在50 ℃温水中捞片;60 ℃恒温箱中烤片1 h;然后用二甲苯、乙醇、自来水、PBS冲洗,进行脱蜡至水;用苏木素染色;再经乙醇、二甲苯脱水透明;最后中性树脂封片观察石蜡切片。
1.5.2 免疫组化检测 将石蜡包埋好的终板软骨组织进行切片、脱蜡、水化处理,再进行3次PBS冲洗;将石蜡切片进行20 min热修复,2次PBS冲洗;滴加3%的H2O2,室温下孵育10 min,3次PBS冲洗;滴加5%羊血清,室温下孵育20 min;去除多余液体;滴一抗,4 ℃过夜,3次PBS冲洗;滴二抗,37 ℃环境下孵育20 min,PBS冲洗(5 min/次,3次);滴辣根酶标记链霉卵白素工作液(S-A/HRP),37 ℃环境下孵20 min,PBS冲洗(5 min/次,3次);使用DAB试剂盒(1 ml底物滴加1滴显色剂),混匀后,加至标本,显色6 min,充分水洗;苏木素染色;脱水、透明;中性树脂封片观察石蜡切片。
应用CMOS(日本OLYMPUS公司)及专用软件(美国Media Cybernetics公司Image-Pro Plus)系统测量免疫组化染色切片,得到平均光密度值(mean optical density,MOD),分析蛋白多糖和Ⅱ型胶原的相对表达量。
1.5.3 RT-PCR检测Wnt-3α、β-catenin mRNA表达水平 将终板软骨组织从液氮中取出,剪成细小的碎片后放于含有液氮的研钵中快速研磨成粉末状;加入Trizol(室温,5 min);加入氯仿0.2ml;离心(离心半径10 cm,转速12 000 r/min离心15 min)。检测终板软骨组织RNA浓度及纯度;逆转录合成cDNA;然后进行引物设计、扩增。
1.5.4 Wstern blot检测Wnt-3α、β-catenin蛋白表达水平 向终板软骨组织样品中加入适量裂解液并进行蛋白提取;依照电泳上样量需要,用水及5×loading buffer调整蛋白浓度,100 ℃煮沸变性5 min;取少量上清液进行定量。SDS-PAGE凝胶制备。将藏于-80 ℃冰箱中的终板软骨组织总蛋白样品进行融化;根据蛋白定量结果,将终板软骨组织总蛋白样品及蛋白质上样缓冲液混匀,并进行95 ℃变性;凝胶电泳,即取30 μg样品放入凝胶孔中,并使样品通过浓缩胶与分离胶。最后进行孵育、检测,即在凝胶电泳结束后,将蛋白条带进行转移电泳,在其印转到固相支持物的同时加入一抗和二抗。
1.6 统计学方法 应用Graphpad Prism 8.0软件进行图制作,应用IBM SPSSS tatistics 23.0统计学软件进行数据分析。计量资料以(±s)表示,两组间比较采用独立样本t检验,组内不同时间点比较采用方差分析,多组间比较采用方差分析,两两比较在方差齐时采用LSD分析法,方差不齐时采用dunnett T3法。以P<0.05为差异有统计学意义。
2 结果
2.1 组织学观察 椎间盘软骨终板软骨组织经HE染色,培养前软骨细胞呈现圆形,细胞核呈现蓝色,细胞质均匀红染,软骨层排列致密规则;培养第7天时中药组软骨细胞分散程度、数目及软骨层排列均较对照组完整;培养第14天时对照组和中药组终板软骨组织退变程度均加重,对照组退变程度较中药组更加明显。中药激动剂组较中药抑制剂组培养第3天时终板软骨组织结构的完整性、软骨层排列较好。见图1。
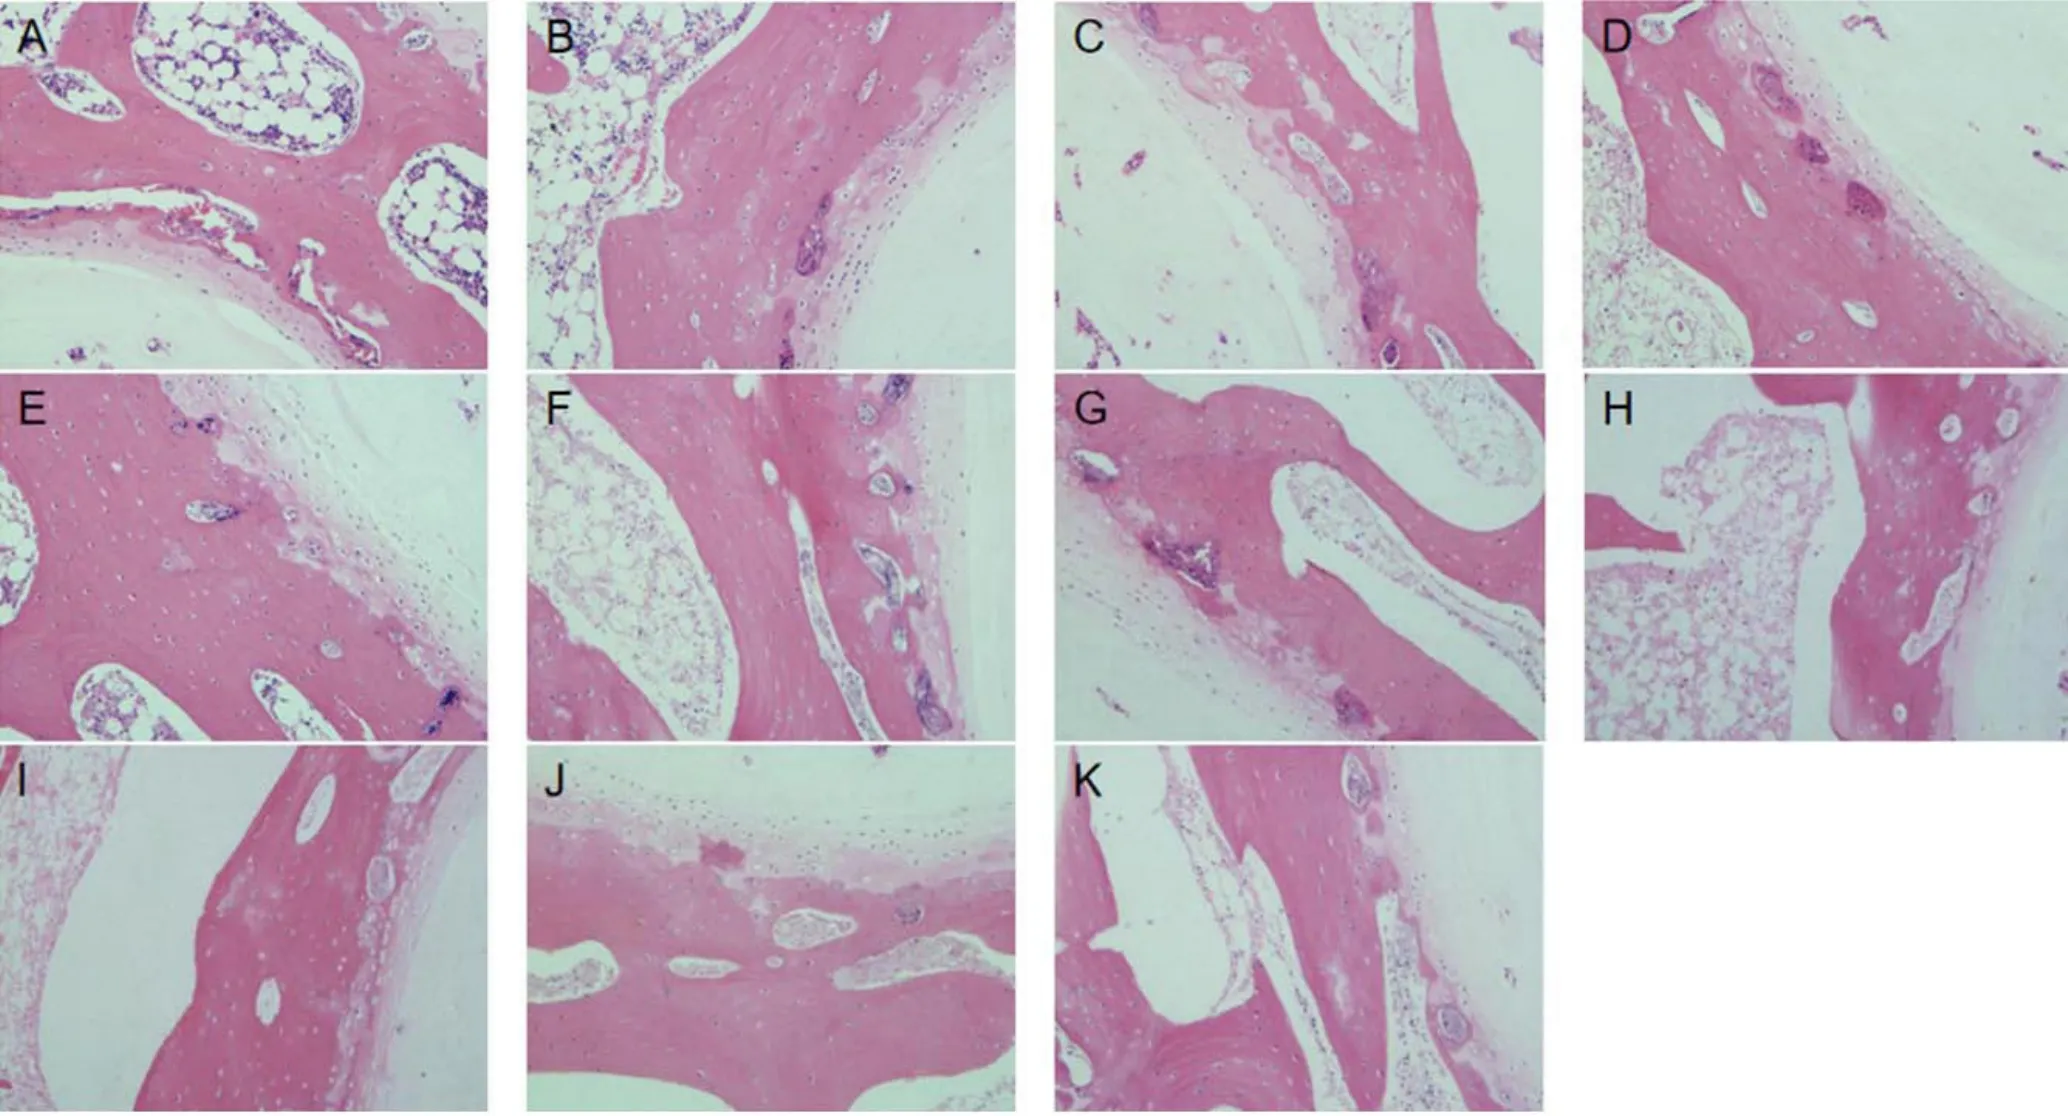
图1 对照组和中药组各时间点及中药抑制剂组和激动剂组椎间盘终板软骨矢状面切片HE染色(×400)Figure 1 HE staining of sagittal sections of intervertebral disc cartilage endplate before culture and on different days of culture in control group, herb group,herb inhibition group and herb activation group
2.2 免疫组化检测
2.2.1 蛋白多糖 蛋白多糖免疫组化检测,见图2,培养前软骨细胞外基质呈棕黄色,颜色较深;中药组培养第1、3天时细胞外基质染色棕褐色阳性反应较对照组强烈。中药组与对照组培养第1、3天时细胞外基质蛋白多糖表达量比较,差异有统计学意义(P<0.05);中药组及对照组培养第7、14天细胞外基质蛋白多糖表达量均较培养前降低,差异有统计学意义(P<0.05);而中药组与对照组细胞外基质蛋白多糖表达量比较,差异无统计学意义(P>0.05),见表1。中药激动剂组培养第3天时细胞外基质染色呈现棕褐色阳性反应,中药抑制剂组培养第3天时细胞外基质染色强度较弱,中药激动剂组、中药抑制剂组蛋白多糖表达量与中药组比较,差异均有统计学意义(P<0.05),见表2、表3。
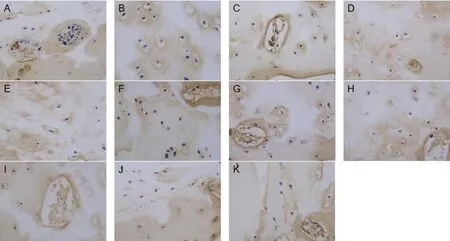
图2 各时间点的对照组与中药组以及中药抑制剂组与中药激动剂组椎间盘终板软组织内蛋白多糖免疫组化染色(×400)Figure 2 Immunohistochemical staining of proteoglycan in soft tissue of intervertebral disc cartilage endplate on different days of culture in control group,herb group,herb inhibition group, and herb activation group
表1 免疫组化检测不同时间点对照组与中药组椎间盘终板蛋白多糖表达量比较(±s)Table 1 Comparison of expression of proteoglycan in intervertebral disc cartilage endplates between control group and herb group at baseline and on different days of culture detected by immunohistochemical
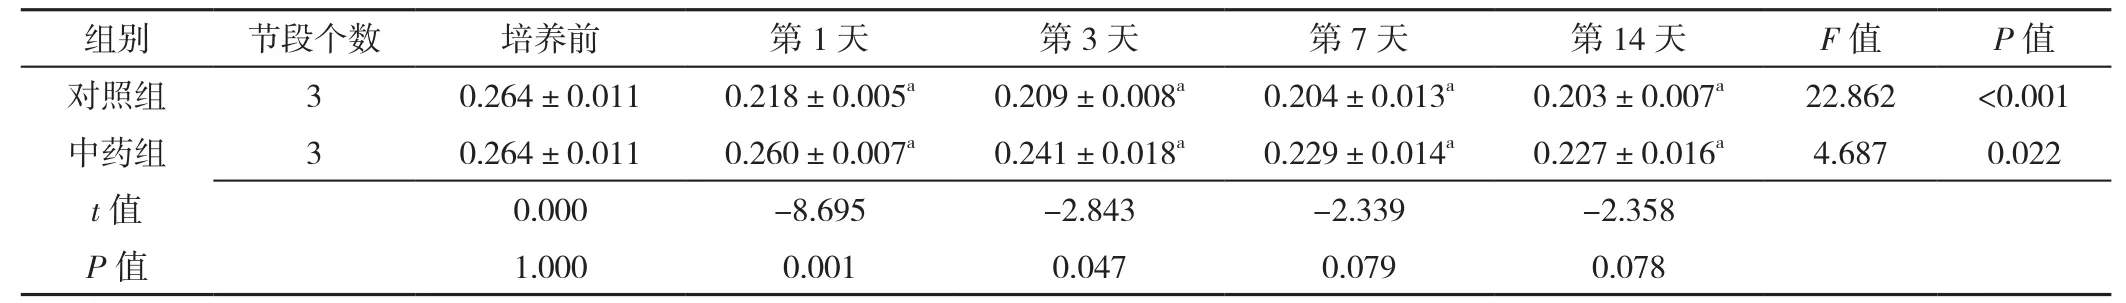
表1 免疫组化检测不同时间点对照组与中药组椎间盘终板蛋白多糖表达量比较(±s)Table 1 Comparison of expression of proteoglycan in intervertebral disc cartilage endplates between control group and herb group at baseline and on different days of culture detected by immunohistochemical
注:与培养前比较,aP<0.05
组别 节段个数 培养前 第1天 第3天 第7天 第14天 F值 P值对照组 3 0.264±0.011 0.218±0.005a 0.209±0.008a 0.204±0.013a 0.203±0.007a 22.862 <0.001中药组 3 0.264±0.011 0.260±0.007a 0.241±0.018a 0.229±0.014a 0.227±0.016a 4.687 0.022 t值 0.000 -8.695 -2.843 -2.339 -2.358 P值 1.000 0.001 0.047 0.079 0.078
表2 免疫组化检测中药组、中药激动剂组椎间盘终板蛋白多糖表达量比较(±s)Table 2 Comparison of expression of proteoglycan in intervertebral disc cartilage endplates between herb group and herb activation group at baseline and 3 days post-culture detected by immunohistochemical
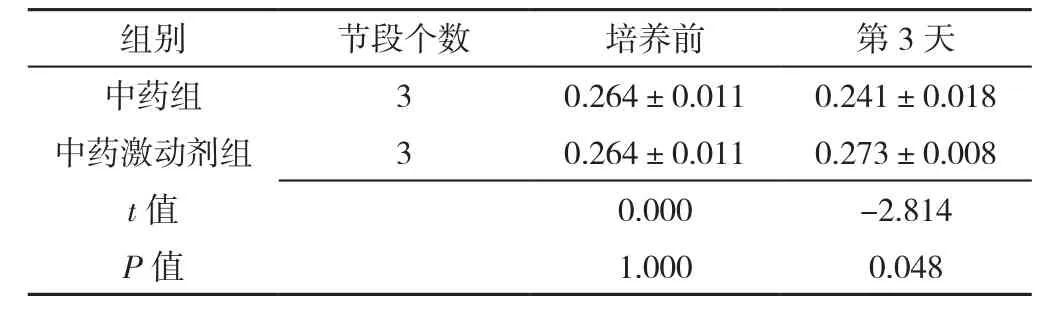
表2 免疫组化检测中药组、中药激动剂组椎间盘终板蛋白多糖表达量比较(±s)Table 2 Comparison of expression of proteoglycan in intervertebral disc cartilage endplates between herb group and herb activation group at baseline and 3 days post-culture detected by immunohistochemical
组别 节段个数 培养前 第3天中药组 3 0.264±0.011 0.241±0.018中药激动剂组 3 0.264±0.011 0.273±0.008 t值 0.000 -2.814 P值 1.000 0.048
表3 免疫组化检测中药组、中药抑制剂组椎间盘终板蛋白多糖表达量比较(±s)Table 3 Comparison of expression of proteoglycan in intervertebral disc cartilage endplates between herb group and herb inhibition group at baseline and 3 days post-culture detected by immunohistochemical

表3 免疫组化检测中药组、中药抑制剂组椎间盘终板蛋白多糖表达量比较(±s)Table 3 Comparison of expression of proteoglycan in intervertebral disc cartilage endplates between herb group and herb inhibition group at baseline and 3 days post-culture detected by immunohistochemical
组别 节段个数 培养前 第3天中药组 3 0.264±0.011 0.241±0.018中药抑制剂组 3 0.264±0.011 0.207±0.008 t值 0.000 2.990 P值 1.000 0.040
2.2.2 Ⅱ型胶原 Ⅱ型胶原免疫组化检测,见图3,培养前软骨细胞外基质呈棕黄色,颜色较深;中药组及对照组培养第1、3天时细胞外基质均呈棕褐色阳性反应,中药组与对照组细胞外基质Ⅱ型胶原表达量比较,差异均有统计学意义(P<0.05);中药组及对照组培养第7、14天时细胞外基质Ⅱ型胶原表达量均较培养前降低,差异有统计学意义(P<0.05);对照组Ⅱ型胶原表达量较中药组升高,差异有统计学意义(P<0.05),见表4。中药激动剂组第3天时细胞外基质染色呈现强烈的棕褐色阳性反应,中药抑制剂组第3天时染色强度较弱;中药激动剂组、中药抑制剂组细胞外基质Ⅱ型胶原表达量分别与中药组比较,差异均有统计学意义(P<0.05),见表5、表6。
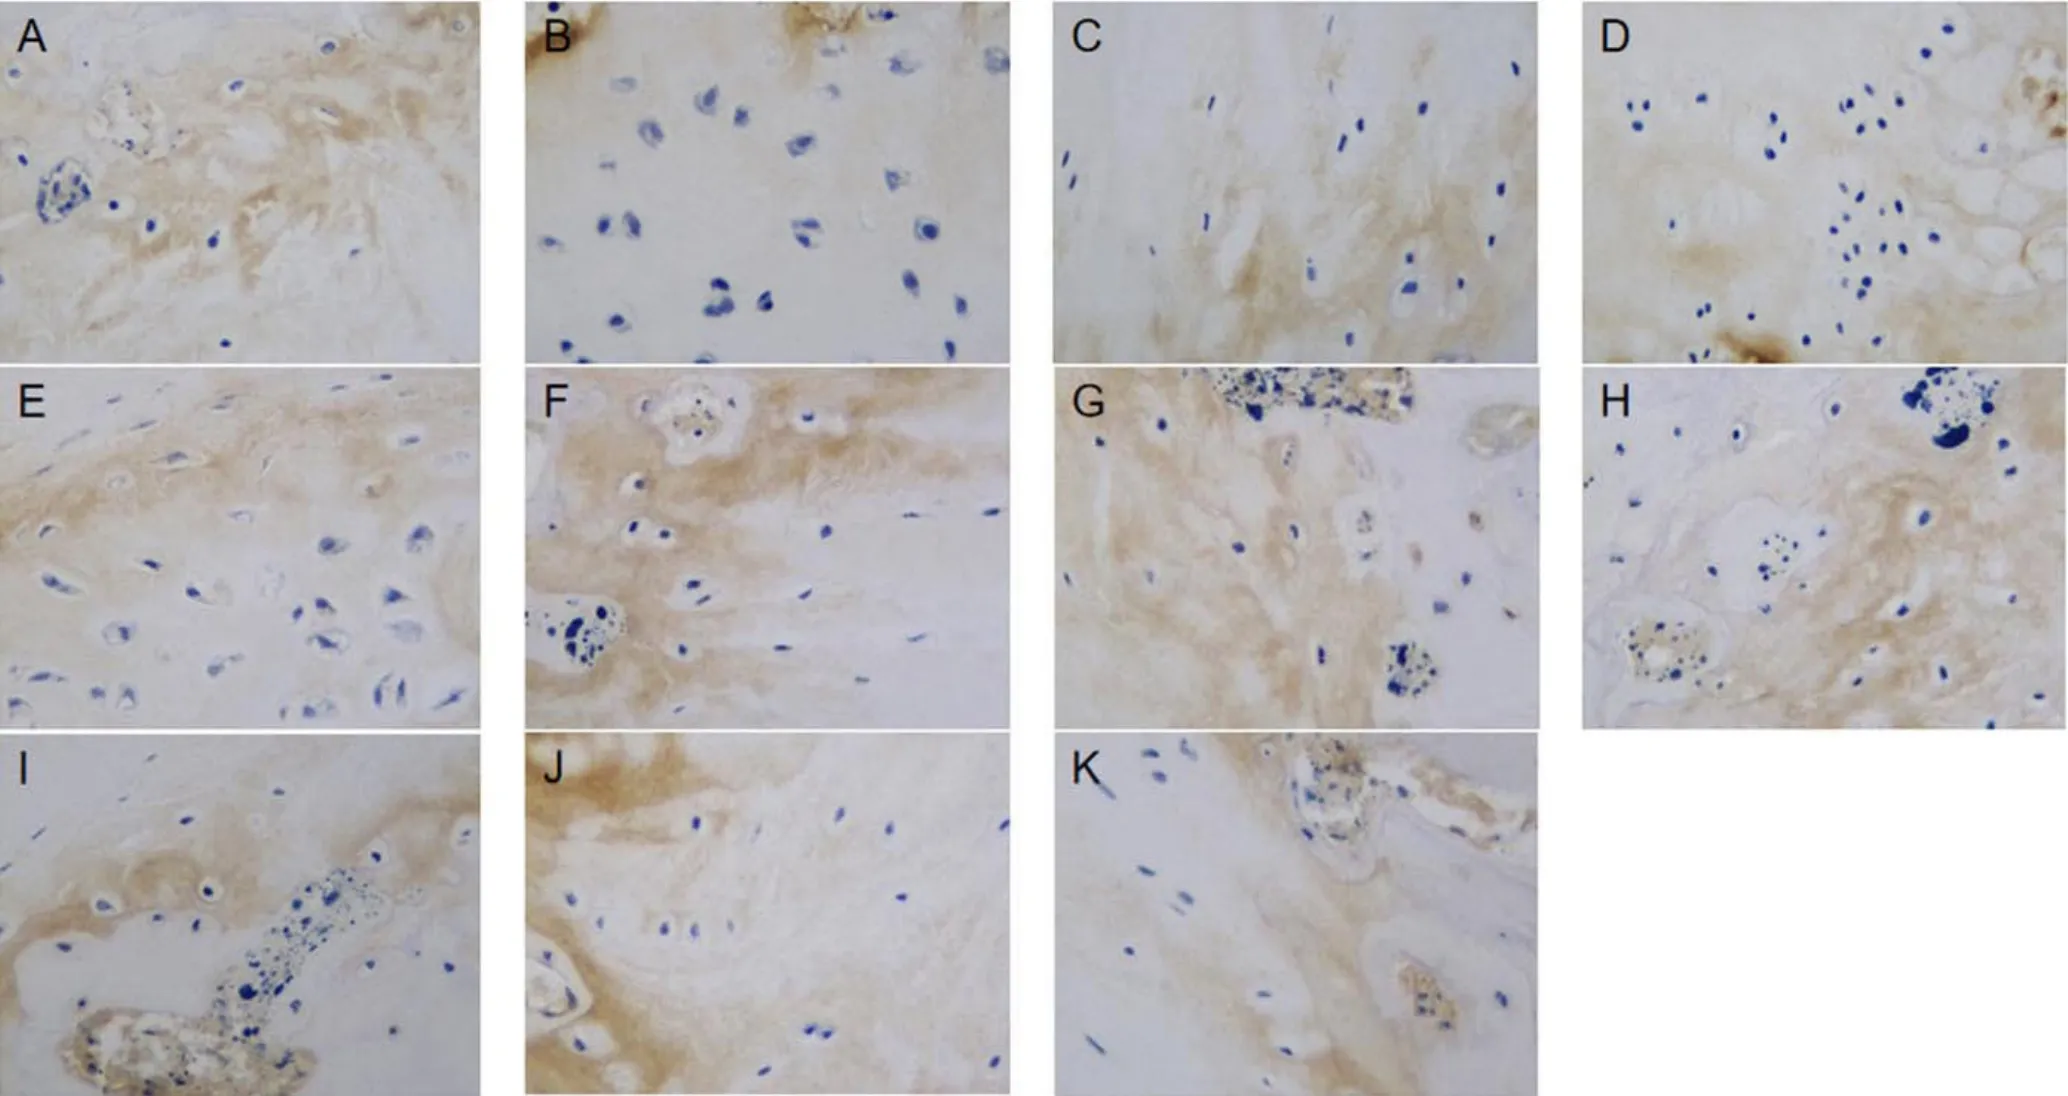
图3 各时间点的对照组与中药组以及中药抑制剂组与中药激动剂组椎间盘终板软组织内Ⅱ型胶原免疫组化染色(×400)Figure 3 Immunohistochemical staining of type Ⅱ collagen in the soft tissue of intervertebral disc cartilage endplate before culture and on different days of culture in control group, herb group,herb inhibition group and herb activation group
表4 免疫组化检测不同时间点对照组与中药组椎间盘终板Ⅱ型胶原表达量比较(±s)Table 4 Comparison of expression of type Ⅱ collagen in the intervertebral disc cartilage endplate between control group and herb group at baseline and 1,3,7,14 days post-culture detected by immunohistochemical

表4 免疫组化检测不同时间点对照组与中药组椎间盘终板Ⅱ型胶原表达量比较(±s)Table 4 Comparison of expression of type Ⅱ collagen in the intervertebral disc cartilage endplate between control group and herb group at baseline and 1,3,7,14 days post-culture detected by immunohistochemical
注:与培养前比较,aP<0.05
组别 节段个数 培养前 第1天 第3天 第7天 第14天 F值 P值对照组 3 0.229±0.003 0.209±0.006a 0.207±0.005a 0.196±0.008a 0.185±0.005a 23.778 <0.001中药组 3 0.229±0.003 0.244±0.009a 0.237±0.005 0.216±0.008a 0.209±0.006a 15.006 0.010 t值 0.000 -5.520 -7.803 -3.111 -5.078 P值 1.000 0.005 0.001 0.036 0.007
表5 免疫组化检测中药组、中药激动剂组椎间盘终板Ⅱ型胶原表达量比较(±s)Table 5 Comparison of expression of type Ⅱ collagen in intervertebral disc cartilage endplates between herb group and herb activation group at baseline and 3 days post-culture detected by immunohistochemical
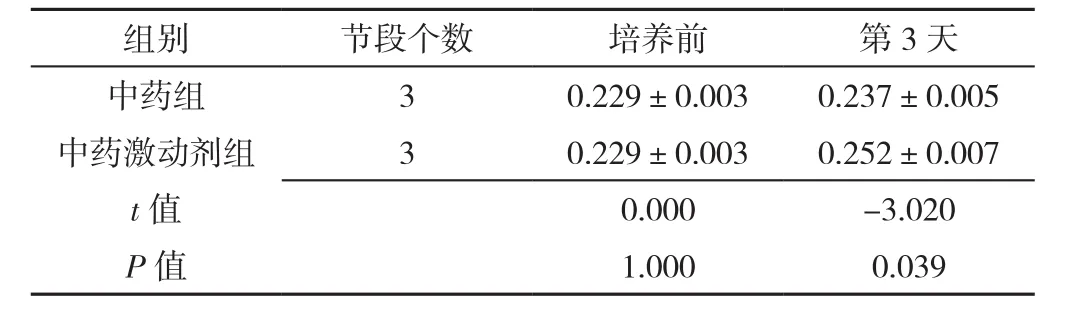
表5 免疫组化检测中药组、中药激动剂组椎间盘终板Ⅱ型胶原表达量比较(±s)Table 5 Comparison of expression of type Ⅱ collagen in intervertebral disc cartilage endplates between herb group and herb activation group at baseline and 3 days post-culture detected by immunohistochemical
组别 节段个数 培养前 第3天中药组 3 0.229±0.003 0.237±0.005中药激动剂组 3 0.229±0.003 0.252±0.007 t值 0.000 -3.020 P值 1.000 0.039
表6 免疫组化检测中药组、中药抑制剂组椎间盘终板Ⅱ型胶原表达量比较(±s)Table 6 Comparison of expression of type Ⅱ collagen in intervertebral disc cartilage endplates between herb group and herb inhibition group at baseline and 3 days post-culture detected by immunohistochemical
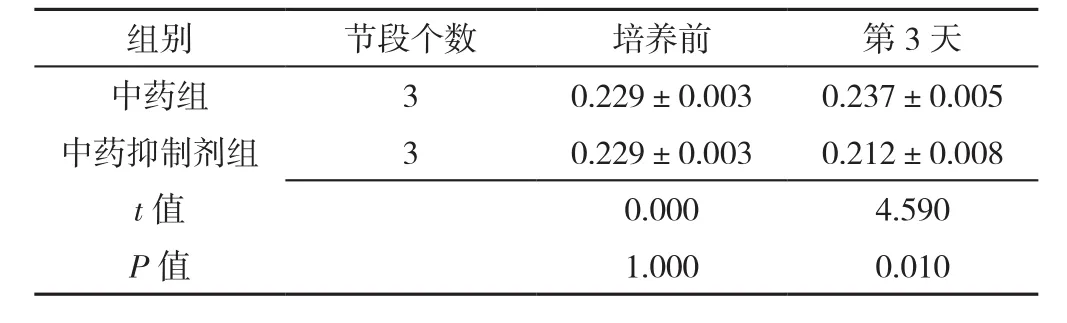
表6 免疫组化检测中药组、中药抑制剂组椎间盘终板Ⅱ型胶原表达量比较(±s)Table 6 Comparison of expression of type Ⅱ collagen in intervertebral disc cartilage endplates between herb group and herb inhibition group at baseline and 3 days post-culture detected by immunohistochemical
组别 节段个数 培养前 第3天中药组 3 0.229±0.003 0.237±0.005中药抑制剂组 3 0.229±0.003 0.212±0.008 t值 0.000 4.590 P值 1.000 0.010
2.3 RT-PCR检测
2.3.1 Wnt-3α mRNA表 达 RT-PCR检 测 Wnt-3α mRNA表达。中药组及对照组Wnt-3α mRNA表达水平均较培养前逐渐降低,差异有统计学意义(P<0.05);中药组培养第1、3、7、14天时Wnt-3α mRNA表达水平均较对照组降低,差异有统计学意义(P<0.05),见表7。中药激动剂组、中药抑制剂组第3天时Wnt-3α mRNA表达水平分别与中药组比较,差异均无统计学意义(P>0.05),见表8、表9。
表7 RT-PCR检测不同时间点对照组与中药组椎间盘终板内Wnt-3α mRNA表达水平比较(±s)Table 7 Comparison of Wnt-3α mRNA expression levels in intervertebral disc cartilage endplates between control group and herb group at baseline and 1,3,7,and 14 days post-culture detected by RT-PCR
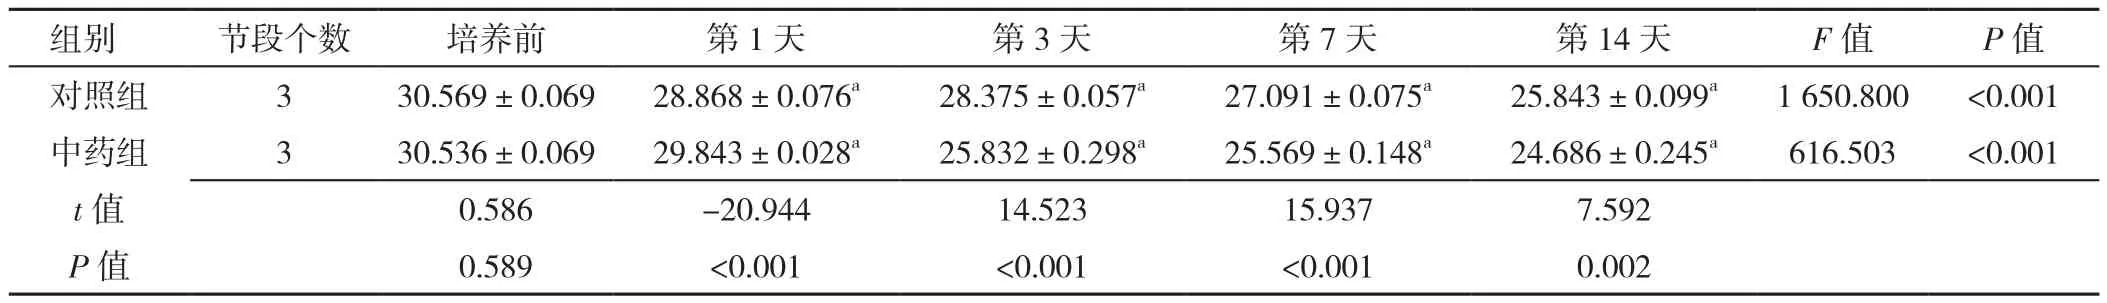
表7 RT-PCR检测不同时间点对照组与中药组椎间盘终板内Wnt-3α mRNA表达水平比较(±s)Table 7 Comparison of Wnt-3α mRNA expression levels in intervertebral disc cartilage endplates between control group and herb group at baseline and 1,3,7,and 14 days post-culture detected by RT-PCR
注:与培养前比较,aP<0.05
组别 节段个数 培养前 第1天 第3天 第7天 第14天 F值 P值对照组 3 30.569±0.069 28.868±0.076a 28.375±0.057a 27.091±0.075a 25.843±0.099a 1 650.800 <0.001中药组 3 30.536±0.069 29.843±0.028a 25.832±0.298a 25.569±0.148a 24.686±0.245a 616.503 <0.001 t值 0.586 -20.944 14.523 15.937 7.592 P值 0.589 <0.001 <0.001 <0.001 0.002
表8 RT-PCR检测中药组、中药激动剂组椎间盘终板内Wnt-3α mRNA表达水平比较(±s)Table 8 Comparison of Wnt-3α mRNA expression levels in intervertebral disc cartilage endplates in herb group and herb activation group at baseline and 3 days post-culture detected by RT-PCR
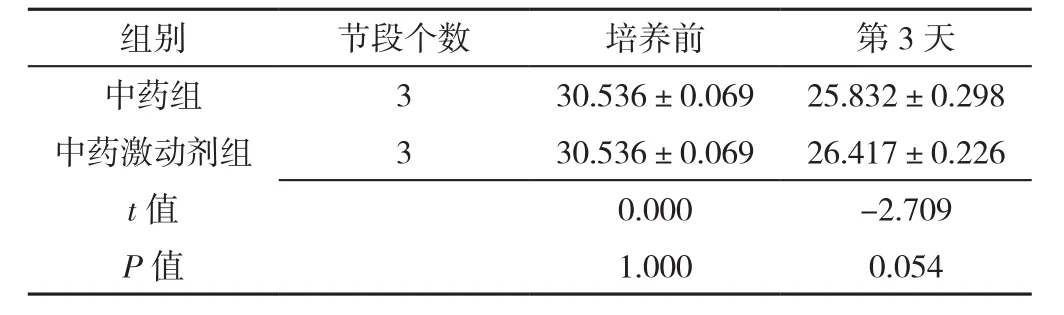
表8 RT-PCR检测中药组、中药激动剂组椎间盘终板内Wnt-3α mRNA表达水平比较(±s)Table 8 Comparison of Wnt-3α mRNA expression levels in intervertebral disc cartilage endplates in herb group and herb activation group at baseline and 3 days post-culture detected by RT-PCR
组别 节段个数 培养前 第3天中药组 3 30.536±0.069 25.832±0.298中药激动剂组 3 30.536±0.069 26.417±0.226 t值 0.000 -2.709 P值 1.000 0.054
表9 RT-PCR检测中药组、中药抑制剂组椎间盘终板内Wnt-3α mRNA表达水平比较(±s)Table 9 Comparison of Wnt-3α mRNA expression levels in intervertebral disc cartilage endplates in herb group and herb inhibition group at baseline and 3 days post-culture detected by RT-PCR
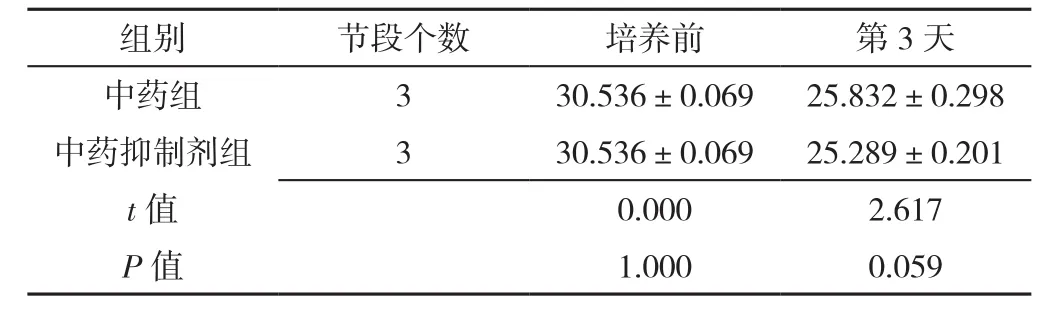
表9 RT-PCR检测中药组、中药抑制剂组椎间盘终板内Wnt-3α mRNA表达水平比较(±s)Table 9 Comparison of Wnt-3α mRNA expression levels in intervertebral disc cartilage endplates in herb group and herb inhibition group at baseline and 3 days post-culture detected by RT-PCR
组别 节段个数 培养前 第3天中药组 3 30.536±0.069 25.832±0.298中药抑制剂组 3 30.536±0.069 25.289±0.201 t值 0.000 2.617 P值 1.000 0.059
2.3.2 β-catenin mRNA表达 RT-PCR检测β-catenin mRNA表达。中药组及对照组β-catenin mRNA表达水平均较培养前逐渐降低,差异有统计学意义(P<0.05);中药组培养第1、3、7、14天时β-catenin mRNA表达水平较对照组降低,差异有统计学意义(P<0.05),见表10。中药激动剂组第3天时β-catenin mRNA表达水平较中药组降低,差异有统计学意义(P<0.05),见表11;中药抑制剂组第3天时β-catenin mRNA表达水平较中药组升高,差异有统计学意义(P<0.05),见表12。
表10 RT-PCR检测不同时间点对照组与中药组椎间盘终板内β-catenin mRNA表达水平比较(±s)Table 10 Comparison of β-catenin mRNA expression levels in intervertebral disc cartilage endplates in control group and herb group at baseline and 1,3,7,14 days post-culture detected by RT-PCR
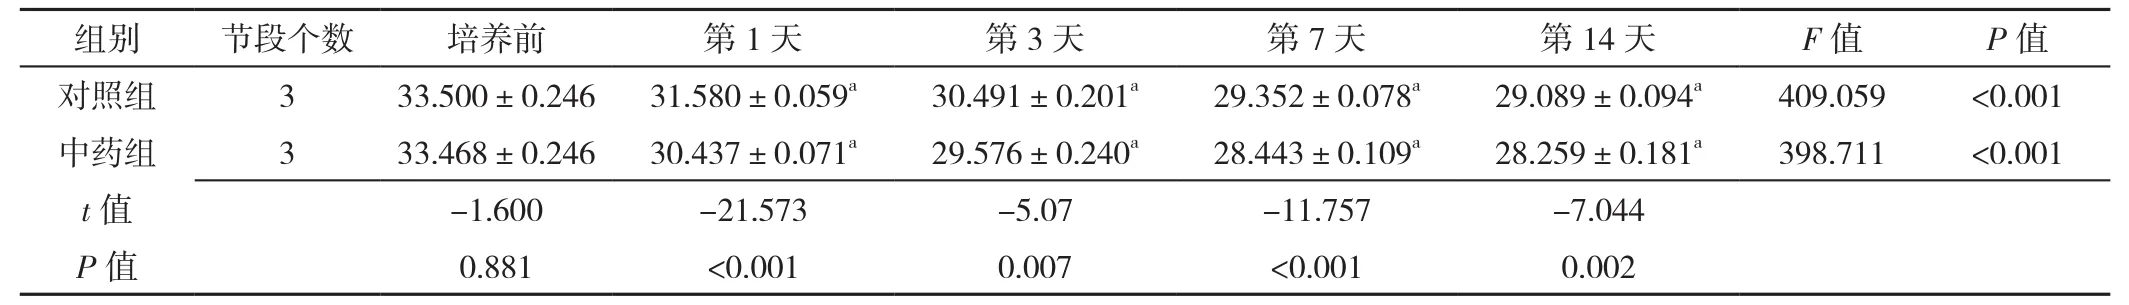
表10 RT-PCR检测不同时间点对照组与中药组椎间盘终板内β-catenin mRNA表达水平比较(±s)Table 10 Comparison of β-catenin mRNA expression levels in intervertebral disc cartilage endplates in control group and herb group at baseline and 1,3,7,14 days post-culture detected by RT-PCR
注:与培养前比较,aP<0.05
组别 节段个数 培养前 第1天 第3天 第7天 第14天 F值 P值对照组 3 33.500±0.246 31.580±0.059a 30.491±0.201a 29.352±0.078a 29.089±0.094a 409.059 <0.001中药组 3 33.468±0.246 30.437±0.071a 29.576±0.240a 28.443±0.109a 28.259±0.181a 398.711 <0.001 t值 -1.600 -21.573 -5.07 -11.757 -7.044 P值 0.881 <0.001 0.007 <0.001 0.002
表11 RT-PCR检测中药组、中药激动剂组椎间盘终板内β-catenin mRNA表达水平比较(±s)Table 11 Comparison of β-catenin mRNA expression levels in intervertebral disc cartilage endplates in herb group and herb activation group at baseline and 3 days post-culture detected by RT-PCR
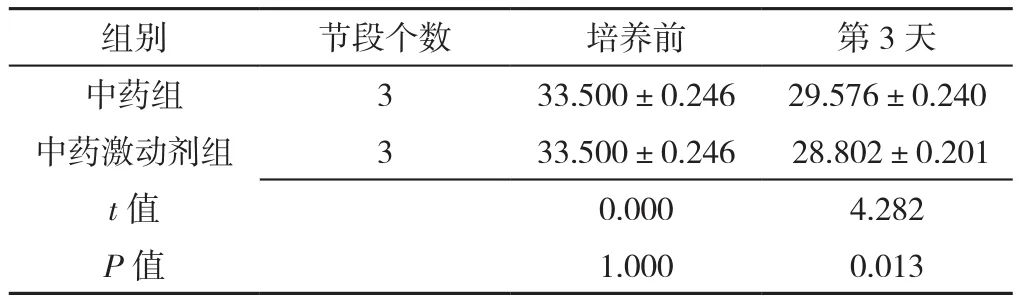
表11 RT-PCR检测中药组、中药激动剂组椎间盘终板内β-catenin mRNA表达水平比较(±s)Table 11 Comparison of β-catenin mRNA expression levels in intervertebral disc cartilage endplates in herb group and herb activation group at baseline and 3 days post-culture detected by RT-PCR
组别 节段个数 培养前 第3天中药组 3 33.500±0.246 29.576±0.240中药激动剂组 3 33.500±0.246 28.802±0.201 t值 0.000 4.282 P值 1.000 0.013
表12 RT-PCR检测中药组、中药抑制剂组椎间盘终板内β-catenin mRNA表达水平比较(±s)Table 12 Comparison of β-catenin mRNA expression levels in intervertebral disc cartilage endplates in herb group and herb inhibition group at baseline and 3 days post-culture detected by RT-PCR
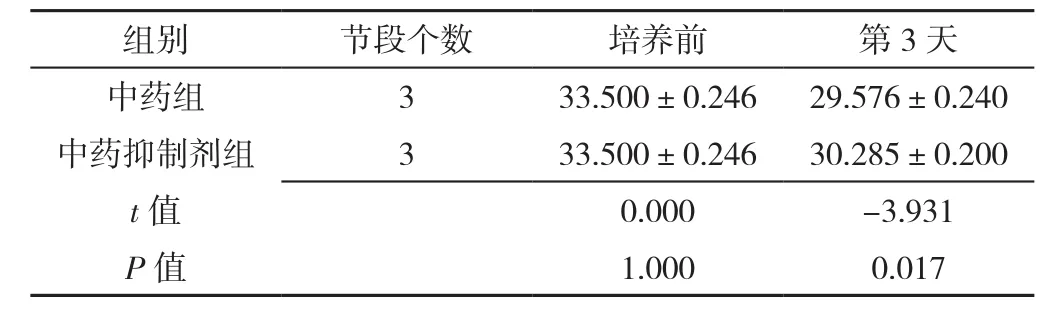
表12 RT-PCR检测中药组、中药抑制剂组椎间盘终板内β-catenin mRNA表达水平比较(±s)Table 12 Comparison of β-catenin mRNA expression levels in intervertebral disc cartilage endplates in herb group and herb inhibition group at baseline and 3 days post-culture detected by RT-PCR
组别 节段个数 培养前 第3天中药组 3 33.500±0.246 29.576±0.240中药抑制剂组 3 33.500±0.246 30.285±0.200 t值 0.000 -3.931 P值 1.000 0.017
2.4 Western blot检测
2.4.1 Wnt-3α 蛋白表达 Western blot检测Wnt-3α蛋白表达,见图4、5。中药组及对照组培养第1、3、7、14天时Wnt-3α蛋白表达水平与培养前比较,差异有统计学意义(P<0.05);中药组培养第1、3、7、14天时Wnt-3α蛋白表达水平较对照组升高,差异有统计学意义(P<0.05),见表13。中药激动剂组、中药抑制剂组第3天时Wnt-3α蛋白表达水平分别与中药组比较,差异均无统计学意义(P>0.05),见表14、表15。
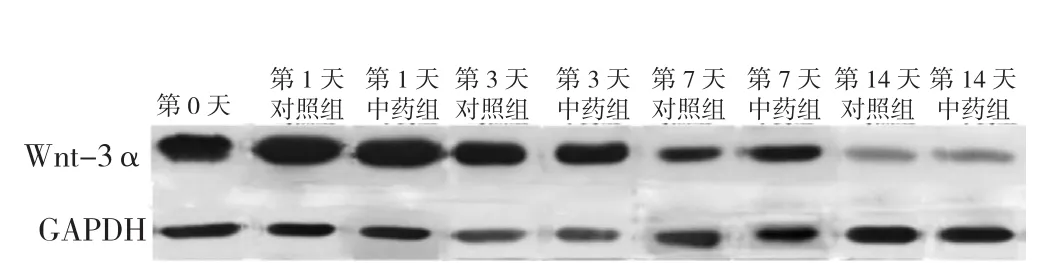
图4 不同时间点对照组与中药组椎间盘终板内Wnt-3α蛋白表达水平电泳图Figure 4 Electrophoretogram of Wnt-3α protein expression levels in intervertebral disc cartilage endplates in control group and herb group at baseline and 1,3,7,and 14 days post-culture
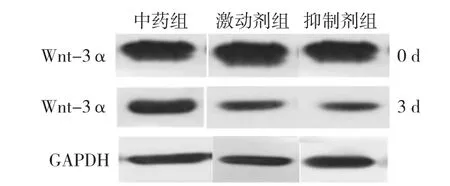
图5 中药组、中药激动剂组、中药抑制剂组椎间盘终板内Wnt-3α蛋白表达水平电泳图Figure 5 Electrophoretogram of Wnt-3α protein expression levels in intervertebral disc cartilage endplates in herb group,herb activation group,and herb inhibition group at baseline and 3 days post-culture
表13 Western blot检测不同时间点对照组与中药组椎间盘终板内Wnt-3α蛋白表达水平比较(±s)Table 13 Comparison of the expression levels of Wnt-3α protein in the endplate between the control group and herb group at baseline and 1,3,7,and 14 days post-culture measured by Western blot

表13 Western blot检测不同时间点对照组与中药组椎间盘终板内Wnt-3α蛋白表达水平比较(±s)Table 13 Comparison of the expression levels of Wnt-3α protein in the endplate between the control group and herb group at baseline and 1,3,7,and 14 days post-culture measured by Western blot
注:与培养前比较,aP<0.05
组别 节段个数 培养前 第1天 第3天 第7天 第14天 F值 P值对照组 3 0.843±0.010 1.036±0.007a 0.535±0.008a 0.374±0.009a 0.235±0.008a 4 760.688 <0.001中药组 3 0.846±0.017 1.256±0.009a 1.046±0.009a 0.684±0.009a 0.546±0.008a 2 050.339 <0.001 t值 -2.278 19.168 7.050 3.160 5.267 P值 0.108 <0.001 0.008 0.038 0.019
表14 Western blot检测中药组、中药激动剂组椎间盘终板内Wnt-3α蛋白表达水平比较(±s)Table 14 Comparison of Wnt-3α protein expression levels in intervertebral disc cartilage endplates in herb group and herb activation group at baseline and 3 days post-culture measured by Western blot

表14 Western blot检测中药组、中药激动剂组椎间盘终板内Wnt-3α蛋白表达水平比较(±s)Table 14 Comparison of Wnt-3α protein expression levels in intervertebral disc cartilage endplates in herb group and herb activation group at baseline and 3 days post-culture measured by Western blot
组别 节段个数 培养前 第3天中药组 3 0.846±0.017 1.046±0.009中药激动剂组 3 0.846±0.017 1.003±0.007 t值 0.000 6.620 P值 1.000 0.076
表15 Western blot检测中药组、中药抑制剂组椎间盘终板内Wnt-3α蛋白表达水平比较(±s)Table 15 Comparison of Wnt-3α protein expression levels in intervertebral disc cartilage endplates in herb group and herb inhibition group at baseline and 3 days post-culture measured by Western blot
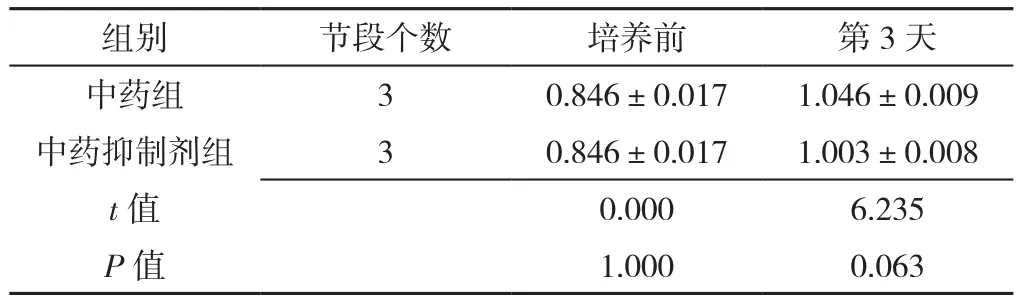
表15 Western blot检测中药组、中药抑制剂组椎间盘终板内Wnt-3α蛋白表达水平比较(±s)Table 15 Comparison of Wnt-3α protein expression levels in intervertebral disc cartilage endplates in herb group and herb inhibition group at baseline and 3 days post-culture measured by Western blot
组别 节段个数 培养前 第3天中药组 3 0.846±0.017 1.046±0.009中药抑制剂组 3 0.846±0.017 1.003±0.008 t值 0.000 6.235 P值 1.000 0.063
2.4.2 β-catenin蛋白表达 Western blot检测β-catenin蛋白表达,见图6、7。中药组及对照组培养第1、3、7、14天时β-catenin蛋白表达水平与培养前比较,差异有统计学意义(P<0.05);中药组培养第1、3、7、14天时β-catenin蛋白表达水平较对照组降低,差异有统计学意义(P<0.05),见表16。中药激动剂组第3天时β-catenin蛋白表达水平与中药组比较,差异无统计学意义(P>0.05),见表17;中药抑制剂组第3天时β-catenin蛋白表达水平较中药组升高,差异有统计学意义(P<0.05),见表18。
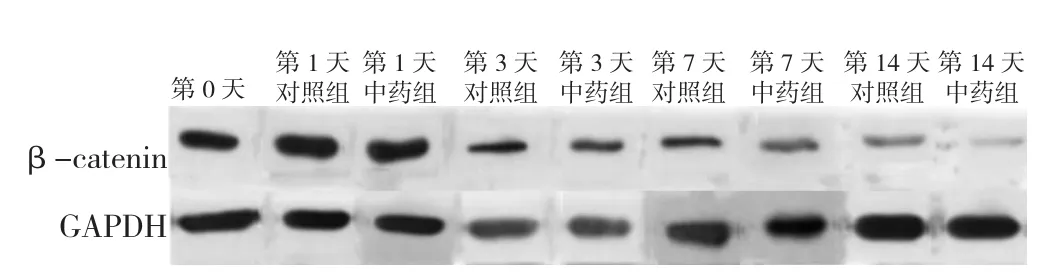
图6 不同时间点对照组与中药组椎间盘终板内β-catenin蛋白表达水平电泳图Figure 6 Electrophoretogram of β-catenin protein expression levels in intervertebral disc cartilage endplates in control group and herb group at baseline and 1,3,7,and 14 days post-culture

图7 中药组、中药激动剂组、中药抑制剂组椎间盘终板内β-catenin蛋白表达水平电泳图Figure 7 Electrophoretogram of β-catenin protein expression levels in intervertebral disc cartilage endplates in herb group, herb activation group and herb inhibition group at baseline and 3 days post-culture
表16 Western blot检测不同时间点对照组与中药组椎间盘终板内β-catenin蛋白表达水平比较(±s)Table 16 Comparison of β-catenin protein expression levels in the endplate between control group and herb group at baseline and 1,3,7,and 14 days post-culture measured by Western blot
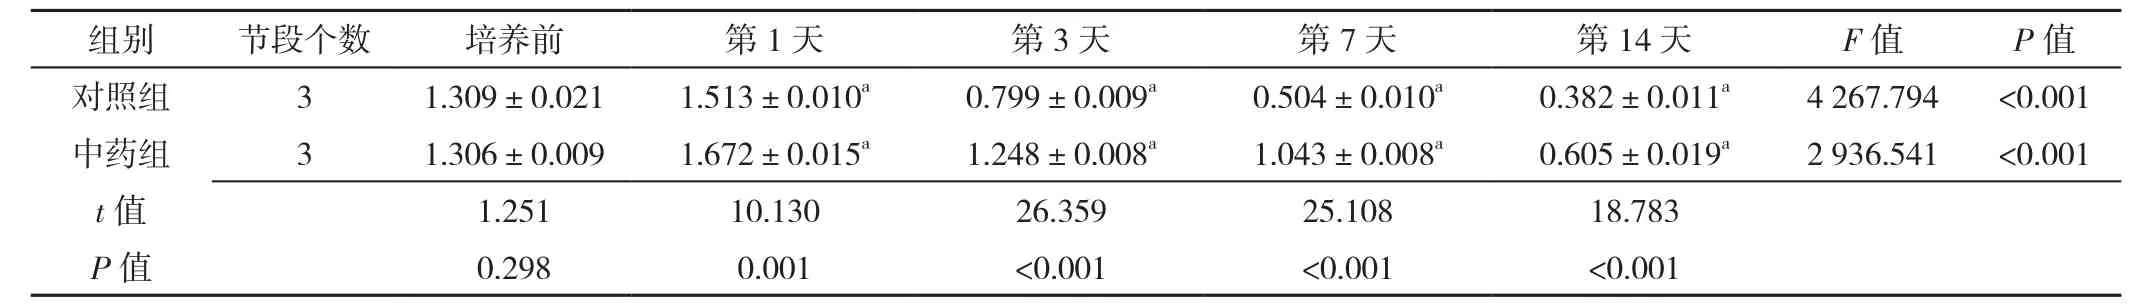
表16 Western blot检测不同时间点对照组与中药组椎间盘终板内β-catenin蛋白表达水平比较(±s)Table 16 Comparison of β-catenin protein expression levels in the endplate between control group and herb group at baseline and 1,3,7,and 14 days post-culture measured by Western blot
注:与培养前比较,aP<0.05
组别 节段个数 培养前 第1天 第3天 第7天 第14天 F值 P值对照组 3 1.309±0.021 1.513±0.010a 0.799±0.009a 0.504±0.010a 0.382±0.011a 4 267.794 <0.001中药组 3 1.306±0.009 1.672±0.015a 1.248±0.008a 1.043±0.008a 0.605±0.019a 2 936.541 <0.001 t值 1.251 10.130 26.359 25.108 18.783 P值 0.298 0.001 <0.001 <0.001 <0.001
表17 Western blot检测中药组、中药激动剂组椎间盘终板内β-catenin蛋白表达水平比较(±s)Table 17 Comparison of β-catenin protein expression levels in intervertebral disc cartilage endplates in herb group and herb activation group at baseline and 3 days post-culture measured by Western blot
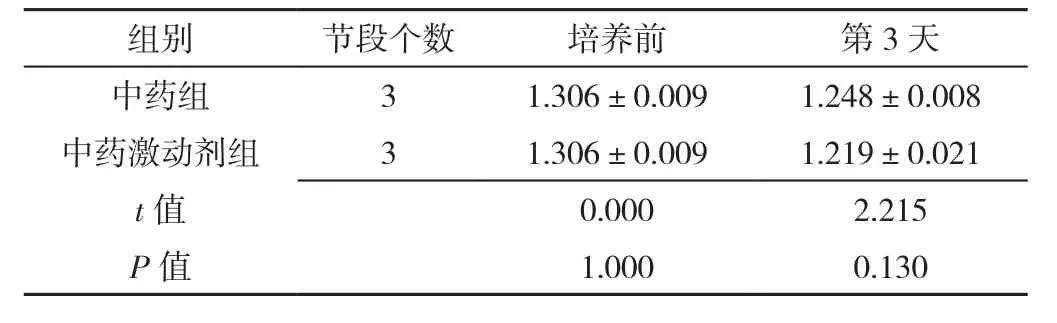
表17 Western blot检测中药组、中药激动剂组椎间盘终板内β-catenin蛋白表达水平比较(±s)Table 17 Comparison of β-catenin protein expression levels in intervertebral disc cartilage endplates in herb group and herb activation group at baseline and 3 days post-culture measured by Western blot
组别 节段个数 培养前 第3天中药组 3 1.306±0.009 1.248±0.008中药激动剂组 3 1.306±0.009 1.219±0.021 t值 0.000 2.215 P值 1.000 0.130
表18 Western blot检测中药组、中药抑制剂组椎间盘终板内β-catenin蛋白表达水平比较(±s)Table 18 Comparison of β-catenin protein expression levels in intervertebral disc cartilage endplates in herb group and herb inhibition group at baseline and 3 days post-culture measured by Western blot
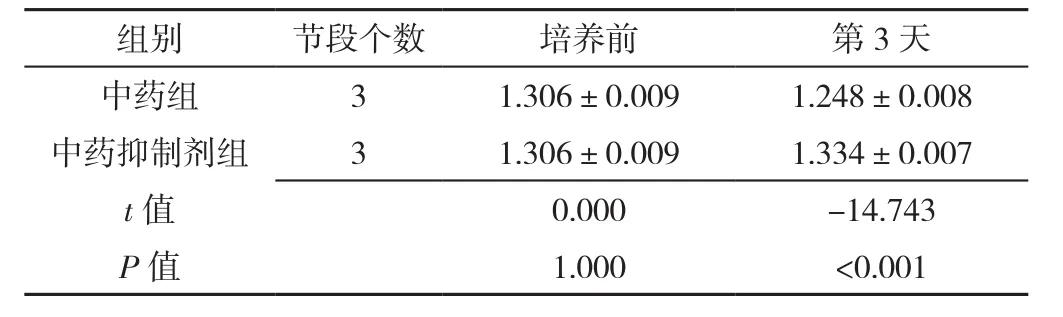
表18 Western blot检测中药组、中药抑制剂组椎间盘终板内β-catenin蛋白表达水平比较(±s)Table 18 Comparison of β-catenin protein expression levels in intervertebral disc cartilage endplates in herb group and herb inhibition group at baseline and 3 days post-culture measured by Western blot
组别 节段个数 培养前 第3天中药组 3 1.306±0.009 1.248±0.008中药抑制剂组 3 1.306±0.009 1.334±0.007 t值 0.000 -14.743 P值 1.000 <0.001
3 讨论
软骨组织是椎间盘终板的主要结构,而软骨细胞又是构成软骨组织的唯一细胞,软骨细胞的结构完整性以及正常的细胞增殖和分化凋亡均与机械刺激密不可分,因为机械刺激可以调控相关基因的表达,调节软骨组织中的重要成分Ⅱ型胶原、蛋白多糖的表达,以及软骨新陈代谢所需酶的分泌[12],当椎间盘长期受到外界异常的负载时,其聚合体会发生崩解,并且其含量减少、成分构成发生改变,这些异常改变是IDD发生的病理基础[11,13-14]。并且相关研究也发现,终板软骨组织中蛋白多糖及Ⅱ型胶原的合成与细胞活性具有线性关系,而软骨细胞活性与营养物质的供应和椎间盘内代谢产物的排出具有密切关系,这一系列因素会最终导致椎间盘退变发生[15]。
依据中医基础理论,椎间盘退行性疾病主要的病因病机为肝肾不足、血瘀气滞,故补肾活血是临床上治疗该类疾病的主要方法。补肾活血中药是在我国古代医书---《太平惠民和剂局方》中青娥丸的基础上,运用辨证论治方法进行加减形成的。该方以杜仲为君药,补骨脂和怀牛膝为臣药,丹参、威灵仙、木瓜为佐使药,共奏补肾健脾以治本、活血通络以治标的功效。
脊柱运动节段模型在维持其自身稳定性方面较离体椎间盘器官模型好[10,16-18],所受外界刺激影响也较离体椎间盘器官模型低,较单独椎间盘器官培养更接近体内环境,因此本实验为使研究更具真实性和可行性,选取了兔的脊柱运动节段作为实验的离体模型。本实验所用的装置是团队自主研发的脊柱运动节段离体培养和加载装置,该装置可以对离体模型进行类似体内环境的培养和力学刺激,所以可以更加直观地研究椎间盘软骨终板对力学刺激的反应,该装置可以在不破坏椎间盘的情况下,使整个椎间盘器官在培养液中进行离体培养,并且可以在其模型上进行力学加载,模拟人体脊柱退行性改变。
通过实验发现,对照组培养第1天时蛋白多糖表达量较培养前显著降低,而中药组蛋白多糖表达量则较对照组降低幅度较小;中药组在培养第1天时Ⅱ型胶原表达量较培养前出现升高,之后又逐渐降低,而对照组则逐渐降低;以上结果提示该方在延缓椎间盘终板软骨组织中蛋白多糖、Ⅱ型胶原等相关蛋白表达量上具有一定作用。RT-PCR检测发现,中药组及对照组中Wnt-3α、β-catenin mRNA表达水平随着时间推移均逐渐降低,但中药组Wnt-3α、β-catenin mRNA表达水平与对照组相比下降更加明显。在Western blot检测时发现,中药组及对照组在培养第1天时Wnt-3α、β-catenin蛋白表达水平均升高,结合前期研究,出现该现象的原因可能与离体培养改变了其生存环境有关,以及该离体培养模型中压力刺激造成的细胞应激反应[19];并且中药组该两种基因表达水平较对照组增加更为明显,提示该方在短期内可以刺激终板软骨细胞合成和分泌相关蛋白,长期可以延缓相关蛋白的减少。在培养1 d后两组基因表达水平随着软骨细胞数量的减少和功能活性的降低而逐渐降低,这与HE染色结果相符。
为了进一步验证补肾活血中药在延缓椎间盘退变中是否与Wnt/β-catenin信号通路有关,本研究设置了中药激动剂组(SB216763)和中药抑制剂组(ICG001)。本研究结果显示,中药激动剂组中的蛋白多糖、Ⅱ型胶原表达量在培养第3天时有少量增加;RT-PCR检测发现,中药激动剂组、中药抑制剂组Wnt-3α mRNA表达水平与中药组间均无统计学差异(P>0.05),而中药激动剂组β-catenin mRNA表达水平较中药组降低(P<0.05),中药抑制剂组β-catenin mRNA表达水平较中药组升高(P<0.05);Western blot检测发现,中药激动剂组、中药抑制剂组Wnt-3α蛋白表达水平分别与中药组比较,差异无统计学意义(P>0.05),而中药抑制剂组β-catenin蛋白表达水平较中药组升高(P<0.05),中药激动剂组β-catenin蛋白表达水平与中药组间无统计学差异(P>0.05)。这一结果进一步说明了补肾活血中药可以通过调节Wnt/β-catenin信号通路上的相关蛋白来调控终板软骨细胞的表达,干预终板软骨组织退变,从而延缓椎间盘退变进程。本研究是利用离体培养模型进行实验研究,其中如缺氧环境及局部血液循环障碍等因素使本实验存在一定局限性和不足,在体实验的设计是完善研究和验证实验结果的下一步重要方向。
作者贡献:韩涛、尹逊路负责实验动物的造模、取材与培养,数据分析,论文撰写与修改;展嘉文、李学朋、陈明负责观察指标测定、数据整理;魏戌、冯敏山、于杰负责研究的设计与可行性分析;朱立国对文章进行审核,监督管理。
本文无利益冲突。