The marine environmental evolution in the northern Norwegian Sea revealed by foraminifera during the last 60 ka
2021-11-12WANGWeiguoZHAOMengweiYANGJichaoXIAOWenshenWANGHaoyinLIUYang
WANG Weiguo, ZHAO Mengwei, YANG Jichao, XIAO Wenshen,WANG Haoyin &LIU Yang
The marine environmental evolution in the northern Norwegian Sea revealed by foraminifera during the last 60 ka
WANG Weiguo1, ZHAO Mengwei2*, YANG Jichao3, XIAO Wenshen4,WANG Haoyin5&LIU Yang6
1Third Institute of Oceanography, Ministry of Natural Resources, P.R.C., Xiamen 361005, China;2Pilot National Laboratory for Marine Science and Technology, Qingdao 266237, China;3Shandong University of Science and Technology, Qingdao 266590, China;4State Key Laboratory of Marine Geology, Tongji University, Shanghai 200092, China;5School of Marine Science and Technology, Hainan Tropical Ocean University, Sanya 572000, China;6School of Earth Sciences, Lanzhou University, Lanzhou 730000, China
Both planktonic and benthic foraminifera were identified in a sediment core collected from the northern Norwegian Sea to reconstruct the paleoceanographic evolution since the last glaciation. The assemblages and distribution patterns of dominant foraminiferal species with special habitat preferences indicated that three marine environments occurred in the northern Norwegian Sea since 62 ka BP: (1) an environment controlled by the circulation of the North Atlantic Current (NAC); (2) by polynya-related sinking of brines and upwelling of intermediate water surrounding the polynya; (3) by melt-water from Barents Sea Ice Sheet (BSIS). At 62–52.5 ka BP, a period with the highest summer insolation during the last glaciatial period, intensification of the NAC led to higher absolute abundances and higher diversity of foraminiferal faunas. The higher abundance of benthic speciesindicates bottom water conditions that were well-ventilated with an adequate food supply; however, higher abundances of polar planktonic foraminiferal species(sin.) indicate that the near-surface temperatures were still low. During mid-late Marine Isotope Stage (MIS) 3 (52.5–29 ka BP), the marine environment of the northern Norwegian Sea alternately changed among the above mentioned three environments. At 29–17 ka BP during the last glacial maximum, the dominant benthic speciesfrom the Arctic Ocean indicates an extreme cold bottom environment. The BSIS expanded to its maximum extent during this period, and vast polynya formed at the edge of the ice sheet. The sinking of brines from the formation of sea ice in the polynyas caused upwelling, indicated by the upwelling adapted planktonic species. At 17–10 ka BP, the northern Norwegian Sea was controlled by melt-water. With the ablation of BSIS, massive amounts of melt water discharged into the Norwegian Sea, resulting in strong water column stratification, poor ventilation, and an oligotrophic bottom condition, which led to a drastic decline in the abundance and diversity of foraminifera. At 10–0 ka BP, the marine environment was transformed again by the control of the NAC, which continues to modern day. The abrupt decrease in relative abundance of(sin.) indicates a rise in near-surface temperature with the strengthening of the NAC and without the influence of the BSIS.
Norwegian Sea, foraminifera, North Atlantic Current, Barents Sea Ice Sheet, marine environments, last glaciation
1 Introduction
The Nordic Seas (Greenland, Iceland, and Norwegian seas) plays an important role in global climate change (Broeker, 1991; Rasmussen and Thomsen, 2004; Muschitiello et al., 2019). After the warm North Atlantic Current (NAC) enters the Norwegian Sea, part of it sinks to initiate the Atlantic Meridional Overturning Circulation (AMOC) and flows southward into the Atlantic Ocean as deep water, and the rest of it flows northward to the Arctic Ocean (Hansen and Østerhus, 2000; Latarius and Quadfasel, 2016). The evolution of the marine environment in the Nordic Seas directly affects the amount of inflowing warm NAC and its position in the water column (Ezat et al., 2014; Rasmussen et al., 2016), and subsequently changes in degree of ice-cover in the region and climate over land in northwestern Europe (Broeker, 1991; Wang et al., 2020). Therefore, research on the paleoceanographic evolution of the Nordic Seas will provide deeper insights into the mechanisms of global and regional climate change.
To date, much research about paleoceanographic evolution in the Norwegian Sea has been published based on sediment cores collected from the north slope of the Greenland-Scotland Ridge in the southern Norwegian Sea, and from the Vøring Plateau in the south-eastern Norwegian Sea. These sediment cores record past changes in sea-ice cover, seawater temperature, NAC, ventilation, etc. (Bauch et al., 2001; Elliot et al., 2001; Meland et al., 2008; Rasmussen and Thomsen, 2008, 2009; Simstich et al., 2013; Ezat et al., 2014, 2017; Sadatzki et al., 2019). The Lofoten Basin, located in the northern Norwegian Sea, is the deepest and broadest reservoir of the warm NAC inflow to the Nordic Seas (Raj and Halo, 2016). During the last glacial maximum, the Barents Sea Ice Sheet (BSIS) extended to the Barents Sea shelf edge (Hughes et al., 2016), and massive icebergs and melt-water were discharged into the Norwegian Sea (Pope et al., 2016), which weakened the inflow of the NAC and made the NAC dip underneath the cold and fresher melt-water layer (Ezat et al., 2014; Rasmussen et al., 2016). Therefore, the northern Norwegian Sea provides an ideal site for studying the interaction between NAC and BSIS. Few studies have been conducted in the northern Norwegian Sea, and the existing studies only involve sediment cores collected at shallow water depths, or span a period less than 30 ka BP (Telesiński et al., 2015; Knies et al., 2018; Struve et al., 2019). Records that fully reveal the paleoceanographic evolution of the northern Norwegian Sea during the last glaciation are lacking.
Foraminifera can be used as indicators of the marine environment. Planktonic and benthic foraminifera are sensitive to changes in the marine environment of the Nordic Seas (Husum and Hald, 2012; Rasmussen and Thomsen, 2017). In this study, foraminiferal faunas were investigated in a sediment core collected from the Lofoten Basin in the northern Norwegian Sea. Based on accelerator mass spectrometry (AMS)14C dating, the paleoceanographic changes in the northern Norwegian Sea during the last 60 ka were reconstructed using the changes of abundance of dominant foraminiferal species and their species-specific environmental adaptations.
2 Regional marine background
The Nordic Seas are located between Svalbard, Greenland, Iceland, and Scandinavia, bordering the North Atlantic Ocean by the Greenland-Scotland Ridge in the south, and connect the Arctic Ocean via the Fram Strait in the north (Figure 1) (Drange et al., 2005). Submarine ridges divide the Nordic Seas into the Greenland Sea, the Iceland Sea, and the Norwegian Sea (Figure 1). In particular, the Norwegian Sea connects to the Barents Sea to the east. In the central Norwegian Sea, the Jan Mayen Fault Zone and the Vøring Plateau divide the Norwegian Sea into the Lofoten Basin in the north and the Norwegian Basin in the south (Gernigon et al., 2012), with the former having a maximum depth of 3250 m.
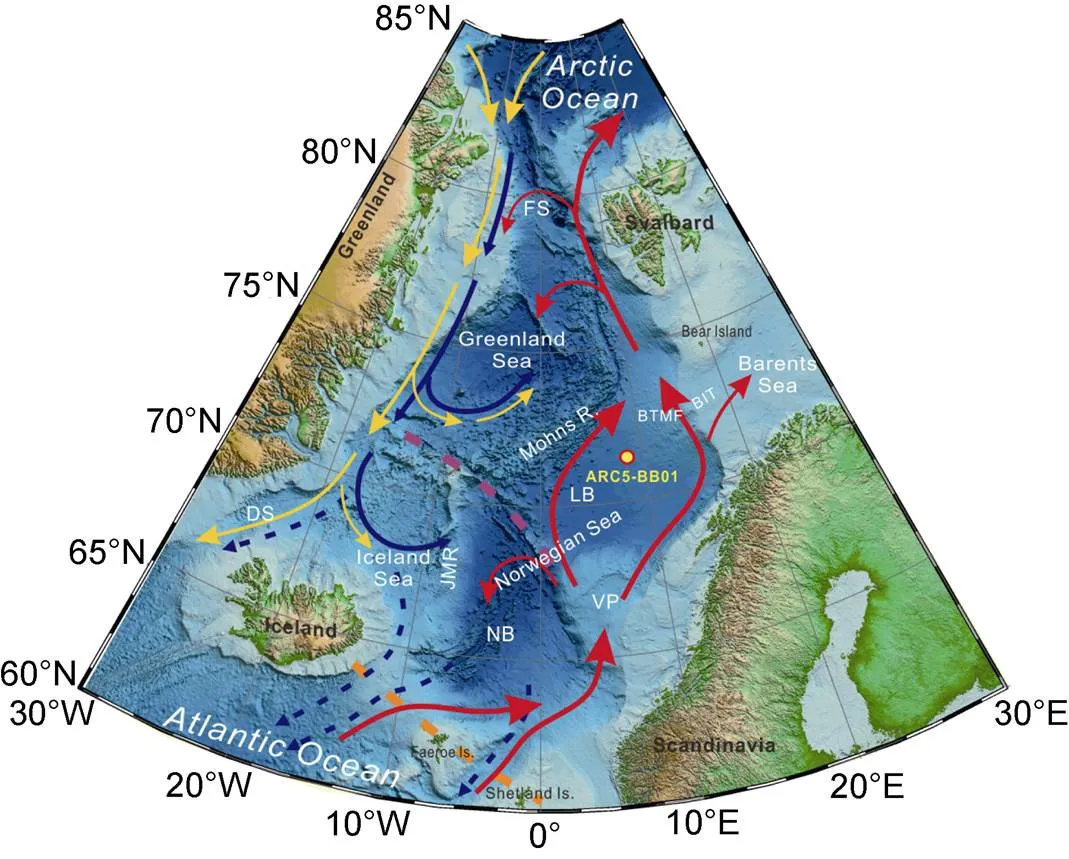
Figure 1 Oceanographic setting and location of core ARC5-BB01 (Red solid arrow – Norwegian Atlantic current; yellow and blue solid arrow – surface and bottom East Greenland current, respectively; blue dashed arrow – Nordic Seas overflow; purple dashed line – Jan Mayen Fracture Zone; orange dashed line – Greenland-Scotland Ridge; BIT – Bear Island Trough;BTMF – Bear Island Trough Mouth Fan; DS – Denmark Strait; FS – Fram Strait; JMR – Jan Mayen Ridge; LB – Lofoten Basin; NB – Norwegian Basin; VP – Vøring Plateau).
The surface circulation in the Nordic Seas is primarily controlled by the warm and saline NAC to the east and the cold and fresh East Greenland Current (EGC) to the west, resulted in higher sea surface temperatures in the east and lower in the west (Eldevik et al., 2009). The inflow of the NAC to the Norwegian Sea splits into two branches by the Faroe Islands, flowing northward and passing through the Fram Strait and Barents Sea to the Arctic Ocean (Aksenov et al., 2010) (Figure 1). Cold and low-salinity polar water enters the Greenland Sea through the western side of the Fram Strait, merges with the recirculating Atlantic Water, and flows southward along the eastern margin of Greenland Sea shelf carried by the EGC, and finally flows out through the Denmark Strait into the North Atlantic Ocean. Gyres are formed between the NAC and the EGC due to temperature differences, seafloor topographies, and sea surface wind fields (Rasmussen et al., 2014; Latarius and Quadfasel, 2016). With the heat release from the warm NAC, mixing of the cold and warm water masses due to the gyres, the NAC is densified and sinks, which initiates the AMOC and strengthens the ventilation (Gascard et al., 2002; Eldevik et al., 2009; Latarius and Quadfasel, 2016). The sinking seawater mainly overflows the Greenland-Scotland Ridge and becomes an important component of the North Atlantic Deep Water (NADW) (Hansen and Østerhus, 2000; Eldevik et al., 2009; Raj and Halo, 2016).
Nowadays, due to the influence of the warm NAC, there is no sea ice in the Norwegian Sea in winter. However, during the last glacial, the ocean scenario was completely different from today. The east and west sides of the Nordic Seas were covered by the Greenland Ice Sheet and the Barents-Scandinavian Ice Sheet respectively, the two largest ice sheet in the northern hemisphere, with multiple channels for melt water and discharge of icebergs (Lekens et al., 2006). In addition, the evolution of these two ice sheets was asynchronous (Dokken et al., 2013). In the Last Glacial Maximum (LGM), the BSIS on the eastern side of the Norwegian Sea extended to the edge of the Barents Shelf (Elverhøi et al., 1995; Spielhagen et al., 2004; Hughes et al., 2016; Patton et al., 2017). Affected by melt water, the NAC weakened and sank underneath the cold, fresher polar water to form an intermediate water layer during cold stadial events during the last glaciation (Ezat et al., 2014), and convection and seafloor ventilation weakened in the Norwegian Sea as well. The area of sea-ice cover in the Norwegian Sea changes with millennial-scale climate change (Hoff et al., 2016).
The icebergs and melt-water from the BSIS was mainly discharged into the northern Norwegian Sea. A ~100-km-long trough known as the Bear Island Trough (BIT) was eroded by an ice stream on the Barents Shelf south of Bear Island as the BSIS was moving towards the Norwegian Sea, and fan-shaped, glacial debris-flow deposits formed at the end of the ice stream (Figure 1). These deposits are now known as the Bear Island Trough Mouth Fan (BTMF). The lobe of the glacial debris fan extended southwestward from the upper continental slope to a water depth of 2600 m, covering a total area of 28×104km2(Andreassen et al., 2008).
3 Materials and methods
Sediment core ARC5-BB01 (hereinafter BB01) was collected using a gravity core sampler onboard icebreaker R/V(also known as Snow Dragon), in the northern Norwegian Sea (71°45.81′N, 8°56.94′E, 2613 m water depth) (Figure 1) during the 5th Chinese National Arctic Research Expedition (CHINARE) in 2012. The core was 4.25 m in length, and the sampling site located at the edge of the BTMF. A total of 86 samples at 5-cm intervals with 1-cm-thick samples were taken for foraminiferal counts and identification. The samples were processed as follows: (1) About 1 g of dry sediment was soaked with distilled water, followed by the addition of a small volume of hydrogen peroxide solution to remove organic matter. (2) After the reaction was complete and the sample was disintegrated, it was wet sieved through a 63-μm mesh, followed by oven drying. (3) Using a binocular stereo microscope (NIKON SMZ1500, Japan), the foraminifera in the sieved residue were counted and identified to species level. At least 300 specimens were identified and counted in each sample when possible. Abundances (individuals of foraminifera in per gram dry weight (dwt) of sediments) of planktonic and benthic foraminifera, simple diversity index (number of species in a sample), and the percentage of hyaline, porcelaineous, and agglutinated shells were calculated.
Principal components analysis (PCA) and cluster analysis were performed using PAST 3 software to identify the possible groups of species (Hammer et al., 2001). In order to simplify the matrix, only 12 species with abundance greater than 5% in at least 5 samples were selected for the statistical analysis to avoid noise introduced by rare species.
Accelerator mass spectrometry (AMS)14C datings were performed on monospecific samples of the planktonic foraminiferal species(sin.) from nine samples at Beta Analytic Inc. (USA) (Table 1). The dating results were calibrated using the Marine20 database and Calib 8.1 software, and the local carbon reservoir correction (Δ) 66 ± 25 was applied (Heaton et al., 2020).
In order to provide additional age constraints, magnetic susceptibility (MS) was measured at 2-cm intervals, and the MS variations were correlated to the Greenland ice-core (GISP2) oxygen isotope record. The samples for MS measurement were freeze-dried and then dispersed with an agate mortar. Portions of 7 to 10 g of the dry samples were packed into 8-cm3non-magnetic plastic cubes for MS measurement at 976 Hz with a MFK1-FA Kappabridge susceptibility meter. The MS was expressed on a mass-specific basis in m3·kg−1.
4 Results
4.1 Age model
Table 1 presents the AMS14C dating results for samples of core BB01. The14C age at 400 cm exceeds the working range for radiocarbon measurement. For 8 samples above 350 cm,14C ages increase with depth, and there is no age inversion. The preliminary age-depth model for core BB01 was generated by using the free software Bacon (Figures 2a–2d), which is an approach for developing an age–depth model by using Bayesian statistics to reconstruct Bayesian accumulation histories for sedimentary deposits (Blaauw and Christen, 2011).
The plot of MS versus age according to this preliminary age model shows that the change of MS is almost in-phase with the GISP2 δ18O record after 35 ka BP. However, before 35 ka BP, with the increasing uncertainty of the14C age, there is an age offset between the MS and GISP2 δ18O record (Figure 2e). Previous works demonstrate that the MS in sediment of Norwegian Seais synchronous with the Greenland ice-core oxygen isotope records (Rasmussen et al.,1996; Dowdeswell et al., 1999; Kissel et al., 1999; Elliot et al., 2001; Rasmussen and Thomsen, 2009). Therefore, the age of sediments in core BB01 was further constrained with the GISP2 δ18O record using the AnalySeries software (Paillard et al., 1996) (Figures 2f, 2g). The results showed that the bottom of core BB01 dates at 62 ka BP, and that the core spans Marine Isotope Stage (MIS) 1−4.
4.2 Foraminiferal distribution patterns
The total absolute abundance of foraminifera in the core BB01 ranges from 2 to 18590 individuals per gram dwt of sediment (indiv.·g−1) with a mean of 1876 indiv.·g−1(Figure 3a). At 62–9 ka BP, the abundance of foraminifera shows a general decreasing trend up the core, but the abundance is extremely low in two sediment layers. One of these layers at 52.5–51 ka BP, the foraminiferal abundance reaches a nadir, less than 8 indiv.·g−1. The other layer at 19–9 ka BP, the foraminiferal abundance is on average of 130 indiv.·g−1. The foraminiferal abundance increases again after 9 ka BP, averaging as high as 1928 indiv.·g−1. The variations of planktonic foraminiferal abundance follow the total abundance as core BB01 generally is dominated by planktonic foraminifera (Figure 3b). The abundance of benthic foraminifera at 62–19 ka BP decreases upwards and shows a similar trend to that of the planktonic foraminifera (Figure 3c). At 19–9 ka BP, however, the benthic abundance increases upwardly, and is counterbalanced by a decrease in planktonic foraminifera. The proportion of benthic foraminifera in all foraminifera increases significantly at this period (Figure 3d).
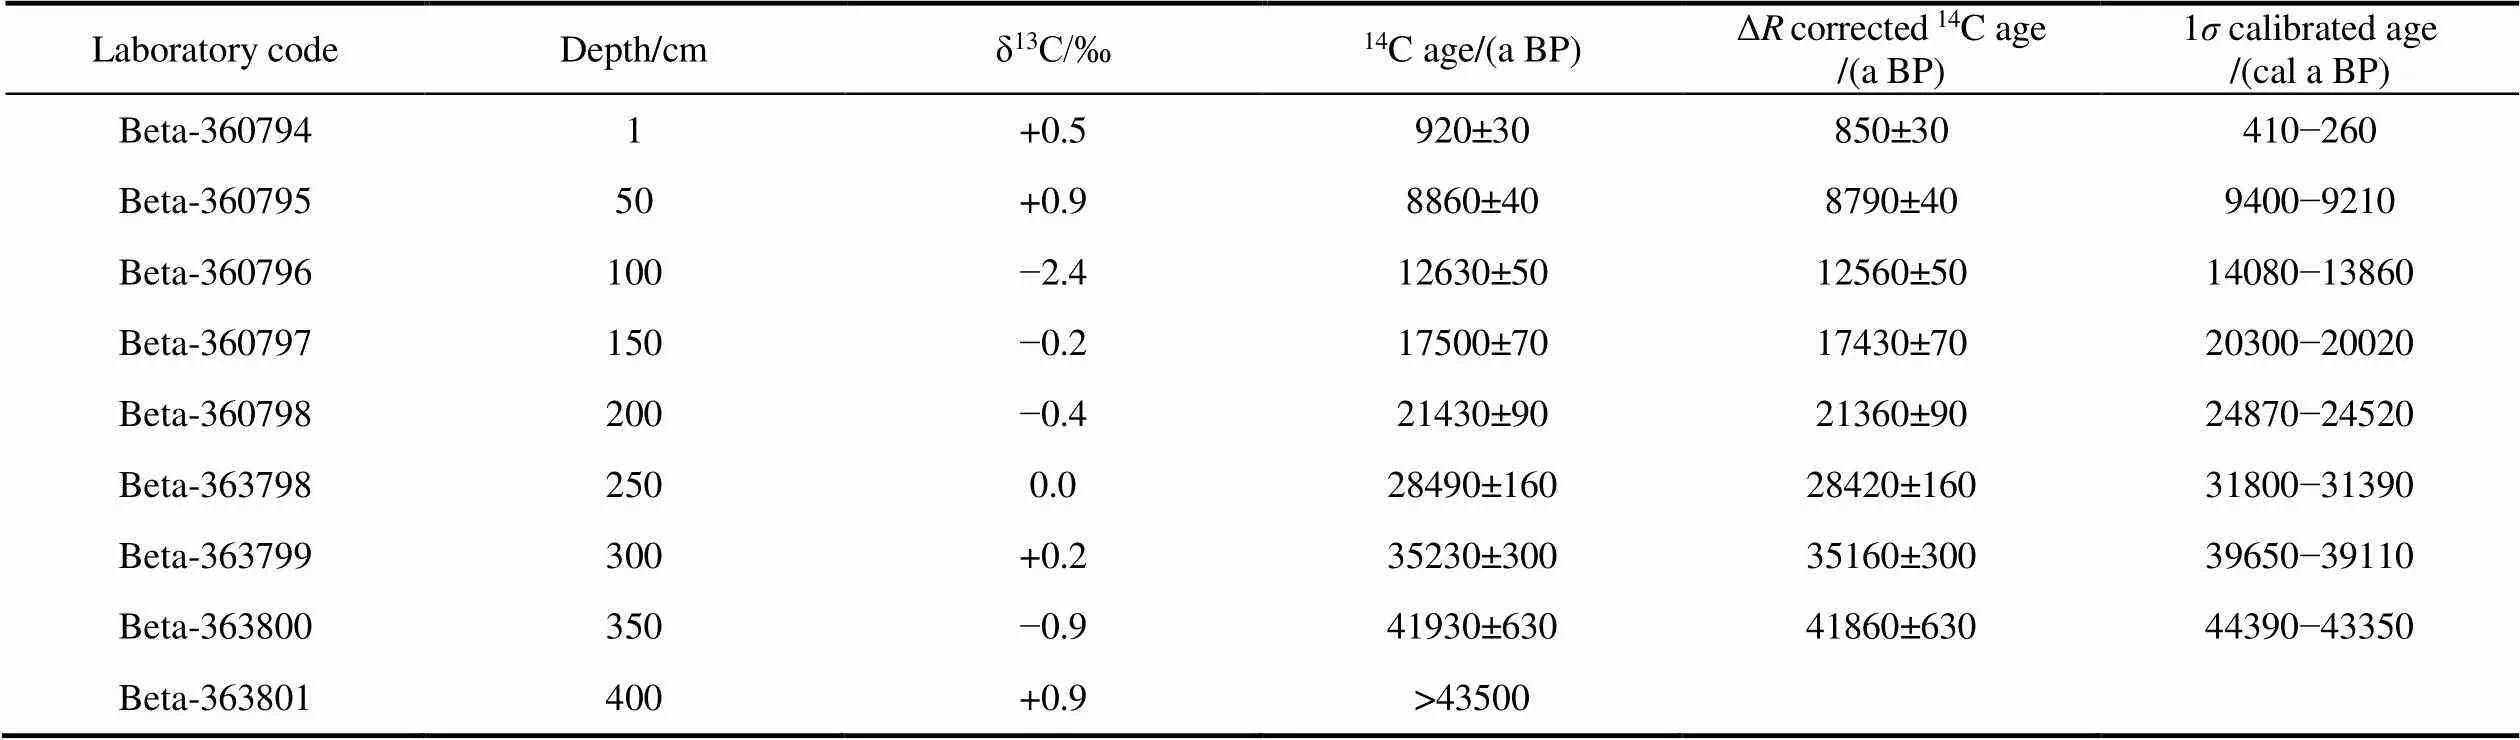
Table 1 AMS 14C dating results and calibrated dates for BB01 core

Figure 2 Age-depth model for core BB01. a, Markov chain Monte Carlo (MCMC) iterations; b, the initial (green curves) and final (grey histograms) distributions for the sedimentation rate; c, the initial (green curves) and final (grey histograms) distributions for memory; d, calibrated14C dates (transparent blue) and the preliminary age–depth model (grey stippled lines indicate the 95% confidence intervals; red curve shows the “best” fit based on the weighted mean age for each depth); e, magnetic susceptibility versus age according to the age model of d; f, magnetic susceptibility versus age further constrained with the δ18O of the Greenland Ice Core (GISP2) record; g, δ18O of GISP2 versus age.
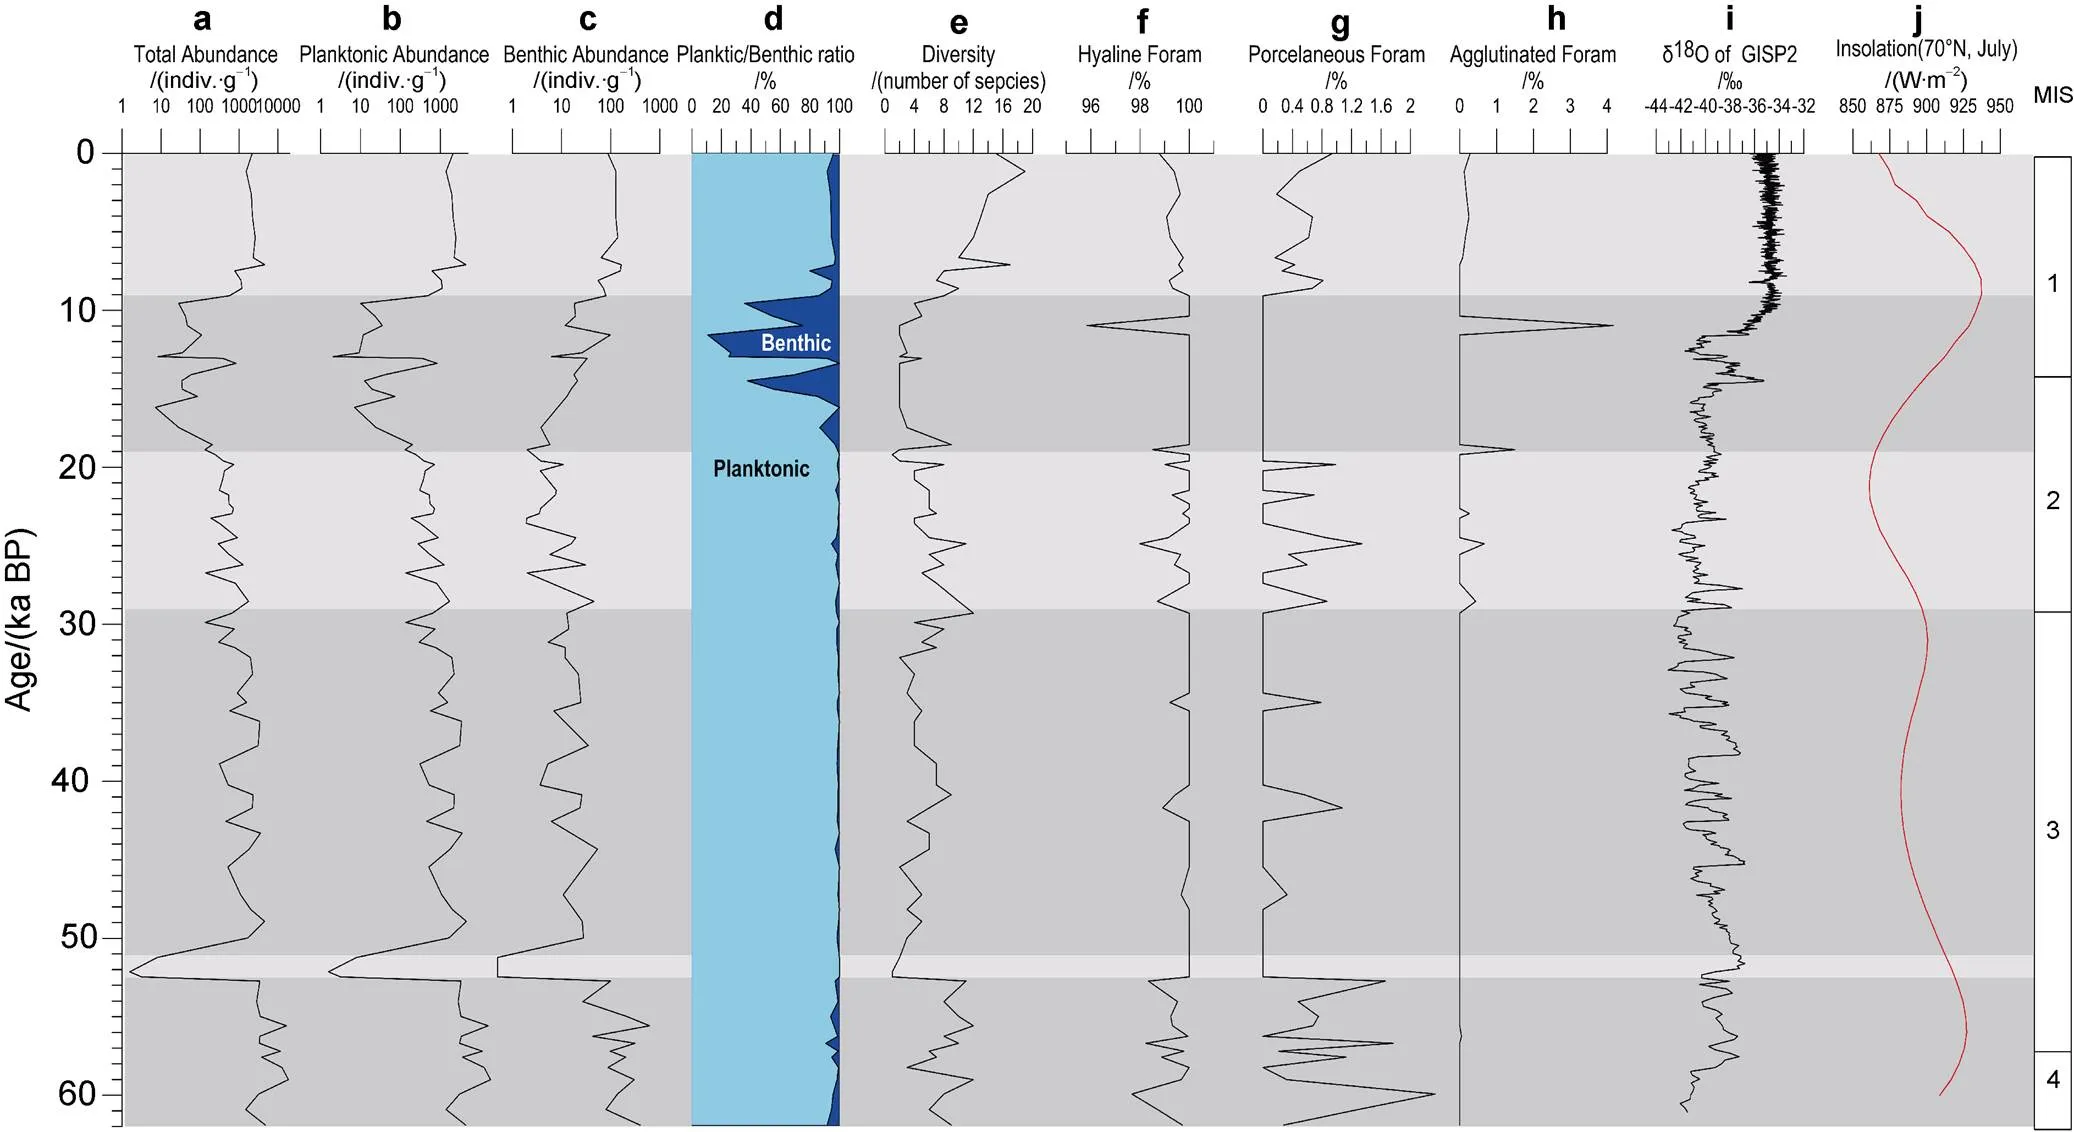
Figure 3 Down-core records of statistical parameters of foraminifera in core BB01.
A total of 60 species in 33 genera of foraminifera were identified in core BB01. Among them, planktonic foraminiferal faunas are relatively less diverse, with only 6 genera and 17 species, all of which are typical polar and subpolar species. The benthic species are more diverse, although the abundance of benthic foraminifera in core BB01 is lower, and a total of 43 species in 27 genera were identified. The simple diversity index (the number of foraminiferal species by sample) ranges from 1 to 19 (Figure 3e). In particular, the diversity of foraminifera at 62–52.5 ka BP is 9 on average; at 52.5–51 ka BP, the diversity sharply drops to 1 or 2 foraminiferal species; the diversity at 50–17 ka BP increases to a mean of 6; at 17– 9 ka BP, the simple diversity decreases to a mean of 3; foraminifera at 9–0 ka BP has the largest diversity with a mean of 12.
In terms of the type of foraminifera shells, hyaline foraminifera are by far the most dominant of the benthic foraminifera in core BB01, ranging between 95%–100% of the total foraminiferal assemblage with a mean composition of 99.6% (Figure 3f), followed by porcelaineous foraminifera at 0 to 2.3% and a mean of 0.3% (Figure 3g). There is a relatively high proportion of porcelaineous foraminifera at 62–52.5 ka BP, 29–19 ka BP, and 9–0 ka BP. The proportion of agglutinated foraminifera ranges from 0–4.2%, with a mean of 0.1% (Figure 3h). Agglutinated foraminifera are only present in the sediment layers formed after 30 ka BP (Figure 3h).
For planktonic foraminiferal species,, a representative polar species and with high resistance to dissolution, is the overall dominant species in core BB01, accounting for at least 50% of the planktonic foraminifera species and a mean proportion as high as 92% (Figure 4a).is dominated by sinistral (left) coiling shells, with dextral (right) coiling shells only beginning to increase since 10 ka BP (Figure 4b). Other common planktonic foraminiferal species are:,, and,(Figures4c–4g). The benthic foraminiferal species that occurred more frequently are,,,, and(Figures 4h–4l).
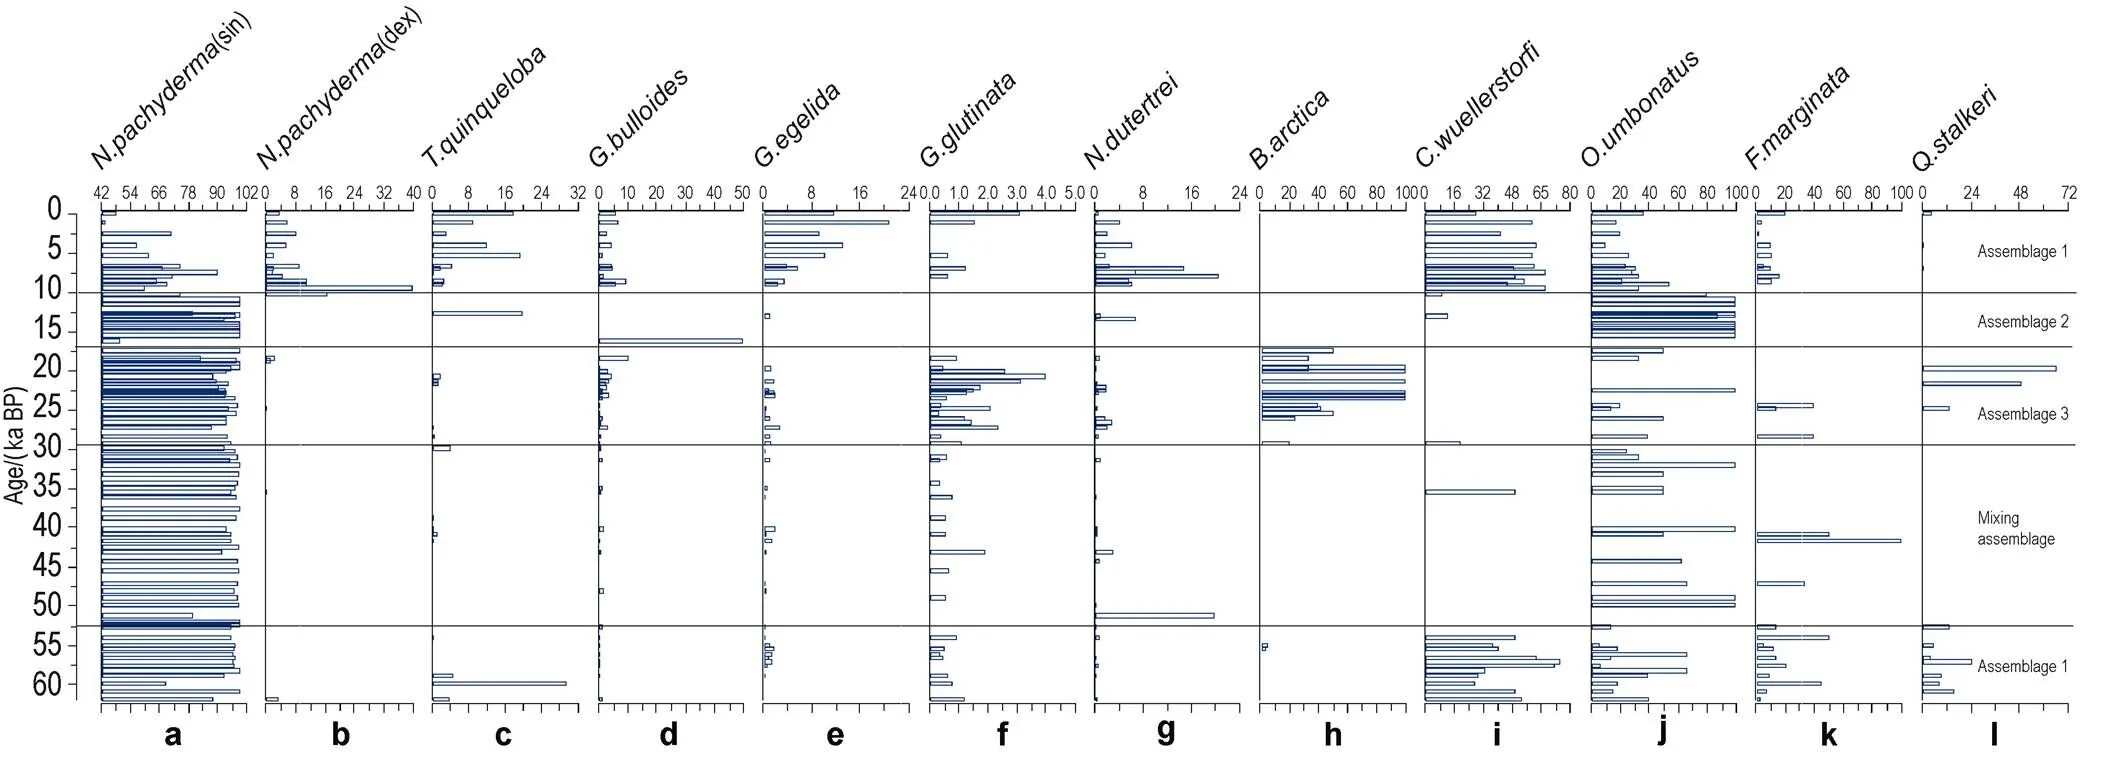
Figure 4 Percentage records of dominant planktonic and benthic foraminifera in core BB01.
4.3 PCA and cluster analysis
The results of PCA indicate that the 3 leading principal components accounted for 43.9%, 25.65% and 13.6% of the total data variance, respectively. According to the scores of each species for principal components, three benthic species are the dominant contributors to the 3 principal components. Specifically,is strongly correlated with the 1st component;is positively correlated with the 2nd component; andis negatively correlated with the 2nd component and positively correlated with the 3rd component (Figure 5). Other species, such as(sin.) and.have impact on the components, but they are less important than the above mentioned.-mode cluster analysis shows three species assemblages(Figure 6). Based on these three assemblages, cluster analysis by-means method shows that the Samples in core BB01 could be divided into 4 clusters (Figure 4). Samples at 65–52.5 ka BP and 10–0 ka BP belong to cluster 1, samples at 17–10 ka BP belong to cluster 2, samples at 29–17 ka BP belong to cluster 3, and samples at 52.5–29 ka BP alternated between cluster 2 and cluster 3.
5 Discussion
5.1 Foraminiferal assemblages and paleo- ceanographic environments
The results of the PCA and Cluster Analysis indicate that the changes in the distribution patterns of the foraminifera in core BB01 are mainly controlled by three factors which are correlated to three foraminiferal species. According to the statistical results and the distribution patterns of the dominant species in core BB01, three foraminiferal assemblages were identified and named by the representative species. Three benthic species,,., and.belong to the three assemblages and three paleoceanographic environments, as discussed below.
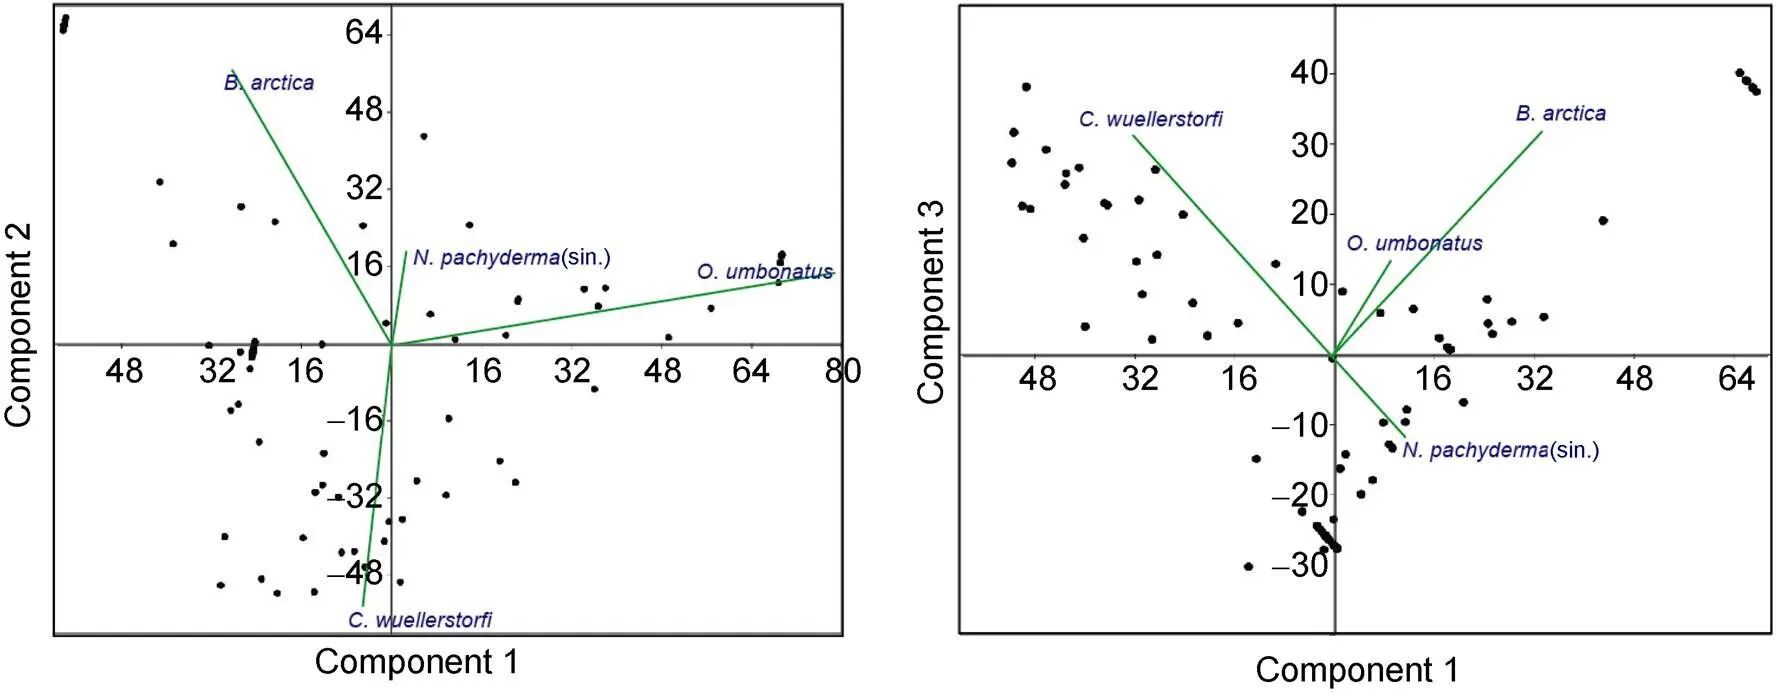
Figure 5 Principal Components Analysis performed on the relative abundance (in percent) of dominant planktonic and benthic foraminiferal species from core BB01.
Figure 6-Mode cluster analysis performed on the relative abundance (in percent) of dominant planktonic and benthic foraminiferal species from core BB01.
5.1.1 Assemblage 1:.–.
The relative abundance of the benthic species.and.are significantly and consistently higher during 62–52.5 ka BP and 10–0 ka BP, respectively.During other time intervals, however, the two species occur sporadically..thrives in high-salinity, oxygen-rich, and strong bottom current influenced seafloor environments with abundant food supply (Sejrup et al., 1981; Mackensen et al., 1985; Haake and Pflaumann, 1989; Bauch et al., 2001). Moreover, the absolute abundance and diversity of foraminifera during those two periods are higher than that during other periods, confirming that the.–.assemblage indicates a marine environment with high productivity, strong AMOC, and ventilation.
5.1.2 Assemblage 2:.–.
Theabundances of benthic species.and planktonic species.are consistently higher at 17–10 ka BP. Other benthic and planktonic species are scarce during this period. The abundance and diversity of foraminifera reach its minimum during this period..is attracted to areas with extensive ice cover, cold bottom water, low food supply and oligotrophic conditions, and is exclusively confined to sediments rich in ice rafted detritus (Rasmussen et al., 2007; Rasmussen and Thomsen, 2017). The higher abundance ofindicated lower temperature in the upper-water column where.lives. Massive melt water was discharged into the Norwegian Sea during the last deglaciation with the ablation of BSIS. The fresher melt water covered the near-surface and intensified the water column stratification, which reduced the ventilation and food supply and lead to a deteriorated environment excluding many other foraminiferal species.
5.1.3 Assemblage 3:–assemblage
frequently appears and is the dominant benthic species during 29–17 ka BP. However, it is almost absent in other periods. At the same time, the planktonic species.appears more frequently and its abundance is significantly higher than that in other periods. In addition, the relative abundance of porcelaineous foraminifera is also relatively high at 29–17 ka BP (Figure 3g)..is an endemic species in the Arctic Ocean (Hull et al., 1996; Scott et al., 2008), and.prefers upwelling environments (Hilbrecht, 1996). The porcelaineous foraminifera mainly occur in environments with abnormal salinity (Thunell et al., 1994). The higher abundance of.andin the Norwegian Sea during the last glacial maximum indicate an extreme cold environment with polynya and upwelling. The BSIS to the east of the Norwegian Sea expanded to a maximum at 29 ka BP (Clark et al., 2009), reaching to the shelf edge of the Barents Sea (Elverhøi et al., 1995; Spielhagen et al., 2004; Hughes et al., 2016; Patton et al., 2017). Vast polynya formed at the edge of the ice sheet (Bauch et al., 2001; Knies et al., 2018). Sea ice formation in the polynya caused an increase in salinity, with cold and high-salinity seawater sinking to the seafloor and in turn increasing the seafloor salinity. As a result of brine sinking in the polynya, upwelling occurred in the intermediate-seawater layer in the sea surrounding the polynya (Knies et al., 2018).
5.2 Paleoceanographic evolution in the northern Norwegian Sea
5.2.1 62–52.5 ka BP
The.–.assemblage at 62– 52.5 ka BP indicates a bottom environment with high-salinity, oxygen-rich bottom water, and strong currents. Although the period of 62–52.5 ka BP was in the last glaciation, the summer insolation during this period was the highest (Figure 3j) and this period was the warmest period during the Weicheselian glaciation. The ameliorated conditions correlated with a strengthening in the flow of NAC into the Norwegian Sea and AMOC. The stronger AMOC increased the ventilation, bottom salinity and currents, which is favorable for benthic foraminifera leading to the significant increase in its abundance and diversity. However, the planktonic foraminifera were dominated by, and the abundance of subpolar planktonic species such as.,.,and.was lower or scarce, indicating that the temperature of near surface sea water is still low.
5.2.2 52.5–29 ka BP
The planktonic foraminiferal fauna continued to be dominated byat 52.5–29 ka BP, indicating lower surface temperatures. Subpolar planktonic species, such as..and.and.occurred intermittently, although in low abundance, indicating the NAC was periodically enhanced on a small scale. In addition, the periodic appearance of benthic species such as.indicates intermittent stadial environmental conditions with water column stratification, weaker ventilation, and oligotrophic seafloor conditions (Rasmussen et al., 2007; Rasmussen and Thomsen, 2017). The presence ofduring this period also indicates that upwelling happened periodically in the northern Norwegian Sea (Hilbrecht, 1996). The period of 52.5–29 ka BP is in the mid-late marine isotopic stage 3 (MIS 3), the northern Norwegian Sea was undergoing the rapid alternation between stadial and interstadial periods, similar to the rapid atmospheric climate changes over the Greenland ice sheet at the same time (Dansgaard et al., 1993). The marine environment was controlled by a weak NAC, melt water and upwelling.
5.2.3 29–17 ka BP
The foraminiferal faunas are characterized by the.–.assemblage during 29–17 ka BP. The occurrence of the benthic species.indicates an extremely cold environment during this period, and the appearance of planktonic.indicates an upwelling environment. In addition, the higher abundance of porcelaineous foraminifera indicates a high salinity bottom environment. At 29 ka BP, the BSIS expanded to the edge of the shelf (Elverhøi et al., 1995; Spielhagen et al., 2004; Hughes et al., 2016; Patton et al., 2017), and an open water corridor in front of BSIS formed (polynya) (Knies et al., 2018). The site of core BB01 is located close to the former front of the BSIS, and located at the end of a glacial debris-flow fan. Sea ice formed in the polynya and moved away due to the katabatic winds blowing offshore, resulting in the increase of salinity. The saline water formed in the polynya descended along the fan surface due to gravity, affecting the seafloor environment where the core BB01 is located. As a result of sinking saline water in the polynya, upwelling occurred in the seawater intermediate-layer surrounding the polynya (Knies et al., 2018).
5.2.4 17–10 ka BP
The foraminiferal assemblage is dominated by the.–.assemblage during 17–10 ka BP.is the overwhelming dominant benthic species during this period, indicating an extreme environment controlled by melt water. The retreat of BSIS started at 19.5 ka BP and the polynya environment stopped finally at ~17 ka BP (Knies et al., 2018). Massive melt water was discharged into the northern Norwegian Sea along with the ablation of BSIS, which strengthened the stratification of the upper water column, reduced the ventilation and food supply to the sea floor. The temperature of the near-surface water was lower as indicated by the dominance of the planktonic species.(sin.)the cooling was probably a result of the massive discharge of cold melt water.Although the BSIS had retreated by 13 ka BP (Hormes et al., 2013; Telesiński et al., 2015), the melt water from Svalbard and Franz Josef Land maintained the extreme conditions for benthic fauna until 10 ka BP (Patton et al., 2017).
5.2.5 10–0 ka BP
Without the effect of melt water and with the enhanced inflow of NAC, the northern Norwegian Sea transformed into a marine environment similar to modern. The foraminifera assemblage is characterized by the.–.assemblage, indicating an environment with high productivity, enhanced ventilation and AMOC (Telesiński et al., 2015). However, compared with time interval 62–52 ka BP, the NAC and AMOC were stronger and the temperature of the near-surface water was higher. The abundance of.(sin.) decreased significantly and the abundance of other planktonic species, such as.,.,.(dex), and.increased abruptly at 10 ka BP..is a sub-polar warm-water species with higher abundance in interglacials, and used as a proxy of strengthening of NAC or increasing surface water temperature (Johannessen et al., 1994; Rasmussen et al., 2016)..is also related to the NAC strengthening (Cifelli and Smith, 1970). The increase of.and.indicate a strengthening of the NAC in the northern Norwegian Sea since 10 ka BP..is a species whose distribution is closely related to the Arctic front area (Johannessen T., 1994; Risebrobakken et al., 2003)..(sin.) is the most common species in cold polar water masses below 10 °C, while.(dex) dominates in seawater above 15 °C (Ujiié and Ujiié, 1999; Eguchi et al., 2003). The decrease in relative abundance of.(sin.) and the increase of(dex) and.after 10 ka BP indicate the northward migration of the Arctic front and warming of the upper surface water layer because of stronger inflow of the warm NAC (Rasmussen and Thomsen, 2008; Husum and Hald, 2012). The higher relative abundance of the benthic species.indicates a strengthening of AMOC and better ventilation.
6 Conclusions
The distribution patterns of planktonic and benthic foraminiferal species with specific environmental adaptations and three distinct foraminiferal assemblages in core BB01 demonstrate that the northern Norwegian Sea experienced three kinds of marine environmentsover the last 62 ka. The three different environments were controlled by circulation of the NAC, by saline water sinking in polynya associated with upwelling of the surrounding water, and by melt-water flows.
In particular, during 62–52.5 ka BP and 9–0 ka BP, the northern Norwegian Sea was controlled by circulation of inflow of the NAC. The enhancement of NAC and AMOC resulted in the increase of near-surface temperature, higher levels of oxygen and nutrient supply to the seafloor. This, in turn promoted the productivity and diversity of foraminifera, increased the relative abundance of subpolar planktonic species and the benthic species.thriving in high-salinity, well-ventilated, and a food-rich seafloor environment.
At 29–17 ka BP, and during the last glacial maximum, the northern Norwegian Sea was under the control of saline water sinking and upwelling around the polynya. During this extreme cold period, the benthic foraminiferal faunas were dominated by.. The BSIS advanced to the shelf break, and polynya formed at the rim of the ice sheet. The salinity increased due to the forming of sea ice in the polynya, and the brine sank to the seafloor, while the surrounding intermediate-layer water compensated by moving upward, thereby forming a special environment, which was characterized by appearance of the planktonic foraminiferal species.(adapted to upwelling environments), and benthic foraminiferal species.(adapted to extreme cold conditions). At 17–10 ka BP, the marine environment of the Norwegian Sea was under the control of meltwater flows. A large amount of fresh melt water entered the northern Norwegian Sea, lead to the strengthening the stratification of the upper water column and poor ventilation at depth. The melt water controlled environment caused the lowest abundance and diversity of foraminifera. Only.adapted to oligotrophic benthic environmental conditions prevailed.
At 52.5–29 ka BP, during mid-late MIS 3, the marine environment of the northern Norwegian Sea frequently alternated among the above three environments with the transition between stadial and interstadial periods.
Acknowledgements The authors are grateful to all the crew members of the 5th Chinese National Arctic Research Expedition (CHINARE) and especially all scientists in charge of geological sampling. This research was funded by the Scientific Research Foundation of the Third Institute of Oceanography, Ministry of Natural Resources (Grant no. 2018006), Shandong Provincial Natural Science Foundation (Grant no. ZR2019BD054) and the project of the Chinese Arctic and Antarctic Administration, State Oceanic Administration (Grant no. CHINARE 2016-03-02). We would like to thank the two anonymous reviewers and Associate Editor, Dr. Fabio Florindo for their valuable suggestions and comments that improved this article.
Aksenov Y, Bacon S, Coward A C, et al. 2010. The North Atlantic inflow to the Arctic Ocean: High-resolution model study. J Mar Syst, 79(1-2): 1-22, doi: 10.1016/j.jmarsys.2009.05.003.
Andreassen K, Laberg J S, Vorren T O. 2008. Seafloor geomorphology of the SW Barents Sea and its glaci-dynamic implications. Geomorphology, 97(1-2): 157-177, doi: 10.1016/j.geomorph.2007. 02.050.
Bauch H A, Erlenkeuser H, Spielhagen R F, et al. 2001. A multiproxy reconstruction of the evolution of deep and surface waters in the subarctic Nordic seas over the last 30,000 yr. Quat Sci Rev, 20(4): 659-678, doi: 10.1016/S0277-3791(00)00098-6.
Blaauw M, Christen J A. 2011. Flexible paleoclimate age-depth models using an autoregressive gamma process. Bayesian Anal, 6(3): 457-474, doi:10.1214/ba/1339616472.
Broeker W. 1991. The great ocean conveyor. Oceanography, 4(2): 79-89, doi:10.5670/oceanog.1991.07.
Cifelli R, Smith R K. 1970. Distribution of planktonic foraminifera in the vicinity of the north Atlantic current. Smithson Contributions Paleobiology, 4: 1-52, doi:10.5479/si.00810266.4.1.
Clark P U, Dyke A S, Shakun J D, et al. 2009. The last glacial maximum. Science, 325(5941): 710-714, doi:10.1126/science.1172873.
Dokken T M, Nisancioglu K H, Li C, et al. 2013. Dansgaard-Oeschger cycles: Interactions between ocean and sea ice intrinsic to the Nordic seas. Paleoceanography, 28(3): 491-502, doi: 10.1002/palo.20042.
Dowdeswell J A, Elverhøi A, Andrews J T, et al. 1999. Asynchronous deposition of ice-rafted layers in the Nordic seas and North Atlantic Ocean. Nature, 400(6742): 348-351, doi: 10.1038/22510.
Drange H, Dokken T, Furevik T, et al. 2005. The Nordic seas: an overview. Geophys Monogr Ser, 199-220, doi:10.1029/158GM02.
Eguchi N O, Ujiié H, Kawahata H, et al. 2003. Seasonal variations in planktonic foraminifera at three sediment traps in the subarctic, transition and subtropical zones of the central North Pacific Ocean. Mar Micropaleontol, 48(1-2): 149-163, doi: 10.1016/ S0377-8398(03)00020-3.
Eldevik T, Nilsen J E Ø, Iovino D, et al. 2009. Observed sources and variability of Nordic seas overflow. Nat Geosci, 2: 406-410, doi: 10.1038/ngeo518.
Elliot M, Labeyrie L, Dokken T, et al, 2001. Coherent patterns of ice-rafted debris deposits in the Nordic regions during the last glacial (10–60 ka). Earth Planet Sci Lett, 194(1-2): 151-163, doi: 10.1016/S0012-821X(01)00561-1.
Ezat M M, Rasmussen T L, Groeneveld J. 2014. Persistent intermediate water warming during cold stadials in the southeastern Nordic Seas during the past 65 k.y. Geology, 42(8): 663-666, doi: 10.1130/ G35579.1.
Ezat M M, Rasmussen T L, Thornalley D J R , et al. 2017. Ventilation history of Nordic Seas overflows during the last (de)glacial period revealed by species-specific benthic foraminiferal14C dates. Paleoceanography, 32(2): 172-181, doi: 10.1002/2016PA003053.
Gascard J C, Watson A J, Messias M J, et al. 2002. Long-lived vortices as a mode of deep ventilation in the Greenland Sea. Nature, 416: 525-527, doi: 10.1038/416525a.
Gernigon L, Gaina C, Olesen O, et al. 2012. The Norway Basin revisited: From continental breakup to spreading ridge extinction. Mar Petroleum Geol, 35(1): 1-19, doi:10.1016/j.marpetgeo.2012.02.015.
Gregory T R, Smart C W, Hart M B, et al. 2010. Holocene palaeoceanographic changes in Barrow Strait, Canadian Arctic: foraminiferal evidence. J Quat Sci, 25(6): 903-910, doi: 10.1002/jqs. 1367.
Hammer Ø, Harper D A T, Ryan P D. 2001. PAST: Paleontological statistics software package for education and data analysis. Palaeontol Electron, 4(1): 1-9, doi: 10.1016/j.palaeo.2009.11.002.
Hansen B, Østerhus S. 2000. North Atlantic–Nordic Seas exchanges. Prog Oceanogr, 45(2): 109-208, doi: 10.1016/S0079-6611(99)00052-X.
Heaton T J, Köhler P, Butzin, M, et al. 2020. Marine20—The Marine Radiocarbon Age Calibration Curve (0–55,000 cal BP). Radiocarbon, 62(4): 779-820, doi: 10.1017/RDC.2020.68.
Hilbrecht H. 1996. Extant planktic foraminifera and the physical environment in the Atlantic and Indian Oceans: an atlas based on Climap and Levitus (1982). Mitteilungen aus dem Geologischen Institut der Eidgen, Technischen Hochschule und der Universität Zürich. Zürich.
Hoff U, Rasmussen T L, Stein R, et al. 2016. Sea ice and millennial-scale climate variability in the Nordic seas 90 kyr ago to present. Nat Commun, 7: 12247, doi: 10.1038/ncomms12247.
Hormes A, Gjermundsen E F, Rasmussen T L. 2013. From mountain top to the deep sea – Deglaciation in 4D of the northwestern Barents Sea ice sheet. Quat Sci Rev, 75: 78-99, doi: 10.1016/j.quascirev.2013.04.009.
Hull D, Osterman L, Thiede J. 1996. Biostratigraphic synthesis of leg 151, North Atlantic-Arctic gateways. Proceedings of the Ocean Drilling Program, Sci Rep, 151: 627-644, doi:10.2973/odp.proc.sr.151.146. 1996.
Husum K, Hald M. 2012. Arctic planktic foraminiferal assemblages: Implications for subsurface temperature reconstructions. Mar Micropaleontol, 96–97: 38-47, doi: 10.1016/j.marmicro.2012.07.001.
Johannessen T, Jansen E , Flatøy A, et al. 1994. The relationship between surface water masses, oceanographic fronts and paleoclimatic proxies in surface sediments of the Greenland, Iceland, Norwegian Seas//Zahn P T F, Kaminski M A, Labeyrie L. Carbon cycling in the glacial ocean: constraints on the ocean’s role in global change. Springer, Berlin, Heidelberg, 61-85, doi:10.1007/978-3-642-78737-9_4.
Kissel C, Laj C, Labeyrie L, et al.1999. Rapid climatic variations during marine isotopic stage 3: magnetic analysis of sediments from Nordic Seas and North Atlantic. Earth Planet Sci Lett, 171(3): 489-502, doi: 10.1016/S0012-821X(99)00162-4.
Knies J, Köseoğlu D, Rise L, et al. 2018. Nordic Seas polynyas and their role in preconditioning marine productivity during the Last Glacial Maximum. Nat Commun, 9(1): 3959, doi: 10.1038/s41467-018- 06252-8.
Knudsen K L, Stabell B, Seidenkrantz M S, et al. 2008. Deglacial and Holocene conditions in northernmost Baffin Bay: sediments, foraminifera, diatoms and stable isotopes. Boreas, 37(3): 346-376, doi: 10.1111/j.1502-3885.2008.00035.x.
Korsun S, Hald M. 1998. Modern benthic foraminifera off Novaya Zemlya tidewater glaciers, Russian Arctic. Arct Antarct Alp Res, 30(1): 61-77, doi: 10.1080/00040851.1998.12002876.
Latarius K, Quadfasel D. 2016. Water mass transformation in the deep basins of the Nordic Seas: Analyses of heat and freshwater budgets. Deep Sea Res Part I: Oceanogr Res Pap, 114: 23-42, doi: 10.1016/j.dsr.2016.04.012.
Lekens W A H, Sejrup H P, Haflidason, H, et al. 2006. Meltwater and ice rafting in the southern Norwegian Sea between 20 and 40 calendar kyr B.P.: Implications for Fennoscandian Heinrich events. Paleoceanography, 21(3): PA3013, doi: 10.1029/2005PA001228.
Meland M Y, Dokken T M, Jansen E, et al. 2008. Water mass properties and exchange between the Nordic seas and the northern North Atlantic during the period 23–6 ka: Benthic oxygen isotopic evidence. Paleoceanography, 23(1): PA1210, doi: 10.1029/2007PA001416 .
Muschitiello F, D’Andrea W J, Schmittner A, et al. 2019. Deep-water circulation changes lead North Atlantic climate during deglaciation. Nat Commun, 10(1): 1272, doi: 10.1038/s41467-019-09237-3.
Paillard D, Labeyrie L, Yiou P. 1996. Macintosh program performs time-series analysis. EOS Trans Am Geophys Union, 77(39): 379, doi: 10.1029/96EO00259.
Patton H, Hubbard A, Andreassen K, et al. 2017. Deglaciation of the Eurasian ice sheet complex. Quat Sci Rev, 169: 148-172, doi: 10.1016/j.quascirev.2017.05.019.
Pope EL, Talling P J, Hunt J E, et al. 2016. Long-term record of Barents Sea ice sheet advance to the shelf edge from a 140,000 year record. Quat Sci Rev,150: 55-66, doi: 10.1016/j.quascirev.2016.08.014.
Raj R P, Halo I. 2016. Monitoring the mesoscale eddies of the Lofoten Basin: importance, progress, and challenges. Int J Remote Sens, 37(16): 3712-3728, doi: 10.1080/01431161.2016.1201234.
Rasmussen T L, Thomsen E. 2008. Warm Atlantic surface water inflow to the Nordic Seas 34–10 calibrated ka B.P. Paleoceanography, 23(1): PA1201, doi: 10.1029/2007PA001453.
Rasmussen T L, Thomsen E. 2009. Ventilation changes in intermediate water on millennial time scales in the SE Nordic Seas, 65–14 kyr BP. Geophys Res Lett, 36(1) : L01601, doi: 10.1029/2008GL036563.
Rasmussen T L, Thomsen E. 2017. Ecology of deep-sea benthic foraminifera in the North Atlantic during the last glaciation: Food or temperature control. Palaeogeogr Palaeoclimatol Palaeoecol, 472: 15-32, doi: 10.1016/j.palaeo.2017.02.012.
Rasmussen T L, Thomsen E, Moros M. 2016. North Atlantic warming during Dansgaard-Oeschger Events synchronous with Antarctic warming and out-of-phase with Greenland climate. Sci Rep, 6: 20535, doi: 10.1038/srep20535.
Rasmussen T L, Thomsen E, Nielsen T. 2014. Water mass exchange between the Nordic Seas and the Arctic Ocean on millennial timescale during MIS 4–MIS 2. Geochemistry, Geophys Geosystems, 15(3): 530-544, doi: 10.1002/2013GC005020.
Rasmussen T L, Thomsen E, Ślubowska M A. et al. 2007. Paleoceanographic evolution of the SW Svalbard margin (76°N) since 20,00014C yr BP. Quat Res, 67(1): 100-114, doi: 10.1016/j.yqres. 2006.07.002.
Rasmussen T L, Thomsen E, van Weering T C E, et al. 1996. Rapid changes in surface and deep water conditions at the Faeroe Margin during the last 58,000 years. Paleoceanography, 11(6): 757-771, doi: 10.1029/96PA02618.
Risebrobakken B, Jansen E, Andersson C, et al. 2003. A high-resolution study of Holocene paleoclimatic and paleoceanographic changes in the Nordic Seas. Paleoceanography, 18(1): 1017, doi: 10.1029/2002PA 000764.
Sadatzki H, Dokken T M, Berben S M P, et al. 2019. Sea ice variability in the southern Norwegian Sea during glacial Dansgaard-Oeschger climate cycles. Sci Adv, 5(3): eaau6174, doi: 10.1126/sciadv.aau6174.
Scott D B, Schell T, Rochon A, et al. 2008. Benthic foraminifera in the surface sediments of the Beaufort Shelf and slope, Beaufort Sea, Canada: Applications and implications for past sea-ice conditions. J Mar Syst, 74(3-4) 840-863, doi: 10.1016/j.jmarsys.2008.01.008.
Simstich J, Lorenz S J, Bauch H A. 2013. Reprint of: Evaluation of past stratification changes in the Nordic Seas by comparing planktonic foraminiferal δ18O with a solar-forced model. Marine Micropaleontology, 99: 45-50, doi: 10.1016/j.marmicro.2013.03.009.
Spielhagen R F, Baumann K H, Erlenkeuser H, et al. 2004. Arctic Ocean deep-sea record of northern Eurasian ice sheet history. Quat Sci Rev, 23(11-13): 1455-1483, doi: 10.1016/j.quascirev.2003.12.015.
Struve T, Roberts NL, Frank M, et al. 2019. Ice-sheet driven weathering input and water mass mixing in the Nordic Seas during the last 25,000 years. Earth Planet Sci Lett, 514: 108-118, doi: 10.1016/j.epsl.2019. 02.030.
Telesiński M M, Bauch H A, Spielhagen R F, et al. 2015. Evolution of the central Nordic Seas over the last 20 thousand years. Quat Sci Rev, 121, 98-109, doi: 10.1016/j.quascirev.2015.05.013.
Thunell R, Anderson D, Gellar D, et al. 1994. Sea-surface temperature estimates for the tropical western Pacific during the last glaciation and their implications for the Pacific warm pool. Quat Res, 41(3): 255-264, doi:10.1006/qres.1994.1029.
Ujiié H, Ujiié Y. 1999. Late Quaternary course changes of the Kuroshio Current in the Ryukyu Arc region, northwestern Pacific Ocean. Mar Micropaleontol, 37(1): 23-40, doi: 10.1016/S0377-8398(99)000 10-9.
Wang Q, Wekerle C, Wang X, et al. 2020. Intensification of the Atlantic water supply to the Arctic Ocean through Fram Strait induced by Arctic sea ice decline. Geophys Res Lett, 47(3), doi: 10.1002/essoar. 10501439.1.
: Wang W G, Zhao M W, Yang J C, et al. The marine environmental evolution in the northern Norwegian Sea revealed by foraminifera during the last 60 ka. Adv Polar Sci, 2021, 32(3): 210-220,
10.13679/j.advps.2021.0020
Corresponding author, ORCID: 0000-0001-6048-5570, E-mail: yinwei_zhao@163.com
30 April 2021;
2 July 2021;
30 August 2021
杂志排行
Advances in Polar Science的其它文章
- Application of unmanned underwater vehicles in polar research
- An introduction to the riometer system deployed at China-Iceland joint Arctic observatory and its beam- forming correction method based on the preliminary data
- Different physiopsychological changes between AMS- susceptible and AMS-resistant pre-selected Antarctic expeditioners in Tibet
- Characteristics of hydrogen/oxygen isotopes in water masses and implications for spatial distribution of freshwater in the Amundsen Sea, Southern Ocean
- Marine biogenic aerosols and their effects on aerosol- cloud interactions over the Southern Ocean: a review
- Utilization of clean energy and future trend of Antarctic research stations