Characteristics of hydrogen/oxygen isotopes in water masses and implications for spatial distribution of freshwater in the Amundsen Sea, Southern Ocean
2021-08-18SHAOHebinHEJianfengLUOGuangfuLANMushengYULejiangGUOGuijunLIANErgang
SHAO Hebin, HE Jianfeng*, LUO Guangfu, LAN Musheng, YU Lejiang, GUO Guijun & LIAN Ergang
Characteristics of hydrogen/oxygen isotopes in water masses and implications for spatial distribution of freshwater in the Amundsen Sea, Southern Ocean
SHAO Hebin1, HE Jianfeng1*, LUO Guangfu1, LAN Musheng1, YU Lejiang1, GUO Guijun2& LIAN Ergang3
1MNR Key Laboratory for Polar Science, Polar Research Institute of China, Shanghai 200136, China;2First Institute of Oceanography, Ministry of Natural Resources,Qingdao 266061, China;3State Key Laboratory of Marine Geology, Tongji University, Shanghai 20092, China
Antarctica’s marginal seas are of great importance to atmosphere–ocean–ice interactions and are sensitive to global climate change. Multiple factors account for the freshwater budget in these regions, including glacier melting, seasonal formation/decay of sea ice, and precipitation. Hydrogen (H) and oxygen (O) isotopes represent useful proxies for determining the distribution and migration of water masses. We analyzed the H and O isotopic compositions of 190 seawater samples collected from the Amundsen Sea during the 34th Chinese Antarctic Research Expedition in 2017/2018. The upper-oceanic structure (<400 m) and freshwater (meteoric water and sea ice melt) distribution in the Amundsen Sea were identified based on conductivity–temperature–depth data and the H and O isotopic composition. Antarctic Surface Water, characterized as cold and fresh with low H and O isotopic ratios, was found distributed mainly in the upper ~150 m between the Antarctic Slope Front and Polar Front, where it had been affected considerably by upwelled Upper Circumpolar Deep Water (UCDW) between 68°S and 71°S. A three-endmember (meteoric water, sea ice melt, and Circumpolar Deep Water) mixing model indicated that waters with relatively high proportions (>3%) of freshwater generally lie in the upper ~50 m and extend from Antarctica to ~65°S in the meridional direction (anomalously low freshwater proportion occurred between 68°S and 71°S). Winter Water mainly occupied the layer between 50 and 150 m south of 71°S in the western Amundsen Sea. The water structure and spatial distribution of freshwater in the upper Amundsen Sea were found influenced mainly by the rates of basal and surficial melting of ice shelves, seasonal alternation of sea ice melt/formation, wind forcing, and regional bathymetry. Owing to the distance between heavy sea ice boundary (HSIB) and ice shelves is much shorter in the western HSIB than the east HSIB, the western part of the heavy sea ice boundary includes a higher proportion of freshwater than the eastern region. This study, which highlighted the distribution and extent of freshwater derived from ice (ice shelves and sea ice) melt, provides important evidence that the offshore drift pathway of cold and fresh Antarctic continental shelf water is likely interrupted by upwelled UCDW in the Amundsen Sea.
hydrogen and oxygen isotopes, freshwater, ice shelf, sea ice, upwelling Circumpolar Deep Water, Amundsen Sea,Southern Ocean
1 Introduction
Warming of the Southern Ocean is effective in melting ice at the ice–ocean interface, and the largely marine-based West Antarctic Ice Sheet (WAIS) is considered very sensitive both to sea level rise and to regional oceanographic and atmospheric changes (Joughin and Alley, 2011). If the WAIS were to melt or collapse completely, a substantial rise of global sea level of 3.3–4.3 m would occur (Bamber et al., 2009; Fretwell et al., 2013). In fact, collapse of just the drainage sector of the Amundsen Sea, located along Marie Byrd Land in West Antarctica, would raise sea level by ~1.5 m (Vaughan, 2008).
Oceanic anomalies have been observed in the Amundsen Sea. For example, heat transport anomalies related to invasion of the Circumpolar Deep Water (CDW) have resulted in basal melting of ice shelves (Walker et al., 2007; Thoma et al., 2008; Jacobs et al., 2012; Spence et al., 2017). Thus, ice shelves in the Amundsen Sea have experienced rapid retreat/thinning in recent years that has introduced increasing volumes of meltwater into the ocean. Pine Island Glacier, one of the most well-studied ice streams in West Antarctica, exhibits a very high rate of basal melting and a retreating grounding line, implying negative mass balance of the ice shelf front (Jenkins et al., 2010; Jacobs et al., 2011; Arneborg et al., 2012; Robertson, 2013; Dutrieux et al., 2014; Davis et al., 2018). High loss rates of the Antarctic glacial ice mass and the corresponding outflow of meltwater are modifying the structure of the waters surrounding the Antarctic and the ecosystems of the Southern Ocean (Billen and Becquevort, 1990; Bintanja et al., 2013; Rignot et al., 2013; Lee et al., 2016).
Sea ice plays a critical role in global climate change through the effect of albedo feedback, especially in the Arctic where it has been undergoing rapid decline (Screen and Simmonds, 2010; Stroeve et al., 2012). However, on the basis of many observations, the extent of sea ice is known to have expanded in most areas around the Antarctic continent within the previous three decades (Turner et al., 2009; Zunz et al., 2013). This might be due to accelerated melting of ice shelves, which reduces convective mixing between cold surface freshwater and warmer, saltier subsurface water (Bintanja et al., 2013). However, some previous studies argued that sea ice expansion could be attributed to intensification and southward migration of Southern Ocean westerlies, leading to reduction of poleward heat transport (Zhang, 2007; Goosse et al., 2009). Other studies suggested that the increase of Antarctic sea ice is consistent with the intrinsic variability of the Amundsen Sea Low (Turner et al., 2013; Turner et al., 2016). Conversely, it has been proposed that the overall increase in sea ice extent masks large regional variations, particularly the decrease observed in the Bellingshausen/ Amundsen seas (Stammerjohn et al., 2012; Turner et al., 2016). Although the explanation of the mechanism driving the anomalous increase (entire Antarctic) and decrease (Bellingshausen/Amundsen seas) in Antarctic sea ice has yet to be fully elucidated (Bintanja et al., 2013), it is understood that variation of sea ice extent would have substantial impact on the temporal and spatial variations of water structure in the Southern Ocean (Hellmer, 2004; Thoma et al., 2008; Ohshima et al., 2013; Schmidtko et al., 2014; Haumann et al., 2016; Spence et al., 2017; Pellichero et al., 2018).
Freshwater in the Southern Ocean, which is derived mainly from the melting of ice shelves and sea ice, displays regional and seasonal variations (Skvarca et al., 1999; Rignot et al., 2013; Meredith et al., 2016). To constrain the contribution of western Antarctic freshwater both to the Southern Ocean and to global sea level rise, it is necessary to determine the sources of freshwater and the pathways of freshwater migration into adjacent seas. Analyses of oceanographic data collected recently in the Amundsen Sea revealed enhanced freshwater production (Randall- Goodwin et al., 2015; Turner et al., 2017; Davis et al., 2018); however, details of the freshwater system remain uncertain owing to the relatively sparse dataset. Most previous related studies focused on the continental shelves, and only a few reported on the offshore areas in this marginal sea. Hydrogen (H) and oxygen (O) isotopes, which represent reasonable proxies for distinguishing different sources of water, can be used to identify the different origins and seaward distributions of freshwater in the upper ocean of the Amundsen Sea.
In this study, we analyzed the H and O isotopic compositions of seawater samples collected during the 34th Chinese National Antarctic Research Expedition (CHINARE) in 2017/2018. The main objectives of this study were as follows: (1) to identify the features of H and O isotopes of the water masses in the upper Amundsen Sea, Southern Ocean; (2) to examine the structure of the water masses and the distribution of freshwater in the upper Amundsen Sea based on H/O isotopic data and conductivity–temperature–depth (CTD) data; and (3) to clarify those factors that control the distribution and transportation of freshwater in the heavy sea ice boundary (HSIB) and offshore regions.
2 Regional oceanography
Four important water masses of the Southern Ocean, i.e., surface/upper oceanic waters, intermediate waters, deep waters, and bottom waters, can be identified in terms of commonly measured properties (e.g., salinity, potential temperature, potential density, and dissolved oxygen (DO)) (Talley et al., 2011). Several fronts marking the boundaries between the water masses of the Southern Ocean encircle Antarctica (Figure 1): the Subantarctic Front (SAF), Polar Front (PF), Southern Antarctic Circumpolar Current Front (SACCF), Southern Boundary (SB), and Antarctic Slope Front (ASF) (Talley et al., 2011). The SAF and PF, which are parts of the Antarctic Circumpolar Current (ACC), represent strong eastward currents. The SB is not a dynamical front and has been defined as the southern edge of the low-DO layer of the Upper CDW (UCDW) (Orsi et al., 1995). The ASF, which lies along the Antarctic continental slope, separates continental shelf water from offshore waters (Walker et al., 2013).
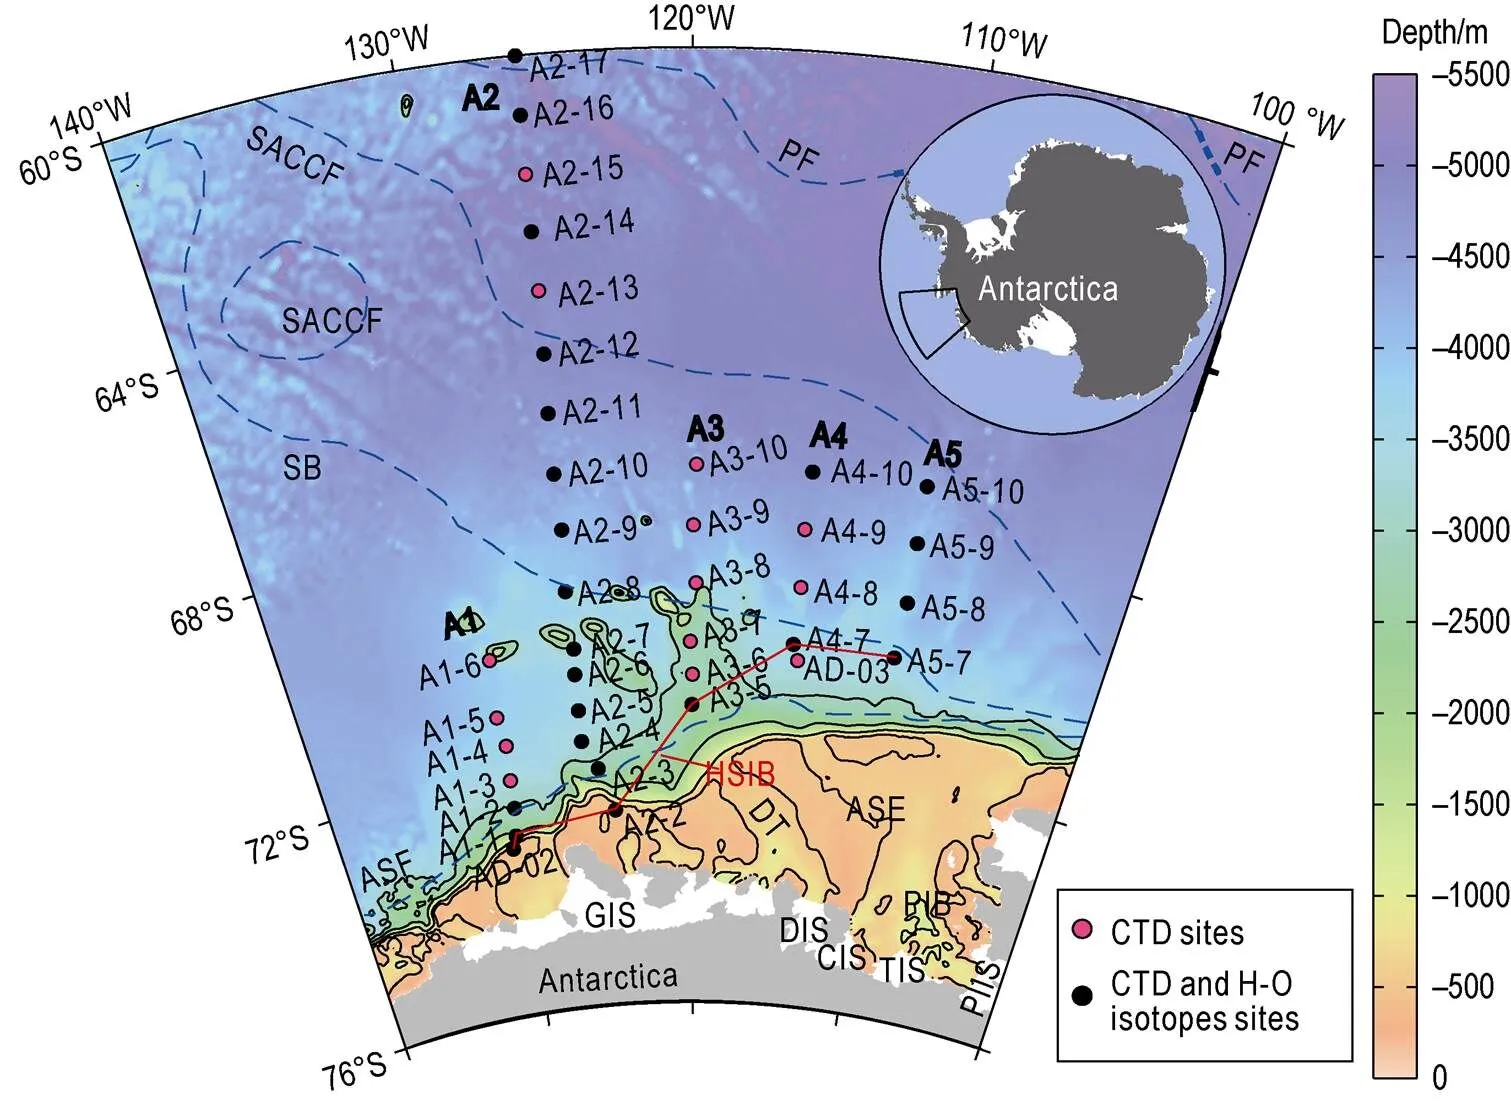
Figure 1 Map showing the study area and sampling locations of the 34th CHINARE. HSIB indicates the heavy sea ice boundary; GIS, DIS, CIS, TIS along the coastline represent the Getz, Dotson, Crosson Ice shelves and Thwaites Ice Shelf, respectively; DT and PIB on the continental shelf refer to Dotson Trough and Pine Island Bay, respectively; ASE is the Amundsen Sea Embayment. Blue dotted lines are the fronts reported by Orsi et al. (1995): PF = Polar Front, SACCF = Southern Antarctic Circumpolar Current Front, SB = Southern Boundary, and ASF = Antarctic Slope Front.
The CDW, which is a southward flow derived partially from the deep waters of Southern Ocean basins with depths of ~2500–4000 m, lies just below the Antarctic Surface Water (AASW) south of the SAF (Orsi et al., 1995; Thoma et al., 2008). It is usually divided into UCDW and Lower CDW (LCDW). The UCDW has high nutrient concentrations that support phytoplankton growth (Tomczak and Godfrey, 1994; Talley et al., 2011; Morrison et al., 2015); however, it is usually identified based on the DO minimum (Orsi et al., 1995; Jacobs et al., 2011; Randall-Goodwin et al., 2015). In the Antarctic zone, the LCDW lies between the UCDW and Antarctic bottom waters at depths of ~400–700 m, and generally has higher potential temperature and salinity than the overlying water mass.
Owing to Ekman transport induced by westerly winds, surface water flows northward with a flux of the order of 30 Sv across the SAF (Talley et al., 2011). Buoyancy motion can trigger upwelling of CDW to balance the mass loss in the surface layer. This process enhances migration of CDW across the continental shelves and induces increased melting of ice shelves (Jacobs et al., 2011). In contrast, the westerly winds turn into easterlies near 65°S (Tomczak and Godfrey, 1994), resulting in Ekman transport flowing in the onshore direction.
As CDW flows across the continental slope, warmer and saltier water intrudes onto the continental shelf and mixes with the cold water derived from the melting ice shelves (Alley et al., 2016; Kim et al., 2016; Thompson et al., 2018; Narayanan et al., 2019). Moreover, as LCDW can reach the base of ice shelves near the coastal line, basal melting occurs widely at the continental glacier margins. The properties of LCDW consequently become less dense and cold after mixing with the meltwater, resulting in the formation of continental shelf waters (Pritchard et al., 2012). The dense part of the modified water then returns offshore and might form part of the Antarctic Bottom Water. In contrast, the remaining modified water drifting northward becomes AASW, which is further influenced by upwelled UCDW near the continental slope (Marshall and Speer, 2012; Morrison et al., 2015).
Typically, the ice shelves in the Amundsen Sea—from west to east: Getz Ice Shelf (GIS), Dotson Ice Shelf, Crosson Ice Shelf, Thwaites Ice Shelf, and Pine Island Ice Shelf—have been eroded at high rates by warm continental shelf waters (Jacobs et al., 2012; Alley et al., 2015; Schroeder et al., 2018; Wei et al., 2019). The Amundsen Sea Embayment (ASE) is characterized by a landward-sloping bed, which allows warm waters to enter deep into the interior beneath the bottom of the ice sheet, potentially causing glacier instability and retreat (Schoof, 2007; Robertson, 2013; Alley et al., 2015). This is another important process accounting for the high rate of basal melting of ice shelves in this area. Nevertheless, no strong constraints are available regarding the potential contribution to sea level change attributable to the case in which a threshold-crossing freshwater outflow associated with basal melting might trigger complete collapse of the WAIS (Joughin et al., 2014; Rignot et al., 2014).
Basal melt and direct collapse of ice shelves, plus snow falling into the ocean (meteoric water (MW)), are important sources of freshwater for the Southern Ocean. As this freshwater is sourced from the Antarctic atmosphere, it should have a largely consistent isotopic composition (Cai et al., 2003; Randall-Goodwin et al., 2015). Seasonal expansion/retreat of sea ice impacts the distribution of surface freshwater, e.g., the mass of freshwater decreases owing to brine rejection during sea ice formation in autumn–winter and increases during sea ice melt in spring–summer (Assmann et al., 2005; Meredith et al., 2016). Thus, MW and sea ice meltwater (SIM) predominately comprise the freshwater system in the Southern Ocean, which is largely affected by the various regional fronts and currents.
3 Materials and methods
3.1 Field survey and in situ measurements
As part of the 34th CHINARE, a 25-d hydrographic, biological, and biogeochemical survey was conducted onboard the icebreaker R/Vwhile in the Amundsen Sea in March 2017. Five transects with 39 sites were investigated during this expedition (Figure 1).
Seawater salinity and temperature were measured using Seabird 911 plus CTD sensors. The raw data were processed into 1-m intervals using SBE Data Processing software. The HSIB transect included the sites closest to the Antarctic continent (Figure 1). The longest transect in the meridional direction (A2) extended from ~73°Sto ~60°S.
3.2 Stable isotopes analysis
Overall, 190 seawater samples were collected from the upper layers (<400 m) of the Amundsen Sea using a CTD Rosette sampler. Water was stored in 50-mL acid-cleaned polyethylene vials after filtration through precleaned 0.2-μm-pore cellulose acetate filters. Then, the vials were sealed and refrigerated at 4 °C until isotopic analysis.
The H (δD) and O (δ18O) isotopes were measured using an isotopic water analyzer (IWA-45EP, LGR Co.) at the State Key Laboratory of Marine Geology, Tongji University (China), following the procedures of Berman et al. (2013). The isotopic data are reported relative to Vienna-Standard Mean Ocean Water, and the precision of the δD and δ18O measurements was better than ±0.5‰ and ±0.1‰, respectively.
3.3 Quantifying the contributions of freshwater fractions
The higher precision of the δ18O measurements in comparison with the δD measurements indicates that δ18O should be more reliable for determining the contributions of sea ice and ice shelf meltwater. We assumed that the waters of the Antarctic marginal seas are composed of MW, SIM, and CDW. Therefore, a simple three-endmember mixing model was developed to address the freshwater balance between MW and SIM (Meredith et al., 2008; Meredith et al., 2016). All three endmembers have well-separated values of salinity and δ18O:
SIMMWCDW1,(1)
SIM×SIMMW×MWCDW×CDWOBS,(2)
SIM×SIMMW×MWCDW×CDWOBS,(3)
where SIM, MW, OBS,, and δ represent sea ice meltwater, meteoric water observed in seawater, salinity, and δ18O, respectively. Endmembers for CDW and sea ice are relatively well-constrained by previous observations for a region near the sites evaluated in this study (Randall-Goodwin et al., 2015). We used the values of 7 and 2.1‰ for sea ice salinity and δ18O, respectively, and the values of CDW salinity and δ18O were set as 34.62 and −0.059‰, respectively. The largest uncertainty lies in the δ18O of MW. We used the salinity as 0 and δ18O was set as −37.44‰±5‰ based on the average value of a long ice core drilled in West Antarctica (close to the ASE) (Buizert et al., 2015). Given the range of δ18O end member, the uncertainty in the derived MW and SIM percentages is no more than ±0.5%.
4 Results
Waters in the Amundsen Sea were divided into three depth units based on salinity and temperature features: 0–150 m, 150–400 m, and>400 m (Figure 2a). The 0–150 m layers included large changes of salinity in the range of 33.1–34.1, while the corresponding temperature was generally <0 °C. Temperature correlated positively with salinity in seawater at depths of >100 m at almost all sites, although the vertical gradient of change of both salinity and temperature of 150–400 m layers was greater than that of >400 m.
The temperature of the upper layers in the western region of the study areais higher than in the eastern region at 150 m and 300 m and the opposite feature (temperature was higher in the eastern region) at 5 m and 50 m (Figure 3a). The 0 °Cisotherm in the 0–150 m layers extended northward of ~64.5°S, while temperature became warmer than 0 °C everywhere north than 64.5 ºS in the upper 400 m layers (Figure 4a). For the HSIB, the temperature increased from west to east (Figure 4f).
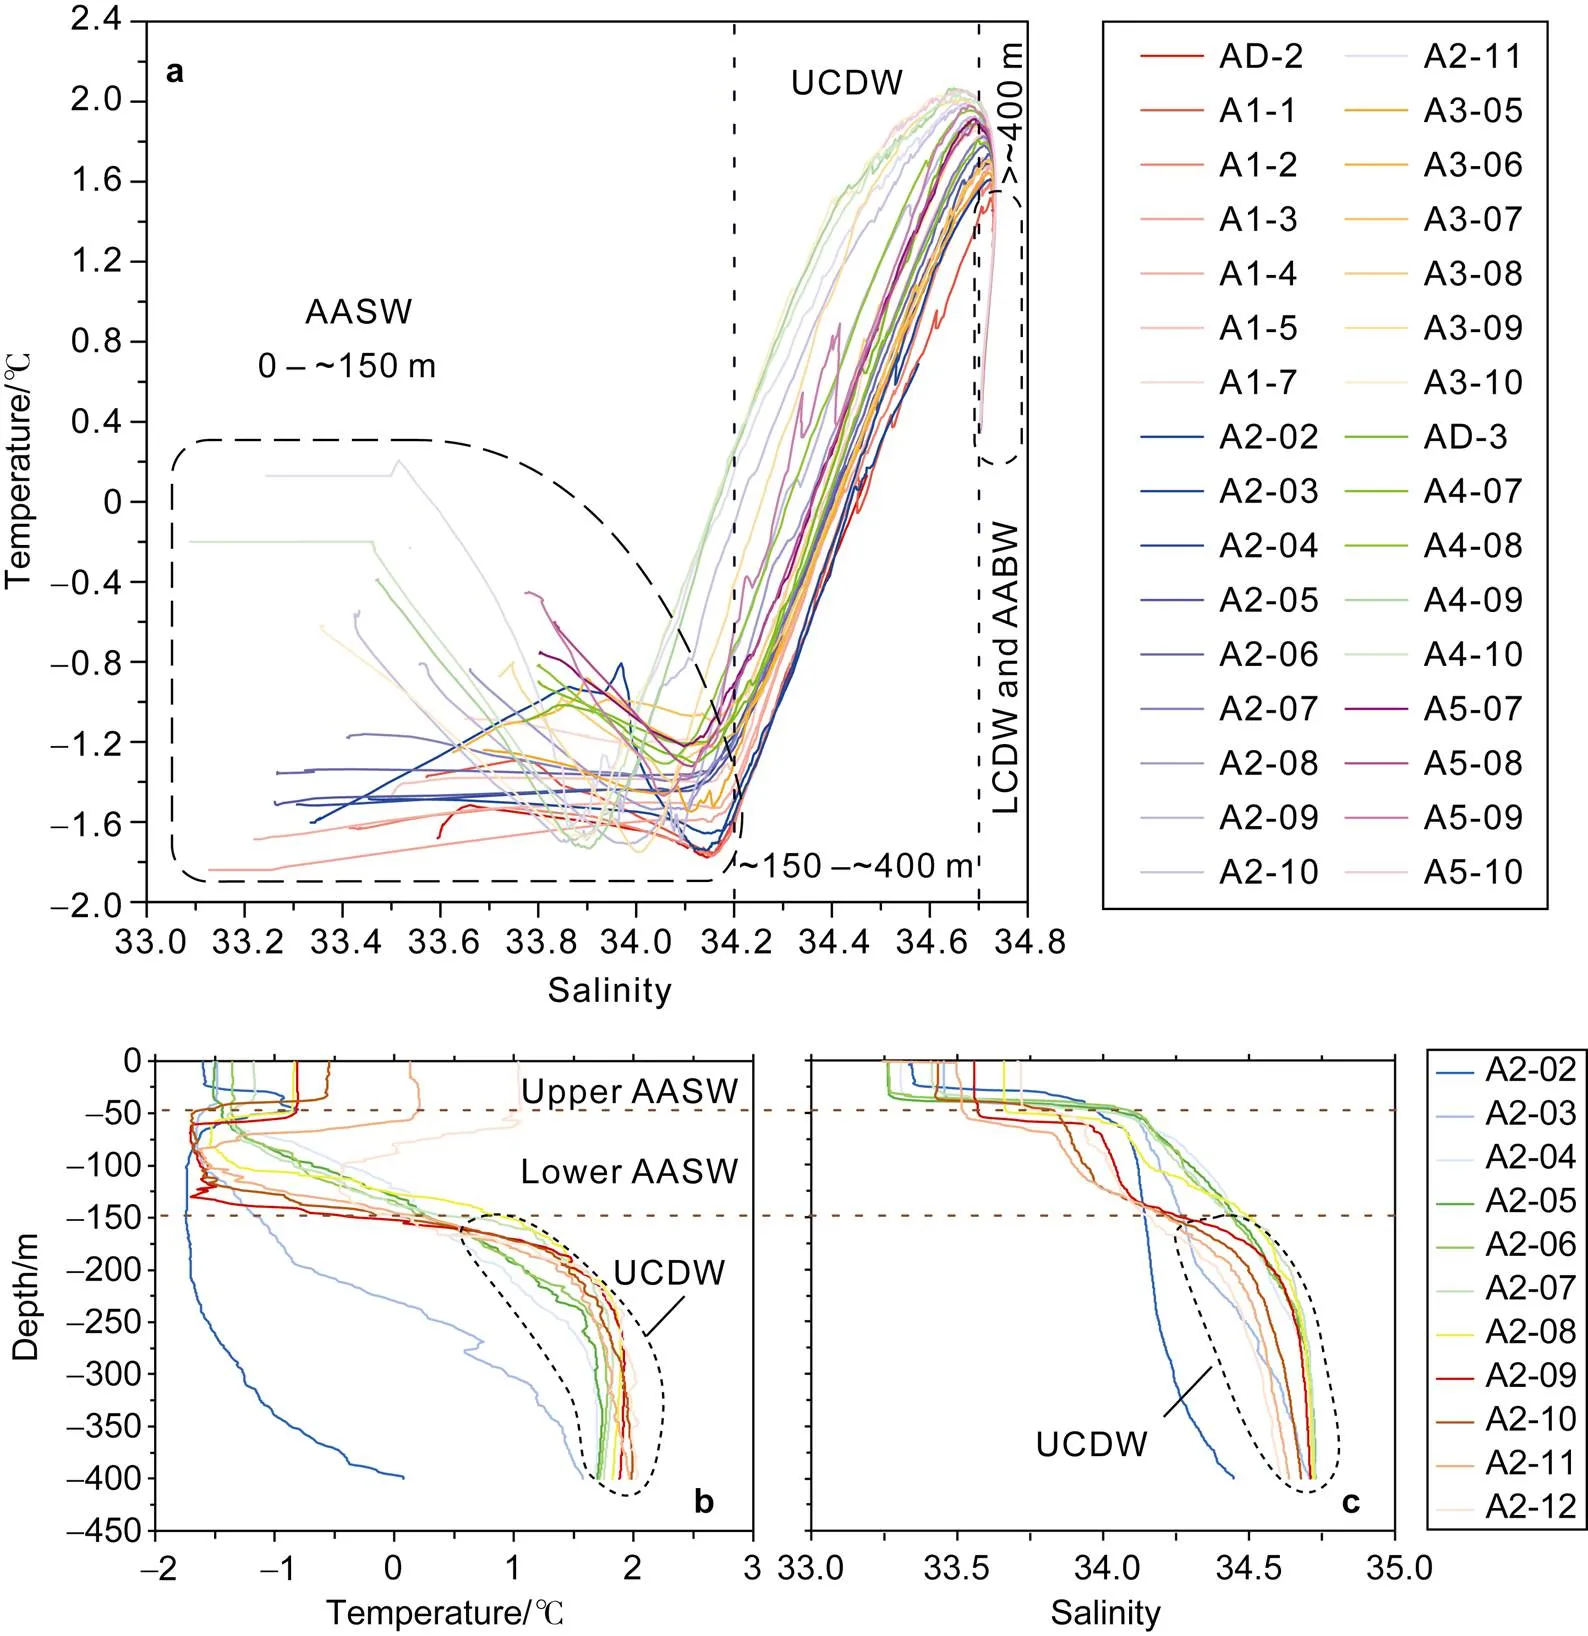
Figure 2 Plot of temperature–salinity of CTD data (all depths) south of 65°S (a) and vertical changes of temperature (b) and salinity (c) in the upper layers of transect A2 (<400 m).
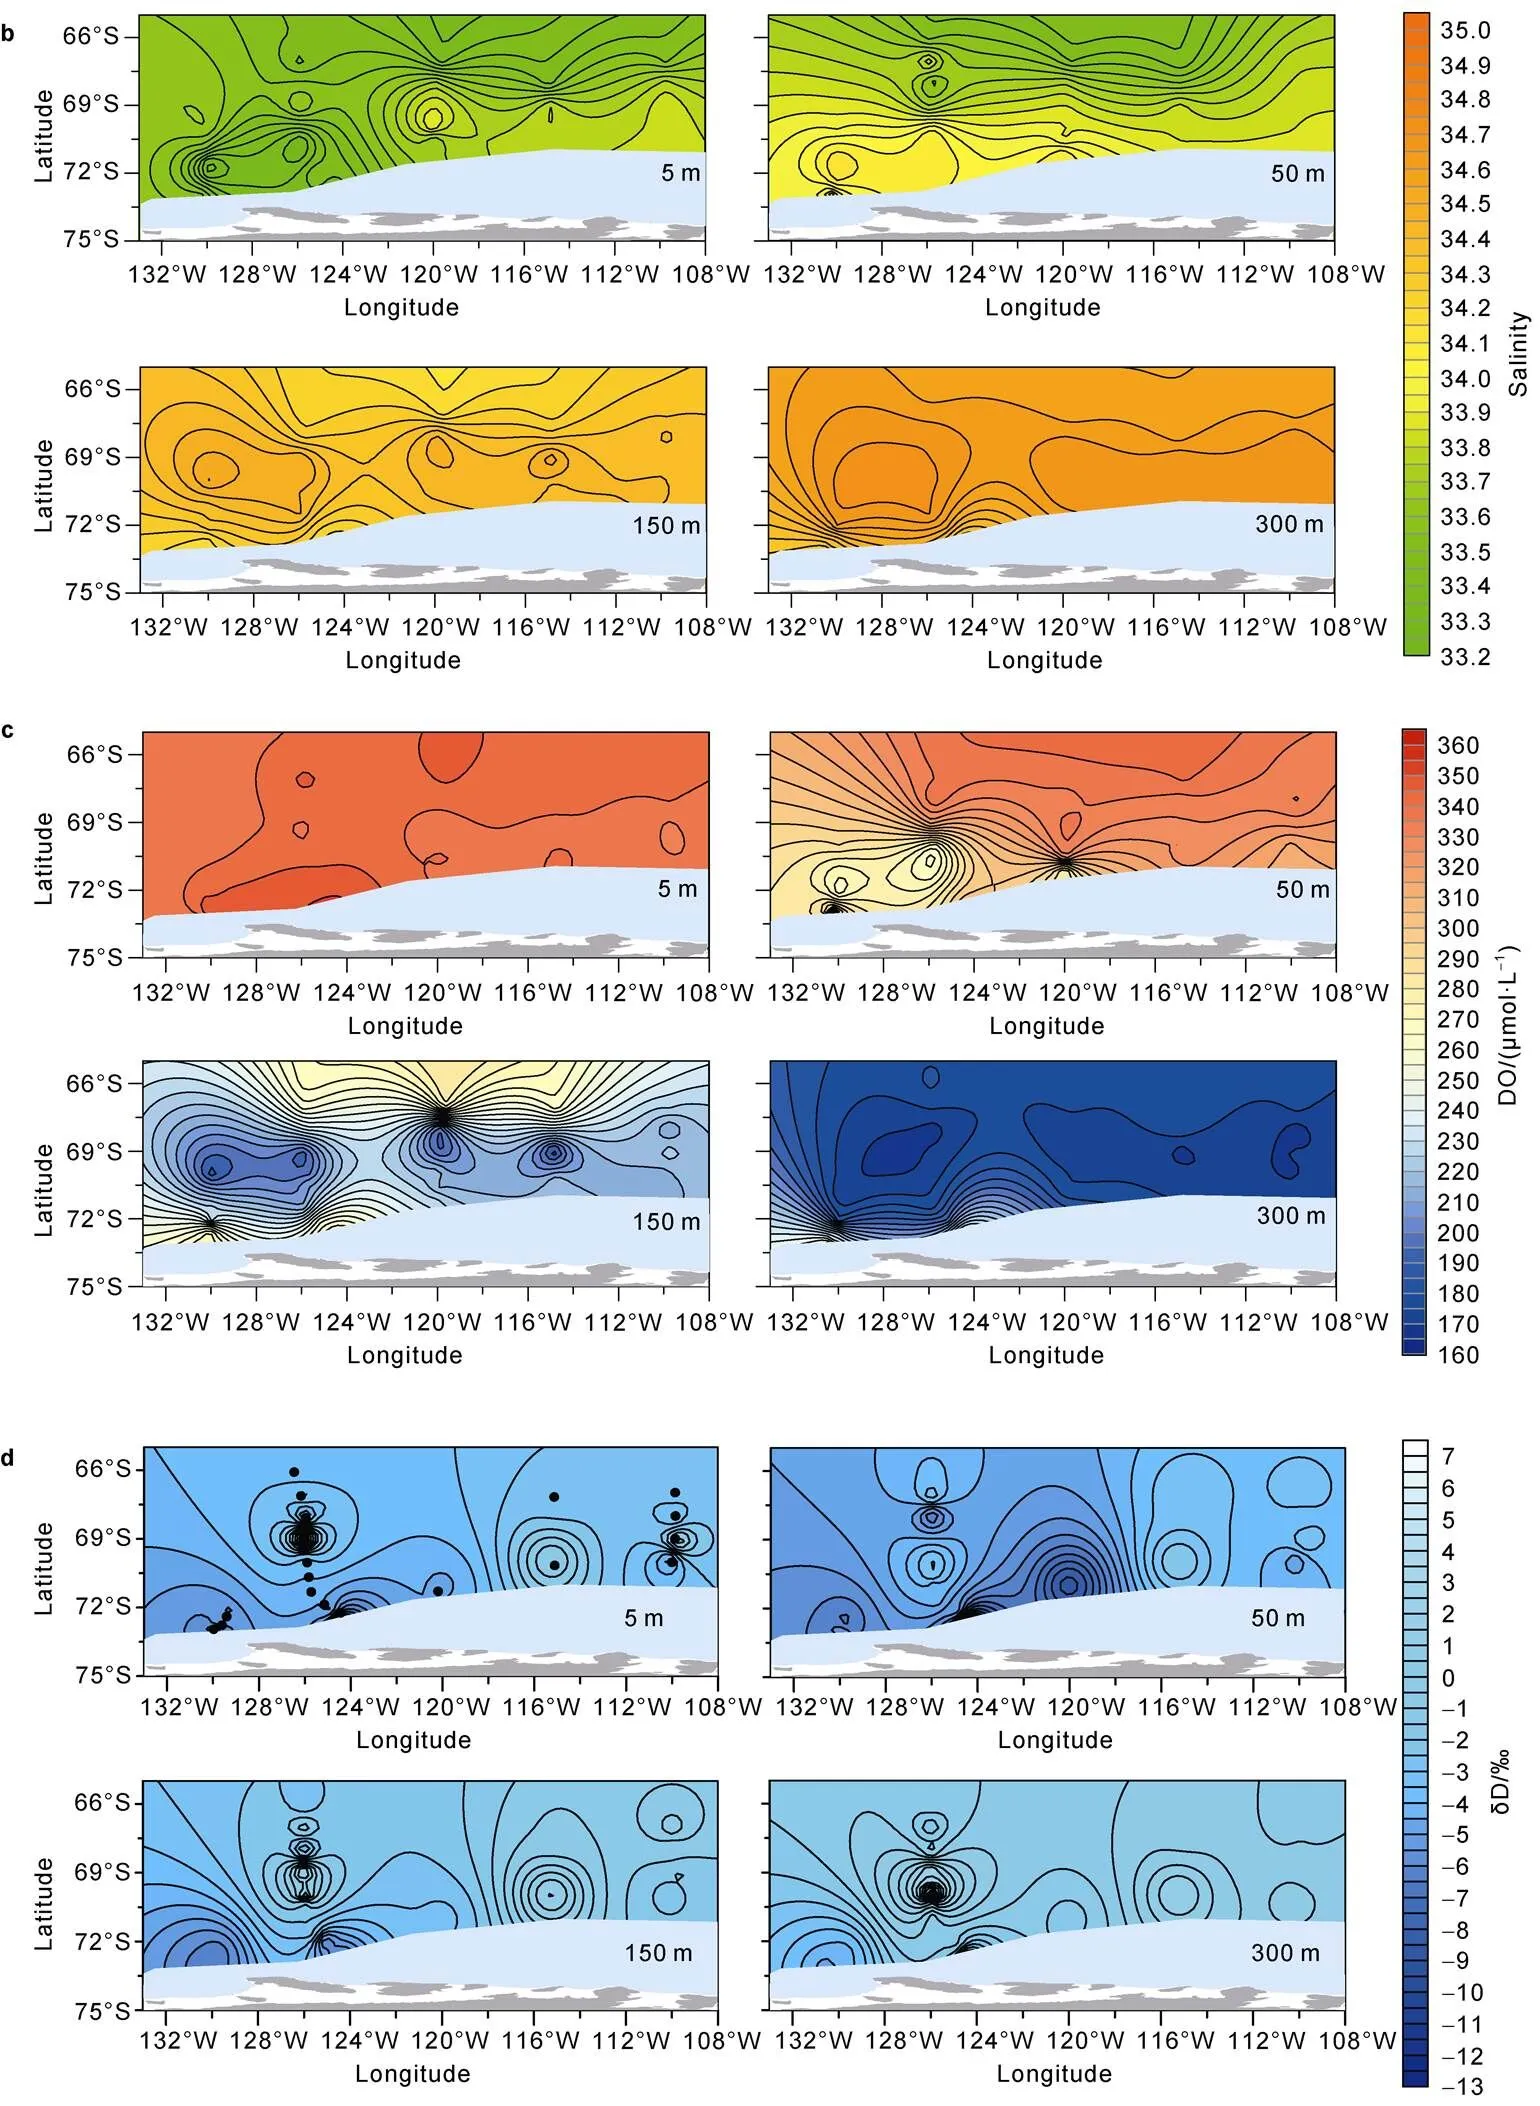
Figure 3 Regional distribution of seawater physicochemical properties (i.e., temperature, salinity, and dissolved oxygen (DO), and hydrogen (δD) and oxygen (δ18O) isotopic compositions) at depths of 5, 50, 150 and 300 m. Red solid dots in (a-5 m) represent sites of CTD data, and black solid dots in (d-5 m) represent sites of δD and δ18O data.
The salinity of the waters of the Amundsen Sea increased with depth. In the 5 m layer, the water was fresher in the west than in the east, whereas the converse was true in the 50 m layer. Waters with lower salinity (i.e., in the range of 33.6–34.2) were distributed mainly in the upper layers along coastal regions (Figure 4b). Salinity anomalies could be identified between 70°S and 68°S along transect A2, showing specific higher salinity than found in regions beyond this extent (Figure 4b). The distribution of salinity in the HSIB displayed a pattern similar to that of temperature, showing that the western part was fresher than the east along HSIB.
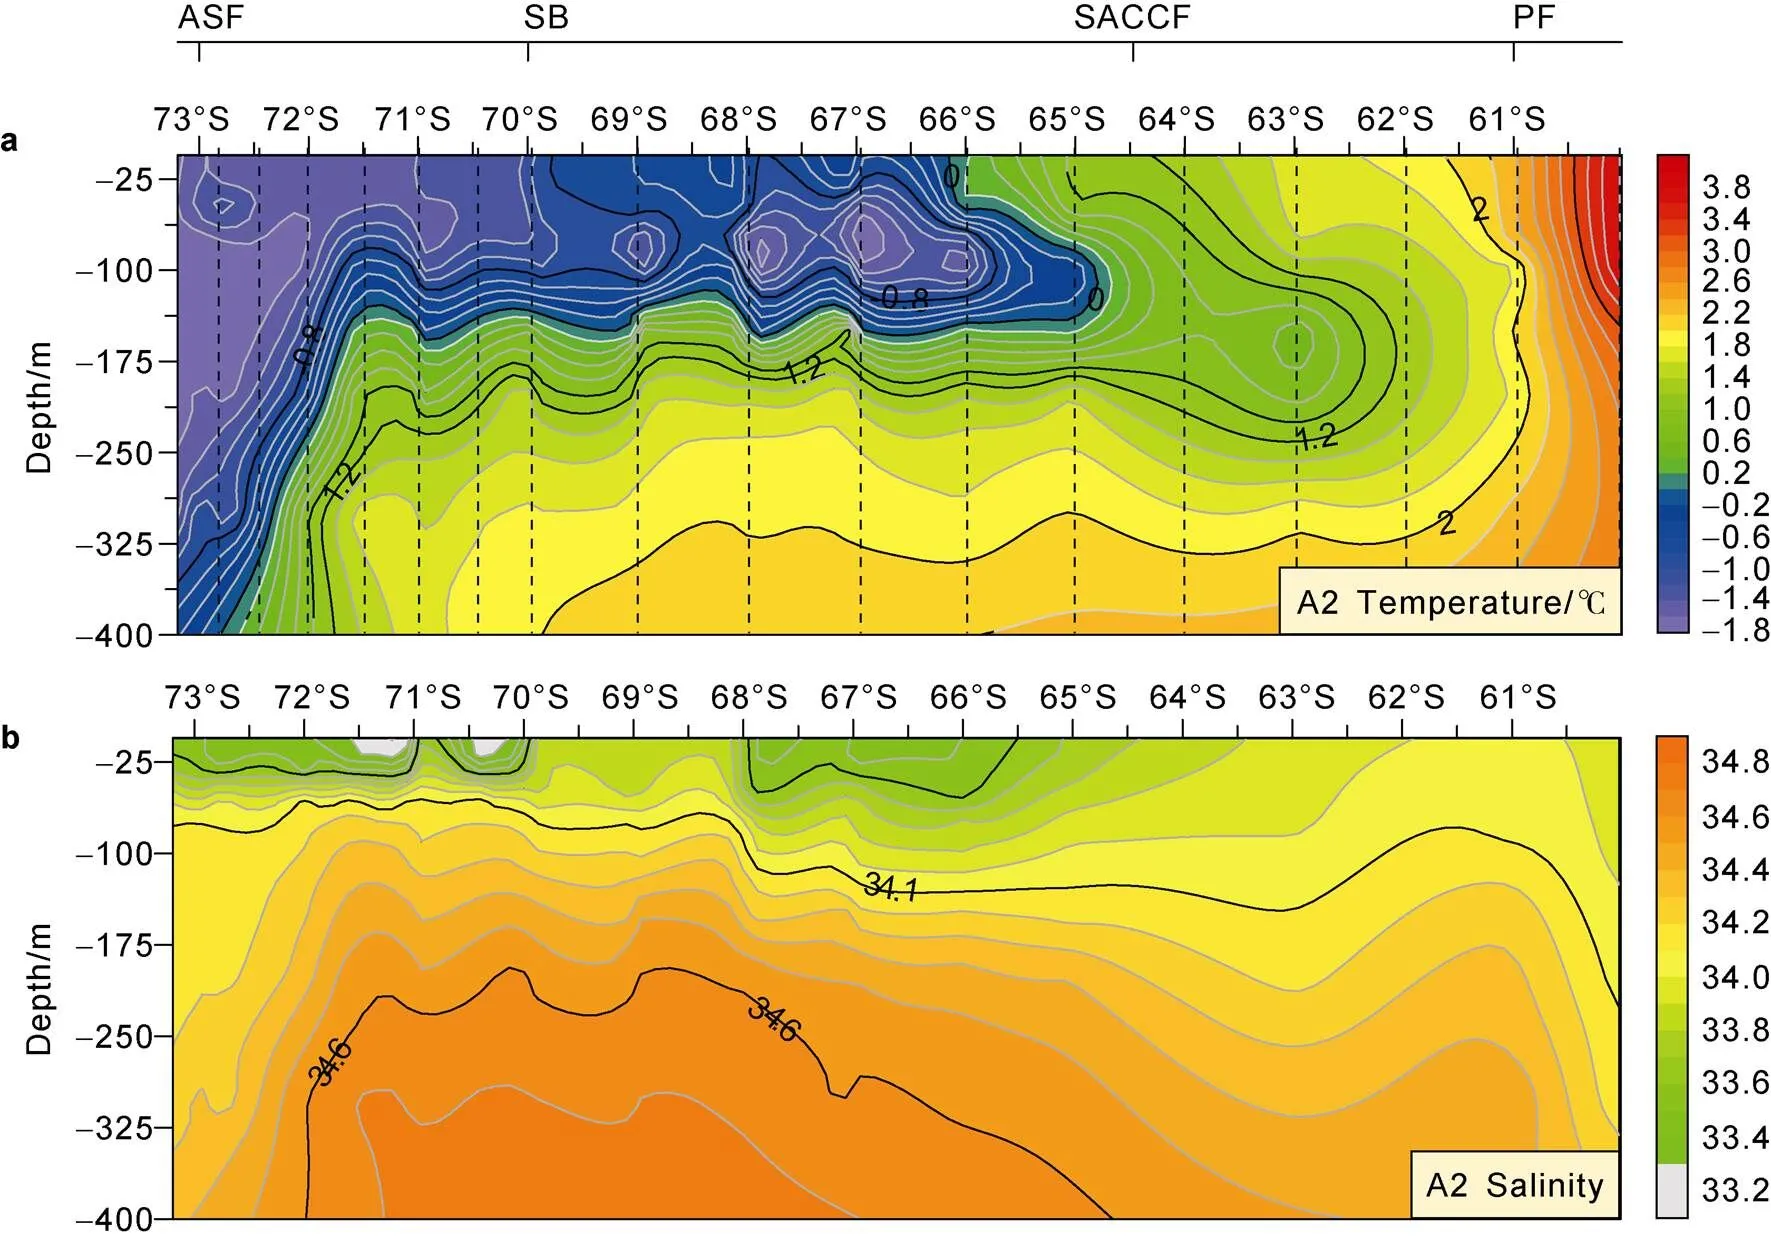
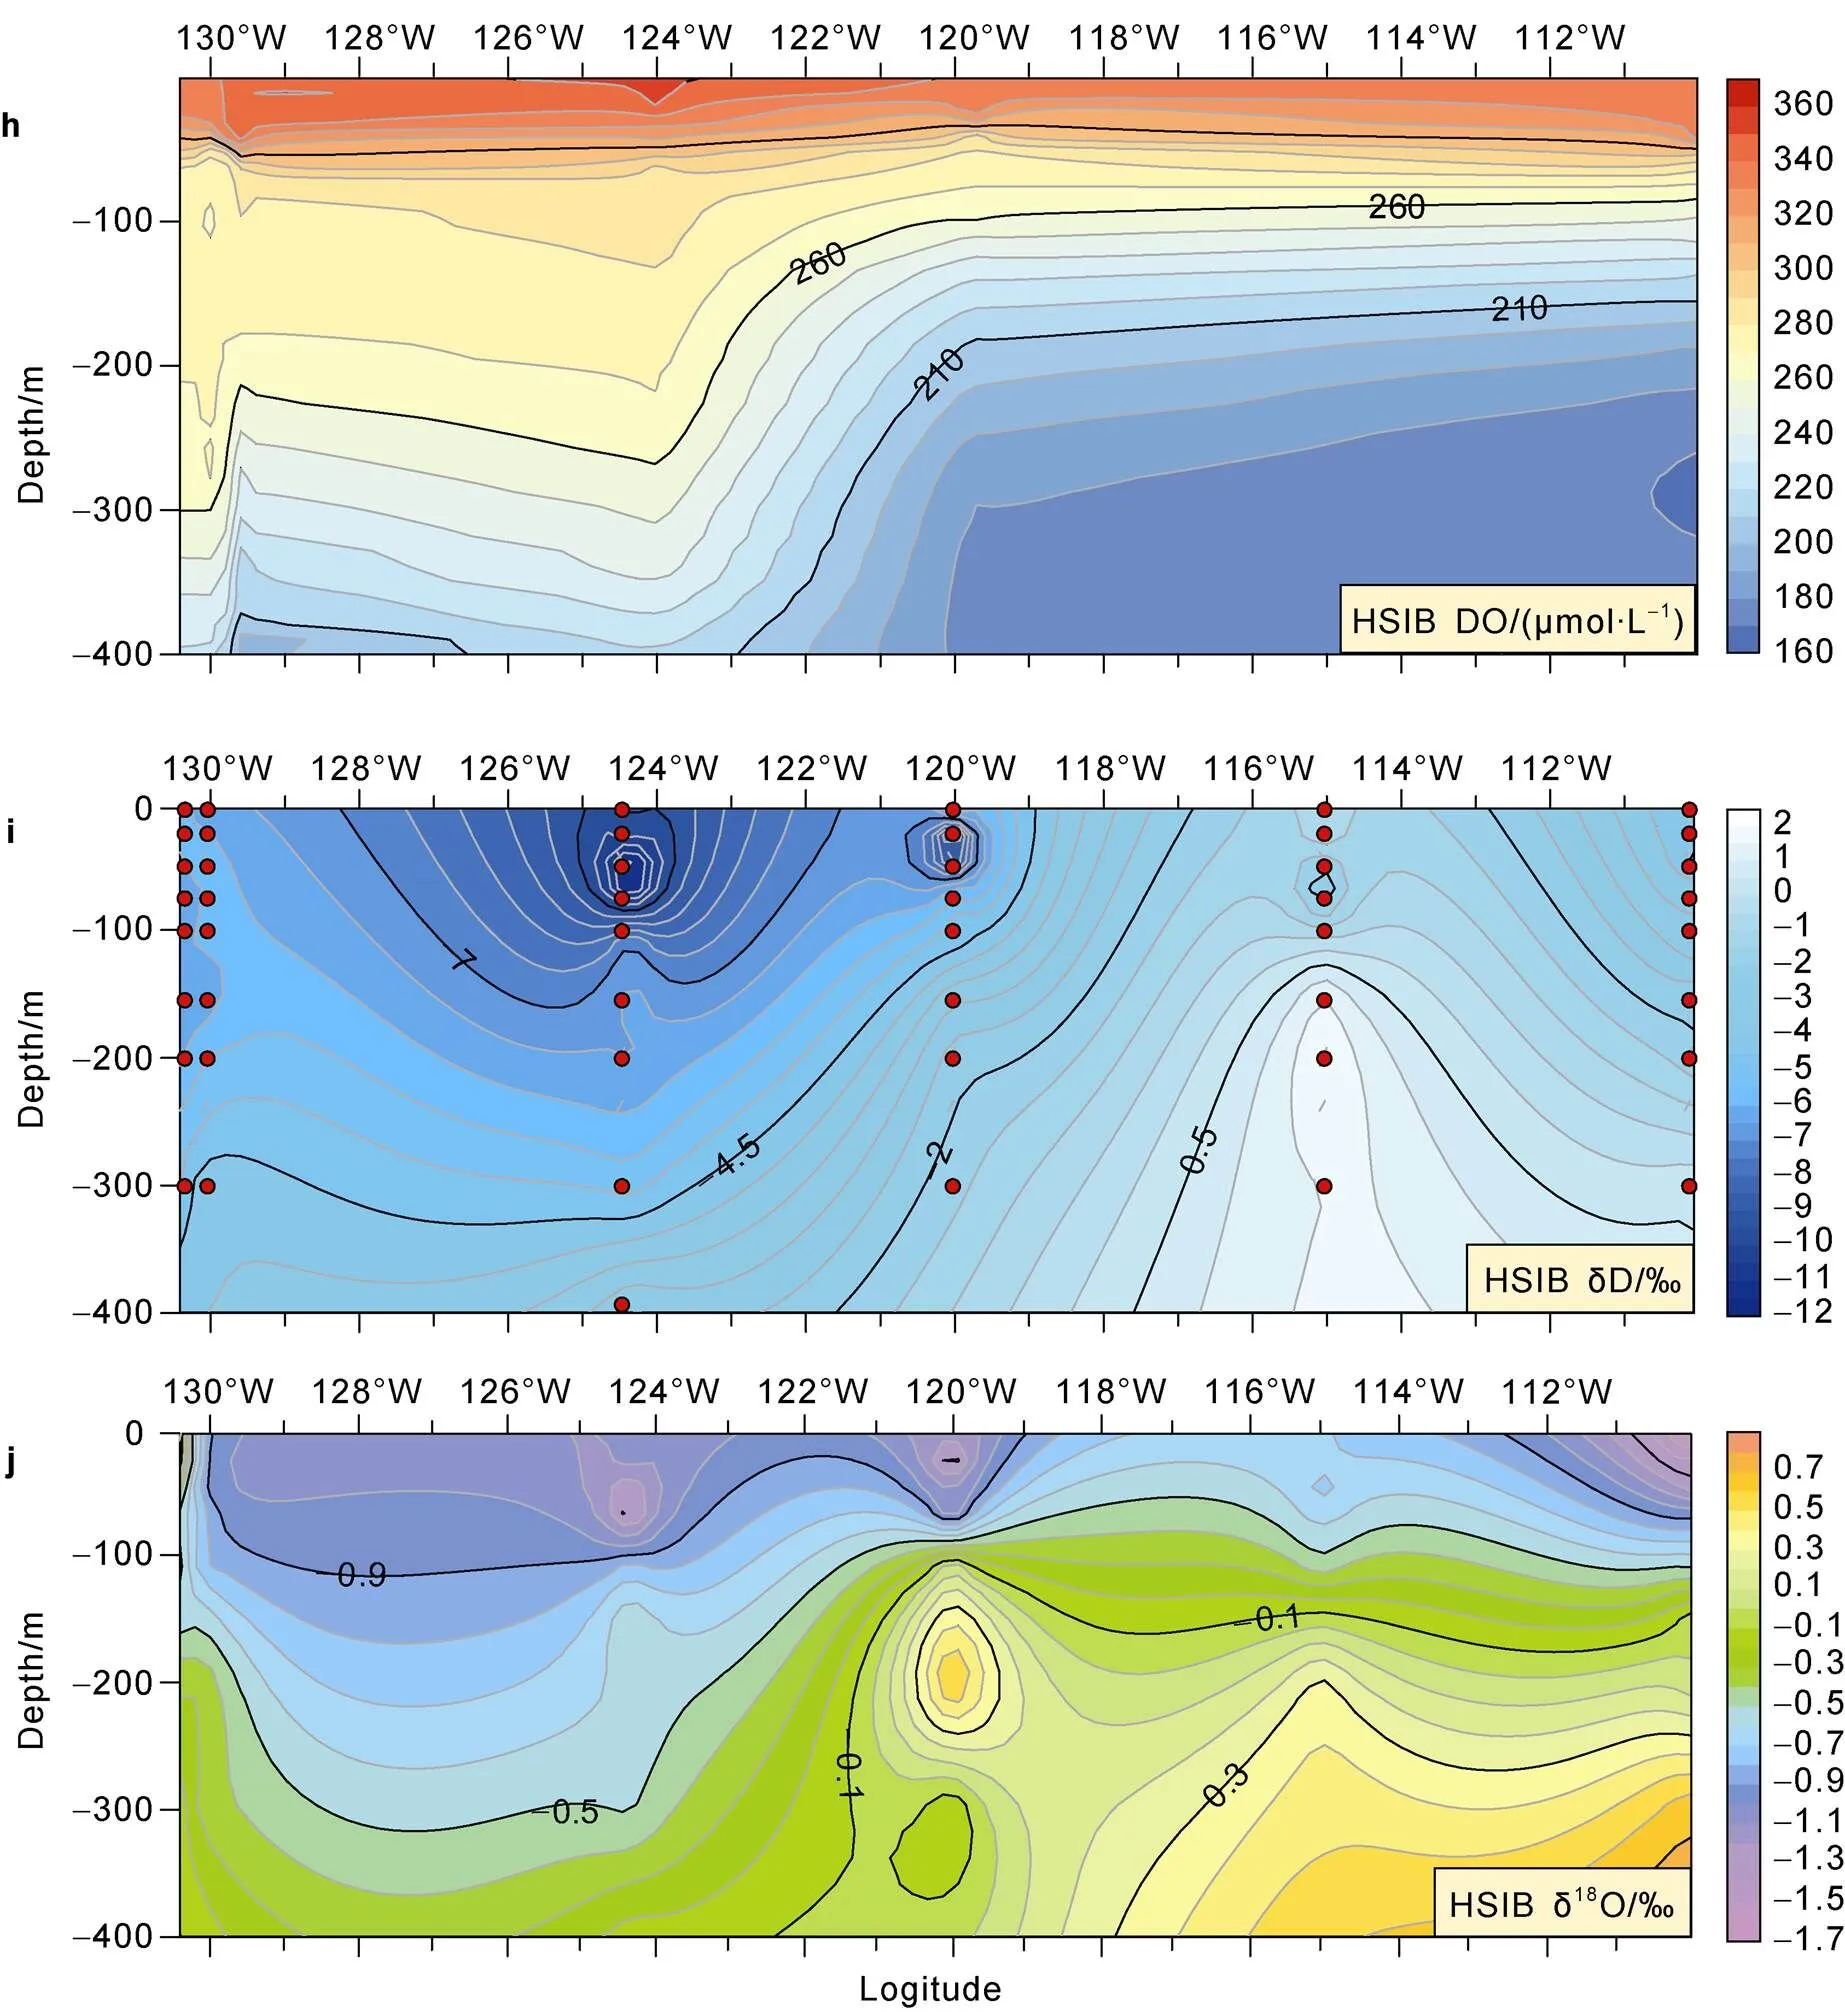
Figure 4 Vertical distribution of seawater physicochemical properties (i.e., temperature, salinity, and dissolved oxygen (DO), and hydrogen (δD) and oxygen (δ18O) isotopic compositions) in the upper layers (<400 m) of transects A2 and the HSIB. Vertical dotted lines in (a) and (f) represent the distributions of CTD data in the two profiles, processed as 1-m intervals in depth. Vertical red dots in (d) and (i) represent distributions of samples with δD and δ18O data in the two profiles.
Concentrations of DO, which were in the range of 160–360 μmol·L−lin the < 400 m layers, had a negative relationship with salinity (Figures 3 and 4c), where higher (lower) values were found mainly in inshore (offshore) regions. The northern part of the 50 m layer had higher DO concentrations than found in the southern regions, which is different from other layers (Figure 3c). A remarkable bulge of relatively low DO isolines between 72°S and 68°S was identified in transect A2 (Figure 4c), which was generally similar to the patterns of salinity and isotopic data.
The distributions of the isotopic ratios south of 65°S are shown in Figures 3d and 3e. The ratios of δD and δ18O had positive correlation, and ranged from −12.40‰ to 6.50‰ and from −1.67‰ to 0.68‰, respectively. Both δD and δ18O values showed landward decrease in the upper layers (5 and 50 m). The values in the adjacent areas of the ASE and GIS were markedly lower than in other regions, and the lowest value of δ18O was found near the HSIB transect at ~110°W. However, the values in the ASE were elevated in the subsurface waters (150 and 300 m). The remarkably low values of δD and δ18O could extend beneath 300 m in the A2 transect at the coastal area, but the isotopic ratios showed an increasing tendency in the northward direction with an interruption of anomalously high values between 66°S and 72°S (Figures 4d and 4e). For the HSIB transect (Figures 4g and 4h), the isotopic ratios were generally higher in the eastern part than in the western part (in particular upper layers).
The freshwater (FW: MW and SIM), particularly in the top 150 m, was considered an important component of the upper waters based on the CTD and isotopic data of the Amundsen Sea (Figures 5 and 6). Two local extremes of MW (>3%) close to the regions of the ASE and GIS in the HSIB transect are shown in Figure 6e. The pattern of FW in this transect is different from that of MW, showing higher percent values of FW in the GIS sector than in the ASE sector (Figure 6d). The meridional extent of the higher percent values of FW (>3%) could reach to 64°S (A2), but was distributed mainly in the upper 50 m layer. The extremes of FW at approximately 71°S and 66°S were consistent with lower content of MW.
5 Discussion
5.1 Water structure of the upper ocean in the Amundsen Sea
5.1.1 Fronts and AASW determined in this study
Although previous studies have determined the distributions and characteristics of the water masses in the Southern Ocean (Orsi et al., 1995; Talley et al., 2011), the isotopic data associated with common proxies (temperature, salinity, and DO) in this study provide further information regarding the upper Amundsen Sea. The intermediate waters, which are generally found at the northern side of the SAF, do not affect our study area.
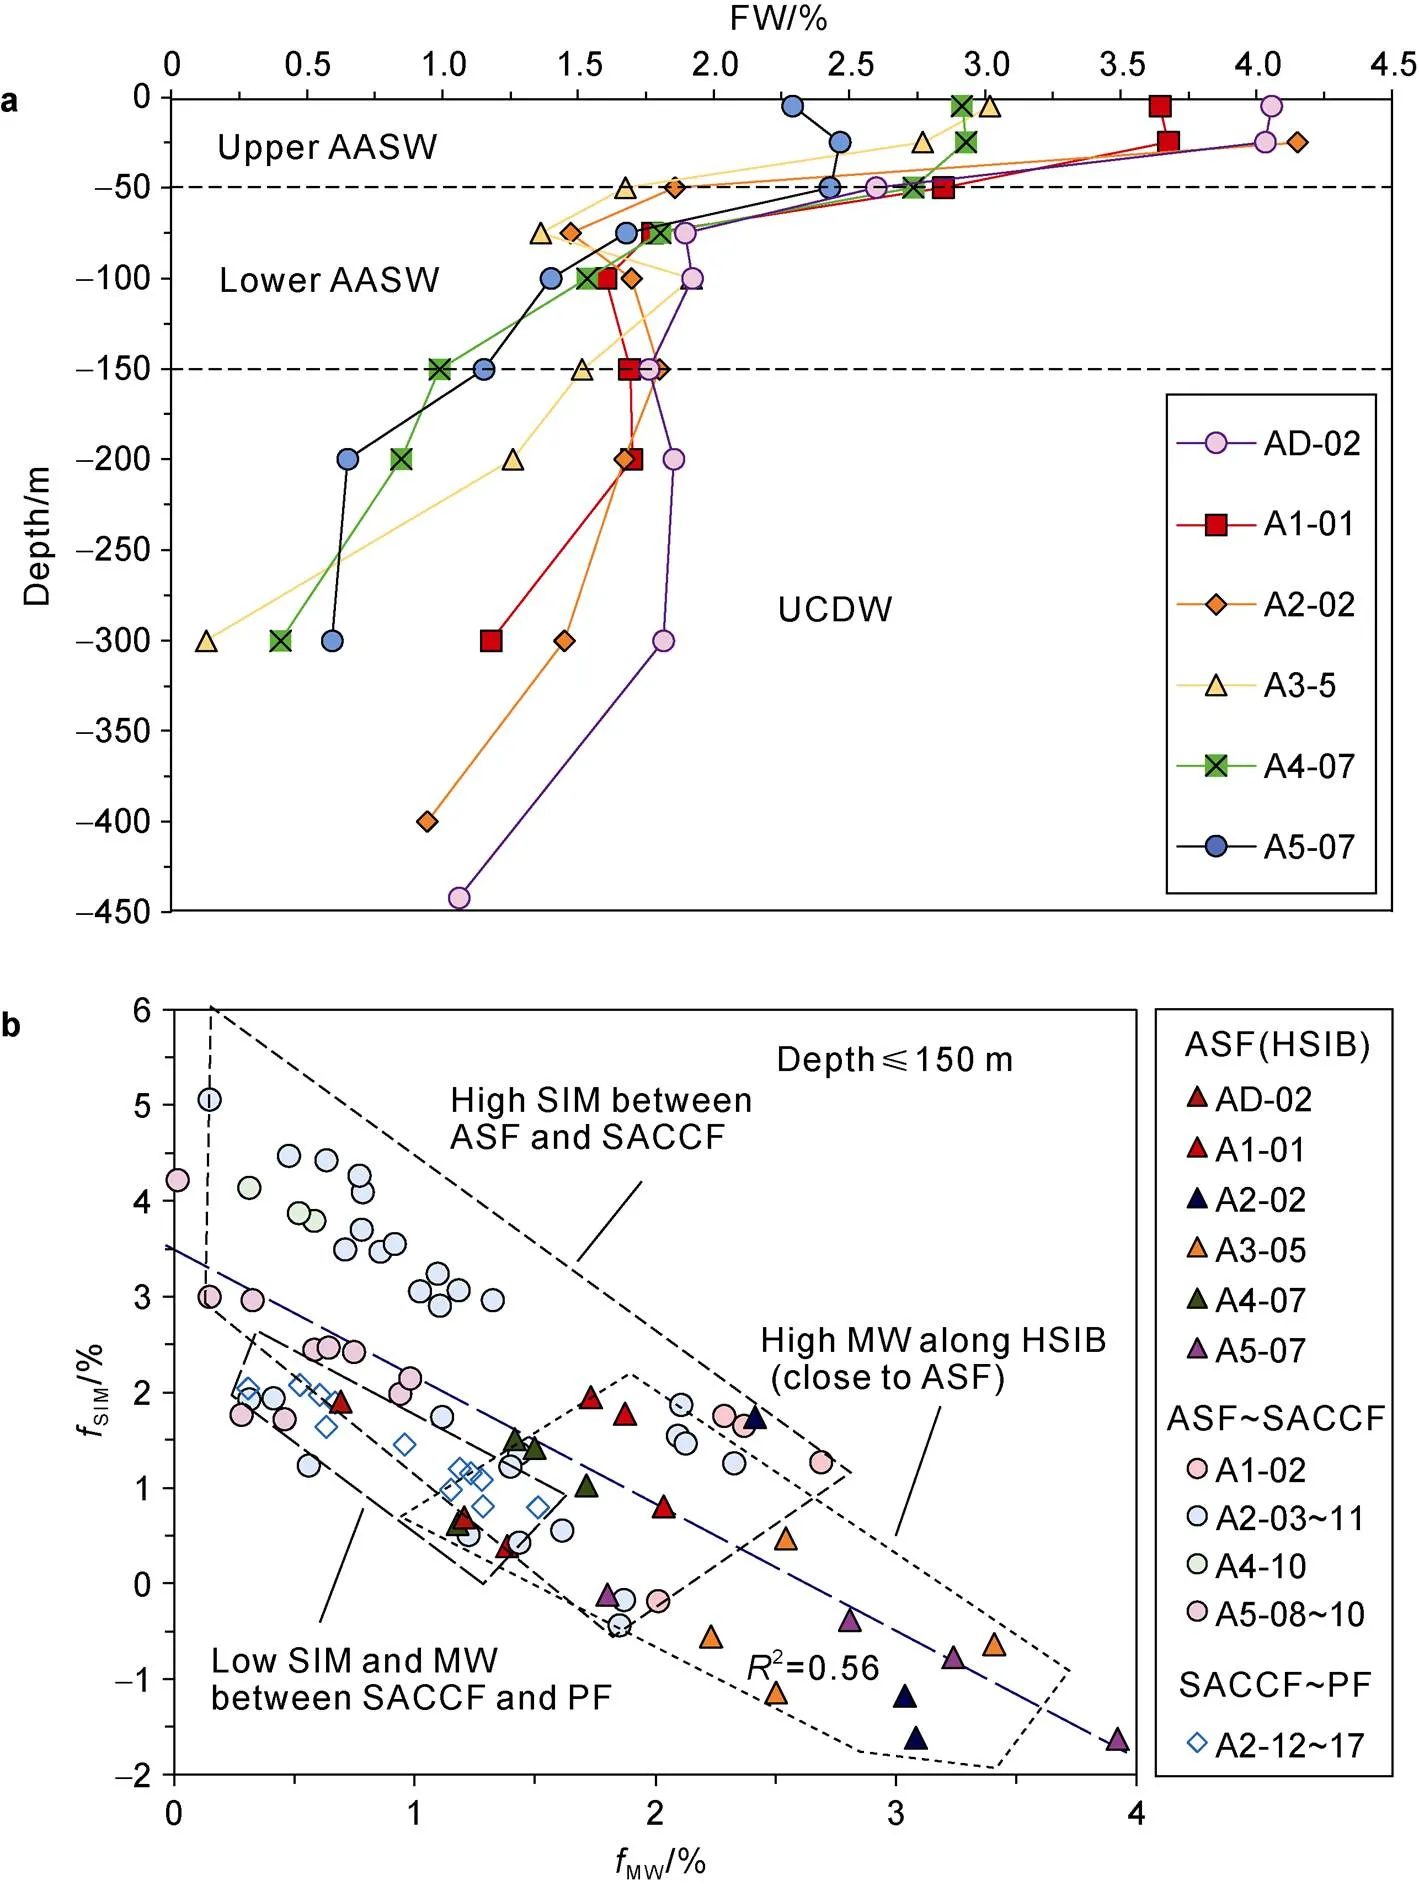
Figure 5 Freshwater (FW) distribution in the upper western Amundsen Sea. a, FW (sum of meteoric water (MW) and sea ice meltwater (SIM)) percent values in different water masses of the upper (<400 m) HSIB; b, Plot of MW and SIM percent values in the AASW layer (<150 m), showing different characteristics in zones divided by various fronts.
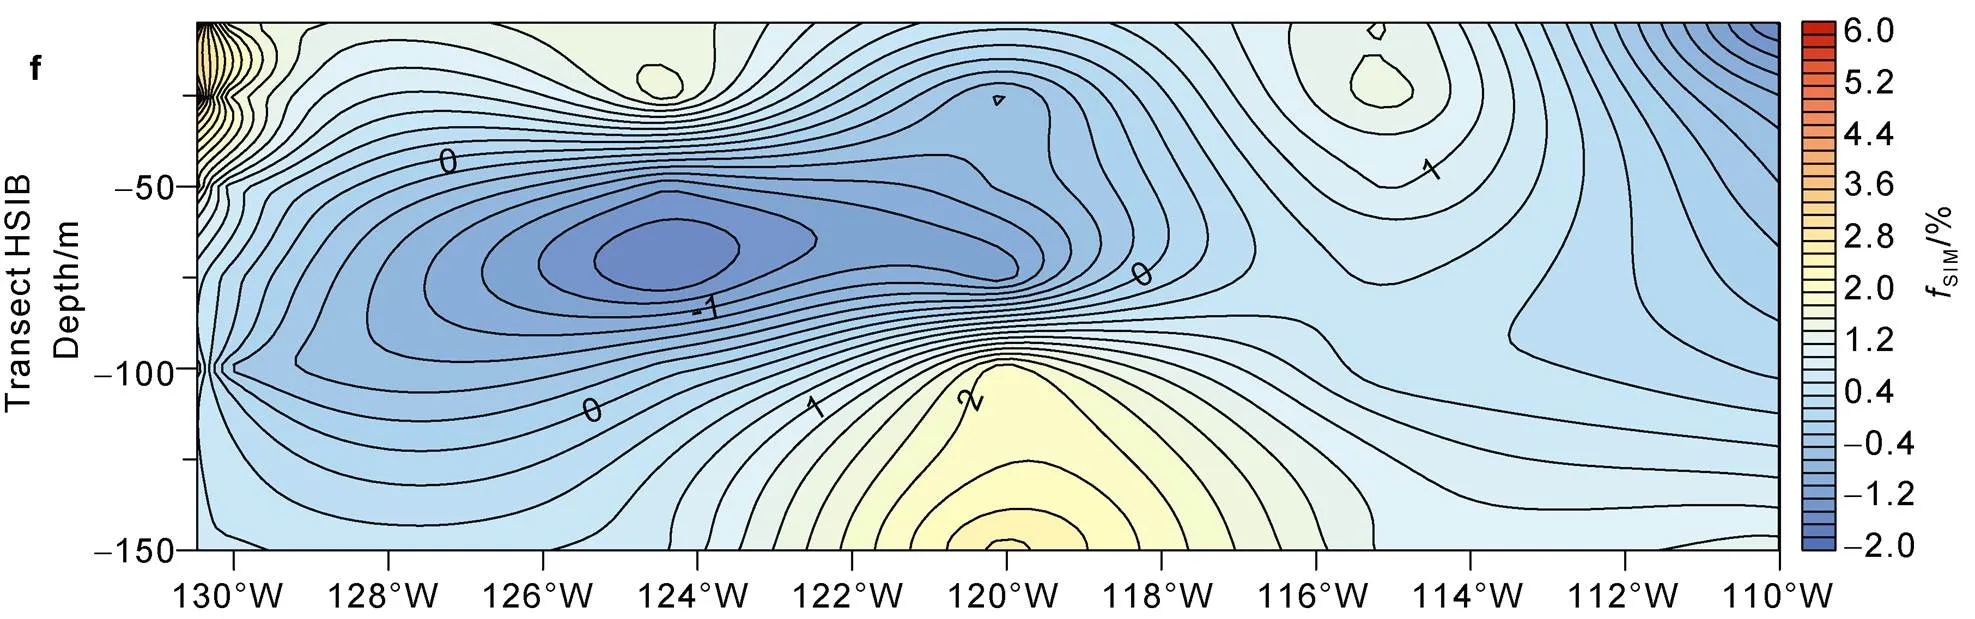
Figure 6 Vertical distributions of freshwater (FW) (sum of meteoric water (MW) and sea ice meltwater (SIM)), MW and SIM percent values in the AASW layer (<150 m) of transects A2 and HSIB.
Pronounced gradients of the measured physicochemical properties were organized into four fronts separating water zones across the northern and southern regions of transect A2 (Figure 4). The steep isopleths at ~61°S indicated the existence of the PF, which is located within the ACC and is a deep-reaching front. The 2 °C isotherm, which is considered to represent the PF, was identified at this location (Figure 5a) and is consistent with most regions of the Pacific Sector of the Southern Ocean (Talley et al., 2011). The 0 °C isotherm, as a practical indicator of the SACCF, was found in the region of ~65°S in transect A2 (Figure 4a). The low-DO waters found at ~71°S in the upper ocean (Figure 4c), possibly indicate the extent of influence of upwelled UCDW. The very cold dense water with remarkably low isotopic ratios at the southernmost region of transect A2 is representative of the ASF, which was very close to the HSIB transect and extended below the depth of 400 m. The SB front was not well defined in this study.
The AASW, characterized as cold and fresh with low δD and δ18O values was identified in the upper 150 m of the waters between the SB and PF in transect A2 (Figures 3, 4, 5 and 7). The AASW could be divided into Upper AASW (UAASW) and Lower AASW (LAASW) based on the distinct thermocline and halocline at the depth of ~50 m (Figure 2b). These two water masses are usually called Antarctic Summer Surface Water and Winter Water (WW; characterized by the vertical temperature minimum), respectively. The UAASW, with uniform temperature and salinity as well as low isotopic ratios, is considered the result of summer melting of ice shelves and sea ice. The LAASW (characterized by relatively high isotopic ratios and salinity) was found beneath the UAASW, which is defined as the remnant of cold surface water from the previous winter (Talley et al., 2011). The saltier nature of this layer might be influenced by continuously upwelled UCDW and/or brine rejection during the formation of the preceding winter sea ice. Generally, the AASW represents the freshest waters of the Antarctic’s marginal seas with salinity and temperature in the range of 33.0–34.5 and −1.8 to 0.6 °C, respectively. The δD and δ18O values showed a trend of increase from the UAASW (−4.45‰, −0.45‰ on average) to the LAASW (−0.38‰, −0.36‰ on average) (Figure 4).
A boundary between the AASW and the UCDW, which was characterized by rapidly changing isolines toward the continental slope of all the physicochemical properties measured in this study (Figure 4) and extended to the deep layers south of the SB (~71°–73°S), was connected with the continental shelf waters. The northern part of this boundary (~66°–71°S) was characterized by approximately horizontal thermocline (Figure 5a), halocline (Figure 5b), and large vertical gradient of DO at the >100-m depth. Owing to the location in the offshore region, some studies have previously classified the water mass upper the boundary as part of the AASW (Whitworth et al., 1998). The formation of it is attributed to Ekman downwelling driven by easterly winds and to downward penetration of dense shelf waters (Tomczak and Godfrey, 1994; Talley et al., 2011). The sharp boundary of the water mass indicates the encounter between the cold and fresh shelf water regime and the warm and saline CDW.
5.1.2 Upwelling of UCDW in the Amundsen Sea
The robust features of temperature, salinity, DO, and isotopic ratios established the spatial extent of the upwelled UCDW in transect A2 (Figures 4 and 7). Certain clearly discernible anomalies of these properties (except temperature) detected in the upper waters reflect the influence of UCDW between 68°S and 71°S (Figure 5).
An evident signal of UCDW was identified at the depth of 150-m based on temperature and DO, where isotherms higher than 0 ºC and contours lower than 230 μmol·L−lshowed a belt-like distribution at ~69°S (Figures 3a and 3c). Although the temperatures at 5 and 50 m were very low, the relatively high salinity and low DO near the continent indicate the possibility that UCDW could reach this layer (Figures 3a and 3c). Both δD and δ18O synchronously demonstrated higher values in this belt region (Figures 3d and 3e).
The upwelled CDW was more evident at the depth of300-m north of 72°S in the western Amundsen Sea, where the temperatures were mostly higher than 0.2 °C, salinities were higher than 34.5, and DO was lower than 220 μmol·L−l(Figure 3). The higher values of the isotopic ratios were distributed mainly north of 72°S. Similar to the 150-m layer, the 300-m layer properties indicate that the influence of CDW was greater in the eastern part than in the western part (Figure 3). It should be noted that the significantly lower temperature, salinity, and isotopic ratios but higher DO in the western region south of 72°S might reflect the influence of meltwater from the GIS (Jacobs et al., 2012; Rignot et al., 2013; Wei et al., 2019) (Figure 1). Meltwater from this ice shelf is likely to flow westward with the coastal current driven by the easterly wind, as revealed in numerical model results (Nakayama et al., 2014), and might even contribute to the Ross Sea shelf waters (Jacobs et al., 2002).
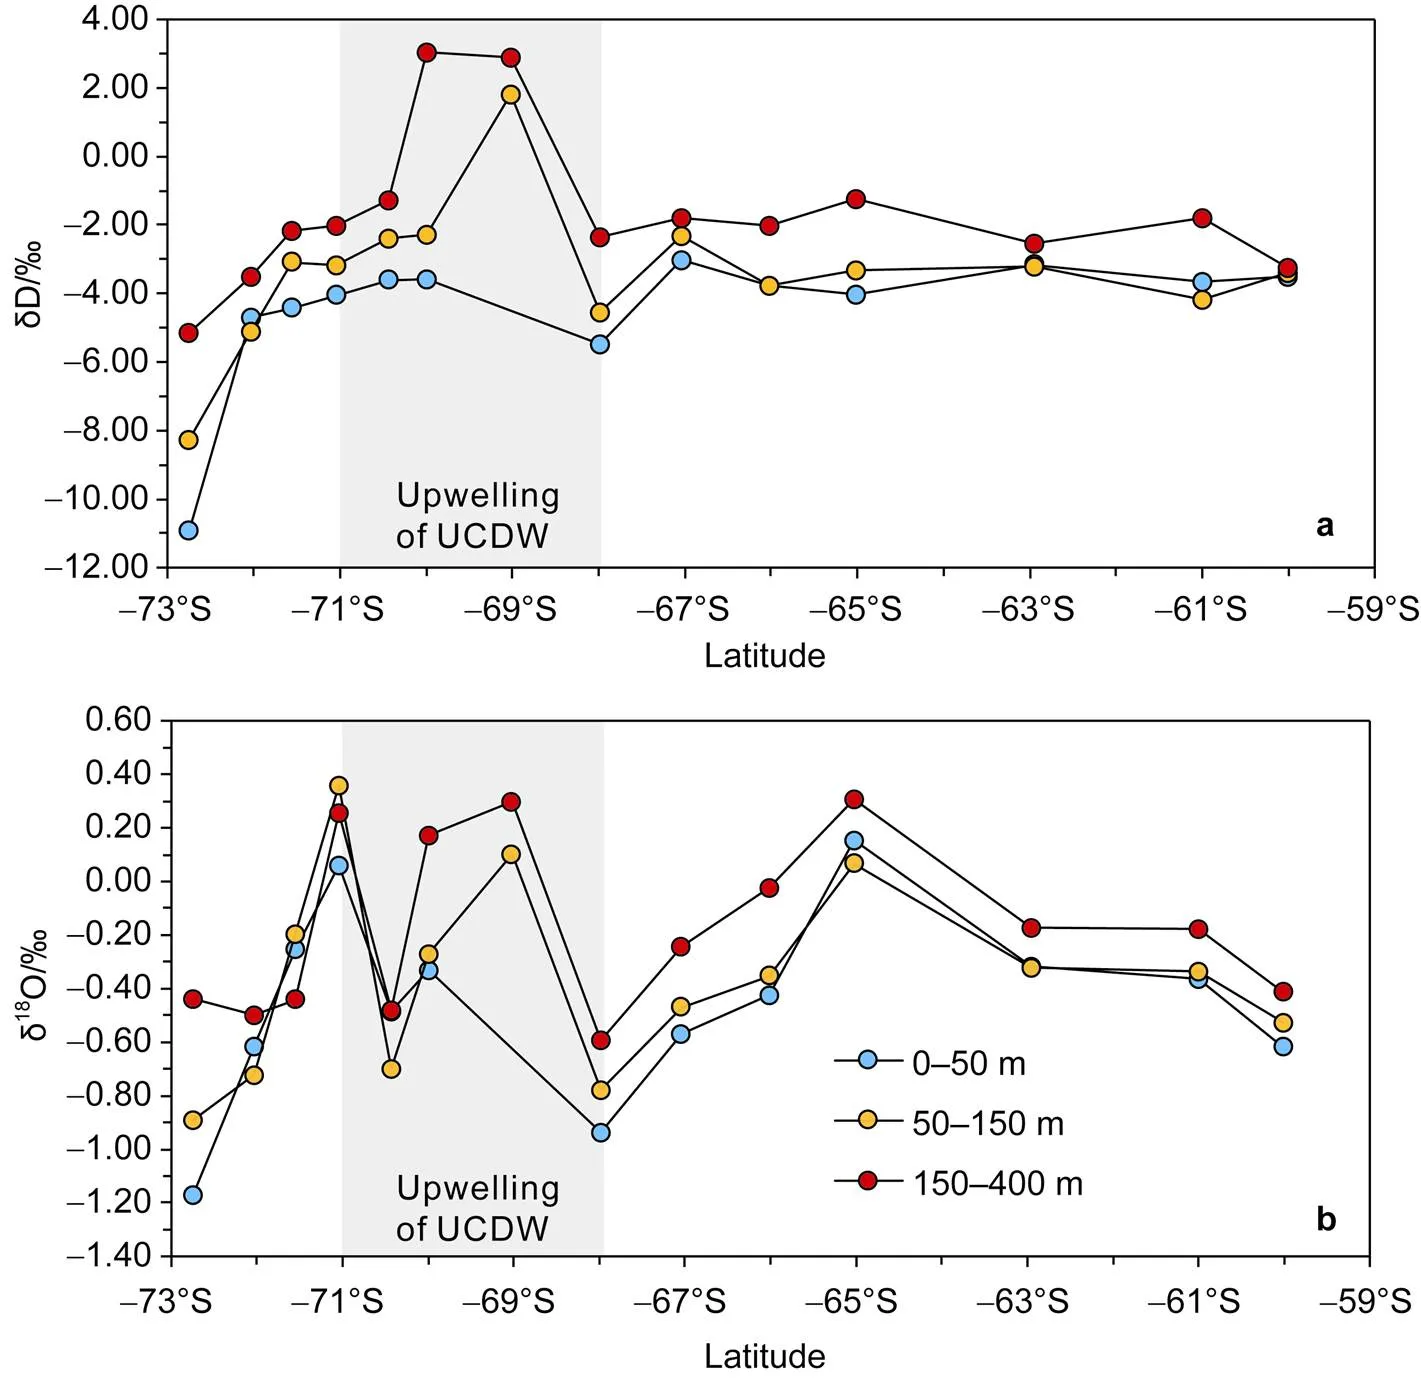
Figure 7 Average of hydrogen (δD, a) and oxygen (δ18O, b) isotopic ratios of different layers (0–50 m, 50–150 m, and 150–400 m) in the upper A2 transect. The gray shading represents the region of upwelled UCDW.
5.1.3 Controls on water structure of the upper Amundsen sea
Ice shelf mass loss, which includes iceberg calving, basal melting, topside sublimation, and wind drift, is an important source of MW that is responsible for the formation of continental shelf water regimes and governs the freshwater budget of the upper Amundsen Sea (Merino et al., 2018; Thompson et al., 2018). The increases in ice shelf melting and ice sheet mass loss in recent decades in West Antarctica should have had considerable influence on the water structure in the Antarctic marginal seas (Jacobs et al., 2011; Pritchard et al., 2012; Bintanja et al., 2013). The differences observed in many properties between western and eastern regions could be explained by different melting rates and specific meltwater pathways (e.g. more meltwater flows to the west) (Dutrieux et al., 2014; Joughin et al., 2014; Silvano et al., 2018). Lower values of both δD and δ18O in inshore areas than in the north also reflect meltwater inputs of ice shelves into continental margins.
Sea ice was widely starting to form in the surface layer during the expedition period (at the beginning of austral autumn). It corresponded to the report by the National Snow and Ice Data Center (www.nsidc.org) at the same time, showing that the extent of sea ice cover was greater in the eastern area than in the west. Regions with higher buoyant meltwater could enhance the formation of sea ice (Bintanja et al., 2013), and the ASE is considered the area of West Antarctica with a markedly high melting rate (Pritchard et al., 2012). Therefore, different rates of melting of ice shelves possibly impacted the distribution of sea ice in adjacent areas. Brine with lower δD and δ18O values is rejected during sea ice formation and mixed with the surface waters. The water in the eastern region displayed a saltier characteristic than that in the west in the upmost layer (5 m) (Figure 3). Additionally, there were many polynyas near the continent (Gerringa et al., 2012; Lee et al., 2016; St-Laurent et al., 2017) where strong wind forcing (westward in inshore regions) caused sea ice motion and periodic in situ formation of new sea ice. These processes promoted higher rates of sea ice formation and brine rejection. With increasing depth, the supply of brine decreased, while the influence of upwelled UCDW became progressively apparent. Thus, the coastal waters were far more saline and lower in DO at the lower depth of 50 m (Figure 3). Furthermore, the isotopic compositions indicated that sea ice melt generated in the preceding summer might be submerged to lower parts after mixing with remnant WW and UCDW below (Figure 4).
In contrast, the wind changes from westerly to easterly between 65°S and 70°S (Tomczak and Godfrey, 1994), which might induce the surface current in this region. In conjunction with Ekman transport, as well as the Antarctic slope currents in this area (Thompson et al., 2018; Assmann et al., 2019), interior mixing must be acting here. Thus, the shift of wind direction and strong hydrodynamics possibly induce many anomalies of properties in Figure 3.
Notably, there are many bathymetric troughs (e.g., the Dotson Trough) along the eastern continental slope of the Amundsen Sea (Nitsche et al., 2007; Alley et al., 2016; St-Laurent et al., 2017; Kim et al., 2018; Assmann et al., 2019), which are beneficial to the intrusion processes of CDW. Consequently, regional bathymetry is an important influencing factor of water structure in this area.
5.2 Quantified proportions of freshwater in the upper ocean of the Amundsen Sea
5.2.1 Distribution of freshwater in the upper meridional Transect A2
Significant negative correlation was found between theMWandSIMin the AASW layer, where MW- and SIM-dominated freshwater occupy different positions (Figure 5b). For the AASW, waters with higher MW proportions were distributed mainly at the southmost region in Transect A2 (Figure 6b). The proportion of FW between ~68°S and 71°S was obviously lower than that of both the southern and the northern sides of the region (Figure 6a), indicating upwelling of UCDW (Figure 7). Therefore, upwelling UCDW might act as a substantial barrier to the northward flow of MW. It should be noted that the abnormally high proportion of MW at ~68°S could be interpreted as the zonal circulation.
To the north of the SACCF (~64°S to~65°S), the MW and SIM contents both demonstrated rapid decline, reflecting the diminishing influence of freshwater from ice shelves and sea ice in this region (Figures 6b and 6c). In fact, MW accounted for <1% of seawater north of 65°S. Storms and precipitation are ubiquitous within the ACC region and its periphery, but the proportions of MW derived from these processes should be much lower than the supply from ice shelf melting (Tomczak and Godfrey, 1994; Talley et al., 2011; Paolo et al., 2015).
The proportion of SIM can change owing to seasonal variation, where SIM is induced during spring–summer and sea ice is produced in autumn–winter. High proportions of SIM were distributed in the zone between the ASF and SACCF (i.e., mostly on the northern side of the HSIB), indicating ubiquitous melting of sea ice in this region.
The AASW in the Amundsen Sea was distributed in the upper 150 m, while the greater proportion (>3%) of FW lay mainly in the 50-m layer. As SIM was concentrated in the surface layer at approximately 50-m depth (Figure 6c) and MW reached depths of >100 m (Figure 6b), we infer that FW is attributed primarily to the contribution of SIM during this season.
5.2.2 Distribution of freshwater along the HSIB
To understand the water structure in the region of seasonal ice melt and the freshwater distribution at the sea ice boundary, we evaluated the HSIB transect, which is where strong interactions between the ocean and sea ice occur. The location of the HSIB is close to the ASF in the west and close to the SB in the east (Figure 1).
The eastern Amundsen Sea has a wider continental shelf than the western side (Nitsche et al., 2007), and there is a longer distance between the HSIB and ice shelf fronts on the continental shelf. Waters in the eastern part were remarkably warmer, saltier, had lower DO and higher isotopic ratios than those in the western region along the HSIB (Figure 4). Although this characteristic was clearly attributable to differences in the distance from the HSIB to the ice shelf fronts between the two parts, stronger interfusion of upwelled UCDW at the eastern HSIB should be paid more attentions. The pyramidal pattern of isotopic compositions in the eastern part possibly reflected the upwelling of CDW through the troughs on the seafloor, confirming the important influence of regional bathymetry (Figure 4).
High proportions of MW along the HSIB indicated that ice shelves (e.g., the GIS, Dotson Ice Shelf, and Thwaites Ice Shelf) along the Amundsen Sea coastline play an important role in contributing freshwater to the oceanic surface waters (Jacobs et al., 2012; Rignot et al., 2013; Dutrieux et al., 2014). The highest values of MW proportions are at the upper eastern part, suggesting high outputs of melt water from ice shelves in ASE. However, the distribution of FW (MW and SIM) showed a different characteristic with a greater proportion in the western HSIB than in the eastern HSIB (Figure 6d). Apart from the differences in distance to the continent that result in variations in the proportion of FW, we think that either more SIM input into the western part or more sea ice formation in the eastern part might also have an effect. As the eastern Amundsen Sea has generally had much higher amounts of sea ice than the western side during the winters of recent decades (Bintanja et al., 2013; Merino et al., 2018), the differences are unlikely to be the result of greater SIM input into the western HSIB. Furthermore, the survey was conducted in the season when sea ice formation begins. Therefore, the higher rate of sea ice formation possibly resulted in the lower proportion of freshwater in the eastern Amundsen Sea.
The proportion of FW decreased substantially with depth at depths greater than 150 m at eastern sites (e.g., A3-05, A4-07, and A5-07 in Figure 1). However, at sites close to the continent (e.g., AD-02, A1-01, and A2-02), the change in the proportion of FW with depth was largely insignificant until the depth of 300 m, below which it decreased rapidly (Figure 5a). We infer that upwelling UCDW possibly played an important role in the variation of FW in the lower parts (beneath ~150 m).
Generally, AASW is the primary reservoir of FW derived from both ice shelves and sea ice melting, while UAASW accounts for remarkably more FW than the underlying LAASW. During the expedition period, sea ice melting was not evident along the HSIB between 50 and 100 m, while sea ice formation had considerable influence on the freshwater distribution in these layers.
5.3 The WW in the western Amundsen Sea
The WW, which is thought to be formed in winter by strong mixing and wind-induced stirring, is defined as having temperature of approximately −1.6 °C and salinity of approximately 34 (Wåhlin et al., 2010; Kim et al., 2016). As discussed above, the proportion of MW increased at 71°S along transect A2 owing to the high outflow of ice shelf meltwater (Figure 6b). Correspondingly, mostSIMhad negative values below the 50-m layer in this region, suggesting the formation of sea ice during autumn–winter (Figure 6c). As WW is also characterized by low δ18O and δD values (Randall-Goodwin et al., 2015), the occurrence of WW was consistent with the rapid decrease of δ18O and δD south of 71°S (Figure 7). The higher average δ18O and δD values found between depths of 150 and 400 m than in the upper layers, indicate that WW should mainly occupy the layers between 50 and 150 m from 71°S to 73°S along Transect A2. The area adjacent to the north of 71°S is a region of upwelling UCDW. Thus, the incoming UCDW was modified by mixing of WW and AASW in this region.
The lower values of both δ18O and δD between 120°W and 130°W along transect HSIB, particularly in the upper 150 m, indicate input of MW but also correspond to the location of the GIS. As found in previous studies, increased melting of the ice shelves surrounding Antarctica can promote the expansion of sea ice in the circumjacent area (Bintanja et al., 2013; Rignot et al., 2013). However, the negative values ofSIMfound in this region, with a peak value at ~124°W below the depth of 50 m, suggest release of brine during sea ice formation. Given that brine is also characterized by lower isotopic values, we infer that the lower δ18O and δD values of seawater in the upper 150 m between 120°W and 130°W along transect HSIB should be the result of MW entrained into the WW layers by brine-induced deep mixing. The presence of WW is not significant in the eastern part of HSIB, most likely because of the long distance from the continent, which means that it might become distributed more widely across the continental shelf.
In summary, WW is located mainly at depths of between 50 and 150 m. It might be distributed within a limited range in the meridional direction (A2), and it is located mainly to the south of 71°S. However, the wider distribution of WW in the zonal direction (HSIB) is largely associated with melting of ice shelves.
6 Conclusions
This study analyzed δD and δ18O isotopic data and CTD data to gain insights into the upper structure and distribution of freshwater (MW and SIM) in the Amundsen Sea. Several fronts (i.e., the PF, SACCF, SB, and ASF) were identified on the basis of the data. It was established that AASW, characterized as cold and fresh with low δD and δ18O values, was distributed mainly in the upper 150 m between the ASF and PF, where it was likely influenced by upwelled UCDW between 68°S and 71°S, whereas WW mainly occupied the layers between 50 and 150 m to the south of 71°S in the western Amundsen Sea. We assumed that AASW was mainly the result of mixing between MW, SIM, and CDW. Therefore, we developed a three-endmember mixing model to address the freshwater balance between MW and SIM. According to the results of this model, we concluded that the relatively higher proportion (>3%) of freshwater generally lay in the upper 50 m and expanded to ~65°S in the meridional direction. Along the HSIB, the higher proportion of freshwater was clearly distributed in the western region, indicating the effects of GIS melting and the narrow continental shelf in the western Amundsen Sea. Basal melting of ice shelves, seasonal alternation of sea ice melt/formation, and wind forcing are likely important influencing factors governing the water structure and spatial distribution of freshwater in the Amundsen Sea.
Acknowledgments This work was supported by the Natural Science Foundation of China (Grant no. 41806229) and the Ministry of Natural Resources of the People’s Republic of China (Impact and Response of Antarctic Seas to Climate Change, Grant no. IRASCC 02-04-01). We would like to thank all the onboard scientists and crew for their help during the 34thCHINARE in 2017/2018. We are grateful to M.S. Pengfei Liu for helping in the clean lab and for the beneficial discussions during the preparation of this manuscript. We appreciate Prof. Jiuxin Shi who was a reviewer of this article, one anonymous reviewer, and Associate Editor, Dr. Anna Wåhlin for their valuable suggestions and comments that improved this article.
Alley K E, Scambos T A, Siegfried M R, et al. 2016. Impacts of warm water on Antarctic ice shelf stability through basal channel formation. Nat Geosci, 9(4): 290-293, doi:10.1038/ngeo2675.
Alley R B, Anandakrishnan S, Christianson K, et al. 2015. Oceanic forcing of ice-sheet retreat: west Antarctica and more. Annu Rev Earth Planet Sci, 43(1): 207-231, doi:10.1146/annurev-earth-060614-105344.
Arneborg L, Wåhlin A K, Björk G, et al. 2012. Persistent inflow of warm water onto the central Amundsen shelf. Nat Geosci, 5(12): 876-880, doi:10.1038/ngeo1644.
Assmann K M, Darelius E, Wåhlin A K, et al. 2019. Warm circumpolar deep water at the western Getz Ice Shelf front, Antarctica. Geophys Res Lett, 46(2): 870-878, doi:10.1029/2018GL081354.
Assmann K M, Hellmer H H, Jacobs S S. 2005. Amundsen Sea ice production and transport. J Geophys Res: Oceans, 110(C12): C12013, doi:10.1029/2004JC002797.
Bamber J L, Riva R E M, Vermeersen B L A, et al. 2009. Reassessment of the potential sea-level rise from a collapse of the West Antarctic Ice Sheet. Science, 324(5929): 901-903, doi:10.1126/science.1169335.
Berman E S, Levin N E, Landais A, et al. 2013. Measurement of δ18O, δ17O, and17O-excess in water by off-axis integrated cavity output spectroscopy and isotope ratio mass spectrometry. Anal Chem, 85(21): 10392-10398, doi:10.1021/ac402366t.
Billen G, Becquevort S. 1991. Phytoplankton-bacteria relationship in the Antarctic marine ecosystem. Polar Res, 10(1): 245-254, doi:10.3402/ polar.v10i1.6743.
Bintanja R, van Oldenborgh G J, Drijfhout S S, et al. 2013. Important role for ocean warming and increased ice-shelf melt in Antarctic sea-ice expansion. Nat Geosci, 6(5): 376-379, doi:10.1038/ngeo1767.
Buizert C, Cuffey K M, Severinghaus J P, et al. 2015. The WAIS Divide deep ice core WD2014 chronology – Part 1: Methane synchronization (68–31 ka BP) and the gas age–ice age difference. Clim Past, 11(2): 153-173, doi:10.5194/cp-11-153-2015.
Cai P H, Huang Y, Chen M, et al. 2003. Glacial meltwater and sea ice meltwater in the Prydz Bay, Antarctica. Sci China Ser D, 46(1): 50-61, doi:10.1360/03yd9005.
Davis P E D, Jenkins A, Nicholls K W, et al. 2018. Variability in basal melting beneath Pine Island ice shelf on weekly to monthly timescales. J Geophys Res: Oceans, 123(11): 8655-8669, doi:10.1029/2018J C014464.
Dutrieux P, de Rydt J, Jenkins A, et al. 2014. Strong sensitivity of Pine Island ice-shelf melting to climatic variability. Science, 343(6167): 174-178, doi:10.1126/science.1244341.
Fretwell P, Pritchard H D, Vaughan D G, et al. 2013. Bedmap2: improved ice bed, surface and thickness datasets for Antarctica. Cryosphere, 7(1): 375-393, doi:10.5194/tc-7-375-2013.
Gerringa L J A, Alderkamp A C, Laan P, et al. 2012. Iron from melting glaciers fuels the phytoplankton blooms in Amundsen Sea (Southern Ocean): Iron biogeochemistry. Deep Sea Res Part II: Top Stud Oceanogr, 71-76: 16-31, doi:10.1016/j.dsr2.2012.03.007.
Goosse H, Lefebvre W, Montety A, et al. 2009. Consistent past half-century trends in the atmosphere, the sea ice and the ocean at high southern latitudes. Clim Dyn, 33(7-8): 999-1016, doi:10.1007/s00382- 008-0500-9.
Haumann F A, Gruber N, Münnich M, et al. 2016. Sea-ice transport driving Southern Ocean salinity and its recent trends. Nature, 537(7618): 89-92, doi:10.1038/nature19101.
Hellmer H H. 2004. Impact of Antarctic ice shelf basal melting on sea ice and deep ocean properties. Geophys Res Lett, 31(10): L10307, doi:10.1029/2004GL019506.
Hopwood M J, Carroll D, Höfer J, et al. 2019. Highly variable iron content modulates iceberg-ocean fertilisation and potential carbon export. Nat Commun, 10: 5261, doi:10.1038/s41467-019-13231-0.
Jacobs S, Jenkins A, Hellmer H, et al. 2012. The Amundsen Sea and the Antarctic Ice Sheet. Oceanography, 25(3): 154-163, doi:10.5670/ oceanog.2012.90.
Jacobs S S, Giulivi C F, Mele P A. 2002. Freshening of the Ross Sea during the late 20th century. Science, 297(5580): 386-389, doi:10.1126/science.1069574.
Jacobs S S, Jenkins A, Giulivi C F, et al. 2011. Stronger ocean circulation and increased melting under Pine Island Glacier ice shelf. Nat Geosci, 4(8): 519-523, doi:10.1038/ngeo1188.
Jenkins A, Dutrieux P, Jacobs S S, et al. 2010. Observations beneath Pine Island Glacier in West Antarctica and implications for its retreat. Nat Geosci, 3: 468-472, doi: 10.1038/ngeo890.
Joughin I, Alley R B. 2011. Stability of the West Antarctic Ice Sheet in a warming world. Nat Geosci, 4(8): 506-513, doi:10.1038/ngeo1194.
Joughin I, Smith B E, Medley B. 2014. Marine ice sheet collapse potentially under way for the Thwaites Glacier Basin, West Antarctica. Science, 344(6185): 735-738, doi:10.1126/science.1249055.
Kim B, Lee S, Kim M, et al. 2018. An investigation of gas exchange and water circulation in the Amundsen Sea based on dissolved inorganic radiocarbon. Geophys Res Lett, 45(22): 12368-12375, doi:10.1029/ 2018GL079464.
Kim C S, Kim T W, Cho K H, et al. 2016. Variability of the Antarctic coastal current in the Amundsen Sea. Estuar Coast Shelf Sci, 181: 123-133, doi:10.1016/j.ecss.2016.08.004.
Kim I, Hahm D, Rhee T S, et al. 2016. The distribution of glacial meltwater in the Amundsen Sea, Antarctica, revealed by dissolved helium and neon. J Geophys Res: Oceans, 121(3): 1654-1666, doi:10.1002/2015JC011211.
Kim M, Hwang J, Kim H J, et al. 2015. Sinking particle flux in the sea ice zone of the Amundsen Shelf, Antarctica. Deep Sea Res Part I: Oceanogr Res Pap, 101: 110-117, doi:10.1016/j.dsr.2015.04.002.
Lee Y, Yang E J, Park J, et al. 2016. Physical-biological coupling in the Amundsen Sea, Antarctica: Influence of physical factors on phytoplankton community structure and biomass. Deep Sea Res Part I: Oceanogr Res Pap, 117: 51-60, doi:10.1016/j.dsr.2016.10.001.
Marshall J, Speer K. 2012. Closure of the meridional overturning circulation through Southern Ocean upwelling. Nat Geosci, 5(3): 171-180, doi:10.1038/ngeo1391.
Meredith M P, Brandon M A, Wallace M I, et al. 2008. Variability in the freshwater balance of northern Marguerite Bay, Antarctic Peninsula: results from δ18O. Deep Sea Res Part II: Top Stud Oceanogr, 55(3-4): 309-322, doi:10.1016/j.dsr2.2007.11.005.
Meredith M P, Ducklow H W, Schofield O, et al. 2016. The interdisciplinary marine system of the Amundsen Sea, Southern Ocean: Recent advances and the need for sustained observations. Deep Sea Res Part II: Top Stud Oceanogr, 123: 1-6, doi: 10.1016/j.dsr2.2015. 12.002.
Meredith M P, Stammerjohn S E, Venables H J, et al. 2017. Changing distributions of sea ice melt and meteoric water west of the Antarctic Peninsula. Deep Sea Res Part II: Top Stud Oceanogr, 139: 40-57, doi:10.1016/j.dsr2.2016.04.019.
Merino N, Jourdain N C, Le Sommer J, et al. 2018. Impact of increasing Antarctic glacial freshwater release on regional sea-ice cover in the Southern Ocean. Ocean Model, 121: 76-89, doi:10.1016/j.ocemod. 2017.11.009.
Morrison A K, Frölicher T L, Sarmiento J L. 2015. Upwelling in the Southern Ocean. Phys Today, 68(1): 27-32, doi:10.1063/PT.3.2654.
Nakayama Y, Timmermann R, Rodehacke C B, et al. 2014. Modeling the spreading of glacial meltwater from the Amundsen and Bellingshausen seas. Geophys Res Lett, 41(22): 7942-7949, doi:10.1002/2014GL061600.
Narayanan A, Gille S T, Mazloff M R, et al. 2019. Water mass characteristics of the Antarctic margins and the production and seasonality of dense shelf water. J Geophys Res: Oceans, 124(12): 9277-9294, doi:10.1029/2018JC014907.
Nitsche F O, Jacobs S S, Larter R D, et al. 2007. Bathymetry of the Amundsen Sea continental shelf: Implications for geology, oceanography, and glaciology. Geochem Geophys Geosystems, 8(10): Q10009, doi:10.1029/2007GC001694.
Ohshima K I, Fukamachi Y, Williams G D, et al. 2013. Antarctic Bottom Water production by intense sea-ice formation in the Cape Darnley Polynya. Nat Geosci, 6(3): 235-240, doi:10.1038/ngeo1738.
Orsi A H, Whitworth T III, Nowlin W D Jr. 1995. On the meridional extent and fronts of the Antarctic Circumpolar Current. Deep Sea Res Part I: Oceanogr Res Pap, 42(5): 641-673, doi:10.1016/0967- 0637(95)00021-W.
Paolo F S, Fricker H A, Padman L. 2015. Volume loss from Antarctic ice shelves is accelerating. Science, 348(6232): 327-331, doi:10.1126/ science.aaa0940.
Pellichero V, Sallée J B, Chapman C C, et al. 2018. The Southern Ocean meridional overturning in the sea-ice sector is driven by freshwater fluxes. Nat Commun, 9: 1789, doi:10.1038/s41467-018-04101-2.
Pritchard H D, Ligtenberg S R M, Fricker H A, et al. 2012. Antarctic ice-sheet loss driven by basal melting of ice shelves. Nature, 484(7395): 502-505, doi:10.1038/nature10968.
Randall-Goodwin E, Meredith M P, Jenkins A, et al. 2015. Freshwater distributions and water mass structure in the Amundsen Sea Polynya region, Antarctica. (2015-08-07). Elem: Sci Anthropocene, 3: 000065, doi:10.12952/journal.elementa.000065.
Rignot E, Jacobs S, Mouginot J, et al. 2013. Ice-shelf melting around Antarctica. Science, 341(6143): 266-270, doi:10.1126/science.1235798.
Rignot E, Mouginot J, Morlighem M, et al. 2014. Widespread, rapid grounding line retreat of Pine Island, Thwaites, Smith, and Kohler glaciers, West Antarctica, from 1992 to 2011. Geophys Res Lett, 41(10): 3502-3509, doi:10.1002/2014GL060140.
Robertson R. 2013. Tidally induced increases in melting of Amundsen Sea ice shelves. J Geophys Res: Oceans, 118(6): 3138-3145, doi:10.1002/ jgrc.20236.
Schmidtko S, Heywood K J, Thompson A F, et al. 2014. Multidecadal warming of Antarctic waters. Science, 346 (6214): 1227-1231, doi:10.1126/science.1256117.
Schoof C. 2007. Ice sheet grounding line dynamics: Steady states, stability, and hysteresis. J Geophys Res: Earth Surf, 112(F3): F03S28, doi:10. 1029/2006JF000664.
Schroeder D M, Hilger A M, Paden J D, et al. 2018. Ocean access beneath the southwest tributary of Pine Island Glacier, West Antarctica. Ann Glaciol, 59(76pt1): 10-15, doi:10.1017/aog.2017.45.
Screen J A, Simmonds I. 2010. The central role of diminishing sea ice in recent Arctic temperature amplification. Nature, 464(7293): 1334-1337, doi:10.1038/nature09051.
Silvano A, Rintoul S R, Peña-Molino B, et al. 2018. Freshening by glacial meltwater enhances melting of ice shelves and reduces formation of Antarctic Bottom Water. Sci Adv, 4(4): eaap9467, doi:10.1126/ sciadv.aap9467.
Skvarca P, Rack W, Rott H, et al. 1999. Climatic trend and the retreat and disintegration of ice shelves on the Antarctic Peninsula: an overview. Polar Res, 18(2): 151-157, doi:10.3402/polar.v18i2.6568.
Spence P, Holmes R M, Hogg A M, et al. 2017. Localized rapid warming of West Antarctic subsurface waters by remote winds. Nat Clim Change, 7(8): 595-603, doi:10.1038/nclimate3335.
Stammerjohn S, Massom R, Rind D, et al. 2012. Regions of rapid sea ice change: an inter-hemispheric seasonal comparison. Geophys Res Lett, 39(6): L06501, doi:10.1029/2012GL050874.
St-Laurent P, Yager P L, Sherrell R M, et al. 2017. Pathways and supply of dissolved iron in the Amundsen Sea (Antarctica). J Geophys Res: Oceans, 122(9): 7135-7162, doi:10.1002/2017JC013162.
Stroeve J C, Serreze M C, Holland M M, et al. 2012. The Arctic’s rapidly shrinking sea ice cover: a research synthesis. Clim Change, 110(3-4): 1005-1027, doi:10.1007/s10584-011-0101-1.
Talley L D, Pickard G L, Emery W J, et al. 2011. Descriptive physical oceanography: an introduction. Sixth Edtion. London: Academic Press.
Thoma M, Jenkins A, Holland D, et al. 2008. Modelling Circumpolar Deep Water intrusions on the Amundsen Sea continental shelf, Antarctica. Geophys Res Lett, 35(18): L18602, doi:10.1029/2008GL034939.
Thompson A F, Stewart A L, Spence P, et al. 2018. The Antarctic slope current in a changing climate. Rev Geophys, 56(4): 741-770, doi:10.1029/2018RG000624.
Tomczak M, Godfrey J S. 1994. CHAPTER 6 – Antarctic oceanography//Tomczak M, Godfrey J S (Eds.). Regional Oceanography. Pergamon, Amsterdam: Butler & Tanner Ltd, 67-87.
Turner J, Comiso J C, Marshall G J, et al. 2009. Non-annular atmospheric circulation change induced by stratospheric ozone depletion and its role in the recent increase of Antarctic sea ice extent. Geophys Res Lett, 36(8): L08502, doi:10.1029/2009GL037524.
Turner J, Hosking J S, Marshall G J, et al. 2016. Antarctic sea ice increase consistent with intrinsic variability of the Amundsen Sea Low. Clim Dyn, 46(7-8): 2391-2402, doi:10.1007/s00382-015-2708-9.
Turner J, Phillips T, Hosking J S, et al. 2013. The Amundsen Sea low. Int J Climatol, 33(7): 1818-1829, doi:10.1002/joc.3558.
Turner J, Orr A, Gudmundsson G H, et al. 2017. Atmosphere–ocean–ice interactions in the Amundsen Sea Embayment, West Antarctica. Rev Geophys, 55(1): 235-276, doi:10.1002/2016RG000532.
Vaughan D G. 2008. West Antarctic Ice Sheet collapse – the fall and rise of a paradigm. Clim Change, 91(1-2): 65-79, doi:10.1007/s10584- 008-9448-3.
Wåhlin A K, Yuan X, Björk G, et al. 2010. Inflow of warm circumpolar deep water in the central Amundsen shelf. J Phys Oceanogr, 40(6): 1427-1434, doi:10.1175/2010jpo4431.1.
Walker D P, Brandon M A, Jenkins A, et al. 2007. Oceanic heat transport onto the Amundsen Sea shelf through a submarine glacial trough. Geophys Res Lett, 34(2): L02602, doi:10.1029/2006GL028154.
Walker D P, Jenkins A, Assmann K M, et al. 2013. Oceanographic observations at the shelf break of the Amundsen Sea, Antarctica. J Geophys Res: Oceans, 118(6): 2906-2918, doi:10.1002/jgrc.20212.
Wei W, Blankenship D D, Greenbaum JS, et al. 2019. Getz Ice Shelf melt enhanced by freshwater discharge from beneath the West Antarctic Ice Sheet. Cryosphere, 1-16, doi: 10.5194/tc-2019-170.
Whitworth T III, Orsi A H, Kim S J, et al. 1998. Water masses and mixing near the Antarctic slope front//Jacobs S S, Weiss R F (Eds.). Ocean, ice, and atmosphere: interactions at the Antarctic continental margin. Washington, D. C.: American Geophysical Union, 2013, 1-27, doi:10.1029/ar075p0001.
Zhang J L. 2007. Increasing Antarctic sea ice under warming atmospheric and oceanic conditions. J Clim, 20(11): 2515-2529, doi:10.1175/jcli4136.1.
Zunz V, Goosse H, Massonnet F. 2013. How does internal variability influence the ability of CMIP5 models to reproduce the recent trend in Southern Ocean sea ice extent? Cryosphere, 7(2): 451-468, doi:10.5194/tc-7-451-2013.
: Shao H B, He J F, Luo G F, et al.Characteristics of hydrogen/oxygen isotopes in water masses and implications for spatial distribution of freshwater in the Amundsen Sea, Southern Ocean. Adv Polar Sci, 2021, 32(3):221-238,doi: 10.13679/j.advps.2020.0037
27 November 2020;
2 September 2021;
30 September 2021
Corresponding author, E-mail:hejianfeng@pric.org.cn
10.13679/j.advps.2020.0037
杂志排行
Advances in Polar Science的其它文章
- The marine environmental evolution in the northern Norwegian Sea revealed by foraminifera during the last 60 ka
- Application of unmanned underwater vehicles in polar research
- An introduction to the riometer system deployed at China-Iceland joint Arctic observatory and its beam- forming correction method based on the preliminary data
- Different physiopsychological changes between AMS- susceptible and AMS-resistant pre-selected Antarctic expeditioners in Tibet
- Marine biogenic aerosols and their effects on aerosol- cloud interactions over the Southern Ocean: a review
- Utilization of clean energy and future trend of Antarctic research stations