An introduction to the riometer system deployed at China-Iceland joint Arctic observatory and its beam- forming correction method based on the preliminary data
2021-08-18HEFangHUZejunHUHongqiaoHUANGDehongYUYao
HE Fang, HU Zejun, HU Hongqiao, HUANG Dehong & YU Yao
An introduction to the riometer system deployed at China-Iceland joint Arctic observatory and its beam- forming correction method based on the preliminary data
HE Fang, HU Zejun, HU Hongqiao, HUANG Dehong & YU Yao
MNR Key laboratory for Polar Science, Polar Research Institute of China, Shanghai 200136, China
The China-Iceland joint Arctic observatory (CIAO) has formally been operating since October 18, 2018, and an imaging riometer system was deployed at CIAO in August 2019 for the conjunction observation purpose with the co-located ground-based all sky imager auroral observation system. The features of the riometer and antenna system are presented. The riometer’s beam-forming performance were evaluated with the analysis method introduced in detail. The analysis results showed that the mapping of beams was incorrectly ordered, and the correction has been made. The revised ordering result was reasonably verified and the analysis method was proved to be effective.
imaging riometer, beam forming, analysis method, mapping
1 Introduction
A riometer (relative ionospheric opacity meter) measures to what extent the cosmic background noise is absorbed by the ionosphere. Riometers are used, often in conjunction with other instruments, to study ionospheric processes which in turn relate to space weather. Most of the ionospheric absorption occurs in theregion of the ionosphere, primarily due to high energy particle precipitation (electron and protons) and ionization by UV and X rays. For riometry purposes the average height of absorbing layer is usually considered to be 90 km.

The China-Iceland joint Arctic observatory (CIAO) is located at Kárhóll (65.71°N, 17.37°W) in the northern part of Iceland, close to the municipality Laugar, and 45 minutes’ driving from Akureyri. Its geomagnetic latitude is ~ 65.5°, which makes it suitable for the ground-based observations of ionospheric response to magnetotail reconnection and energy transfer process after substorm commencement on the nightside.
2 Newly deployed riometers at CIAO
The CIAO riometer project was funded by Polar Research Institute of China (PRIC) in 2015. It was proposed to be used in conjunction with three-wavelength all-sky auroral imagers at CIAO to study nightside auroral precipitation processes by simultaneous observation at the same site.
The CIAO riometer installation was completed in August 2019. There are two riometers running simultaneously at the same site, i.e., a wide-beam riometer and an imaging riometer. For the passive operation mode of the riometer to receive the cosmic radio, the receiving antennas for both riometers were able to be deployed at the same site without interferences with each other. The antenna array for imaging riometer covers an area of some 1600 m, and a solo antenna which was identical to the antenna element of imaging riometer was set up at the northwest corner at the same site for the wide-beam riometer.
The imaging riometer utilized 64 crossed-dipoles configured as a filled phased array (Mailloux, 2005) and a modified two-dimensional (2D) analog Butler matrix (Butler and Lowe, 1961), it produces 49 imaging beams. Beam width at the zenith is 12.8°, which translates to 20.2 km at a height of 90 km. Beam separation at the zenith is 14.2°, which translates to 22.4 km at a height of 90 km. The antenna array is aligned in geomagnetic North-South and East-West directions. Each antenna is a freestanding half-wave crossed dipole with an azimuthally symmetric radiation pattern and spaced at/2 (3.92 m) from its neighbors. The crossed dipoles are circularly polarized to match the polarization of the more strongly absorbed X-mode incoming “signal” from the cosmic noise background. Each antenna is mounted on a steel mast at a height of 1.96 m, i.e.,/4 for the center frequency of 38.235 MHz. A ground plane with mesh size of/10 (0.784 m) wide, made of brass, is laid out under the array. Low-loss (≤0.02 dB·m) coaxial cables of electrically identical length (65 m) connect each antenna to the receiver hardware in an instrument container by the side of the antenna site.
The wide-beam riometer consists of a simple antenna with an azimuthally symmetric radiation pattern; consequently, it has a wide field of view but no imaging capabilities. The antenna is connected to a receiving device which measures the power of the incoming cosmic background noise. In the absence of geomagnetic activity, the received power forms a baseline, or “quiet day curve (QDC)” from which absorption measurements can be derived. It is useful for a general overview of the current state of the ionosphere, but without any information on the spatial structure and dynamics within their field of view.
Figure 1 indicates the projection of the half-power width of the antenna beams of the imaging riometer and the wide-beam riometer onto an ionospheric absorption altitude of 90 km. The yellow and red solid lines indicate the width of the imaging beams and the wide beam respectively. Both the wide-beam and the imaging riometers operate with a 1 s cadence, during which the integration time is 550 ms. That means excluding effect of 50% duty cycle in noise-balancing receiver by the analogue Butler matrix beam-forming method.
The receivers for both the wide-beam and imaging riometers were designed and crafted by Lancaster University (Honary et al., 2011). The imaging riometer utilizes analog Butler matrices. The receiver bandwidth is set to typical 250 kHz with an absorption resolution of 0.05 dB. An earlier site survey did not find man-made interference in the band 37.9–38.5 MHz. A wooden enclosure (75 cm deep) contains the riometers and Butler matrix. The RG58 antenna cables enter through the cut-out in the front of the enclosure. The data logger with control units and other peripheral electronics are housed in an industry-standard 2U 19 inch sub-rack. The 2U 19 inch sub-rack is housed in a 6U 19 inch rack along with an uninterruptible power supply (UPS). To eliminate the temperature variations which may cause gain changes in the preamplifiers, all the riometers and Butler matrix are placed in a standard container by the side of antenna site with a self-control heater to stabilize the inside temperature. Table 1 gives the overview of CIAO imaging riometer system specification. Figure 2 shows the block diagram of imaging riometer system at CIAO. Figure 3 is a photo of wide-beam and imaging riometers facilities in the container just after finishing their installation. Figure 4 is the panorama view of the imaging riometers with the antenna array. Figure 5 shows the solo antenna for the wide-beam riometer located at the northwest corner of the site.
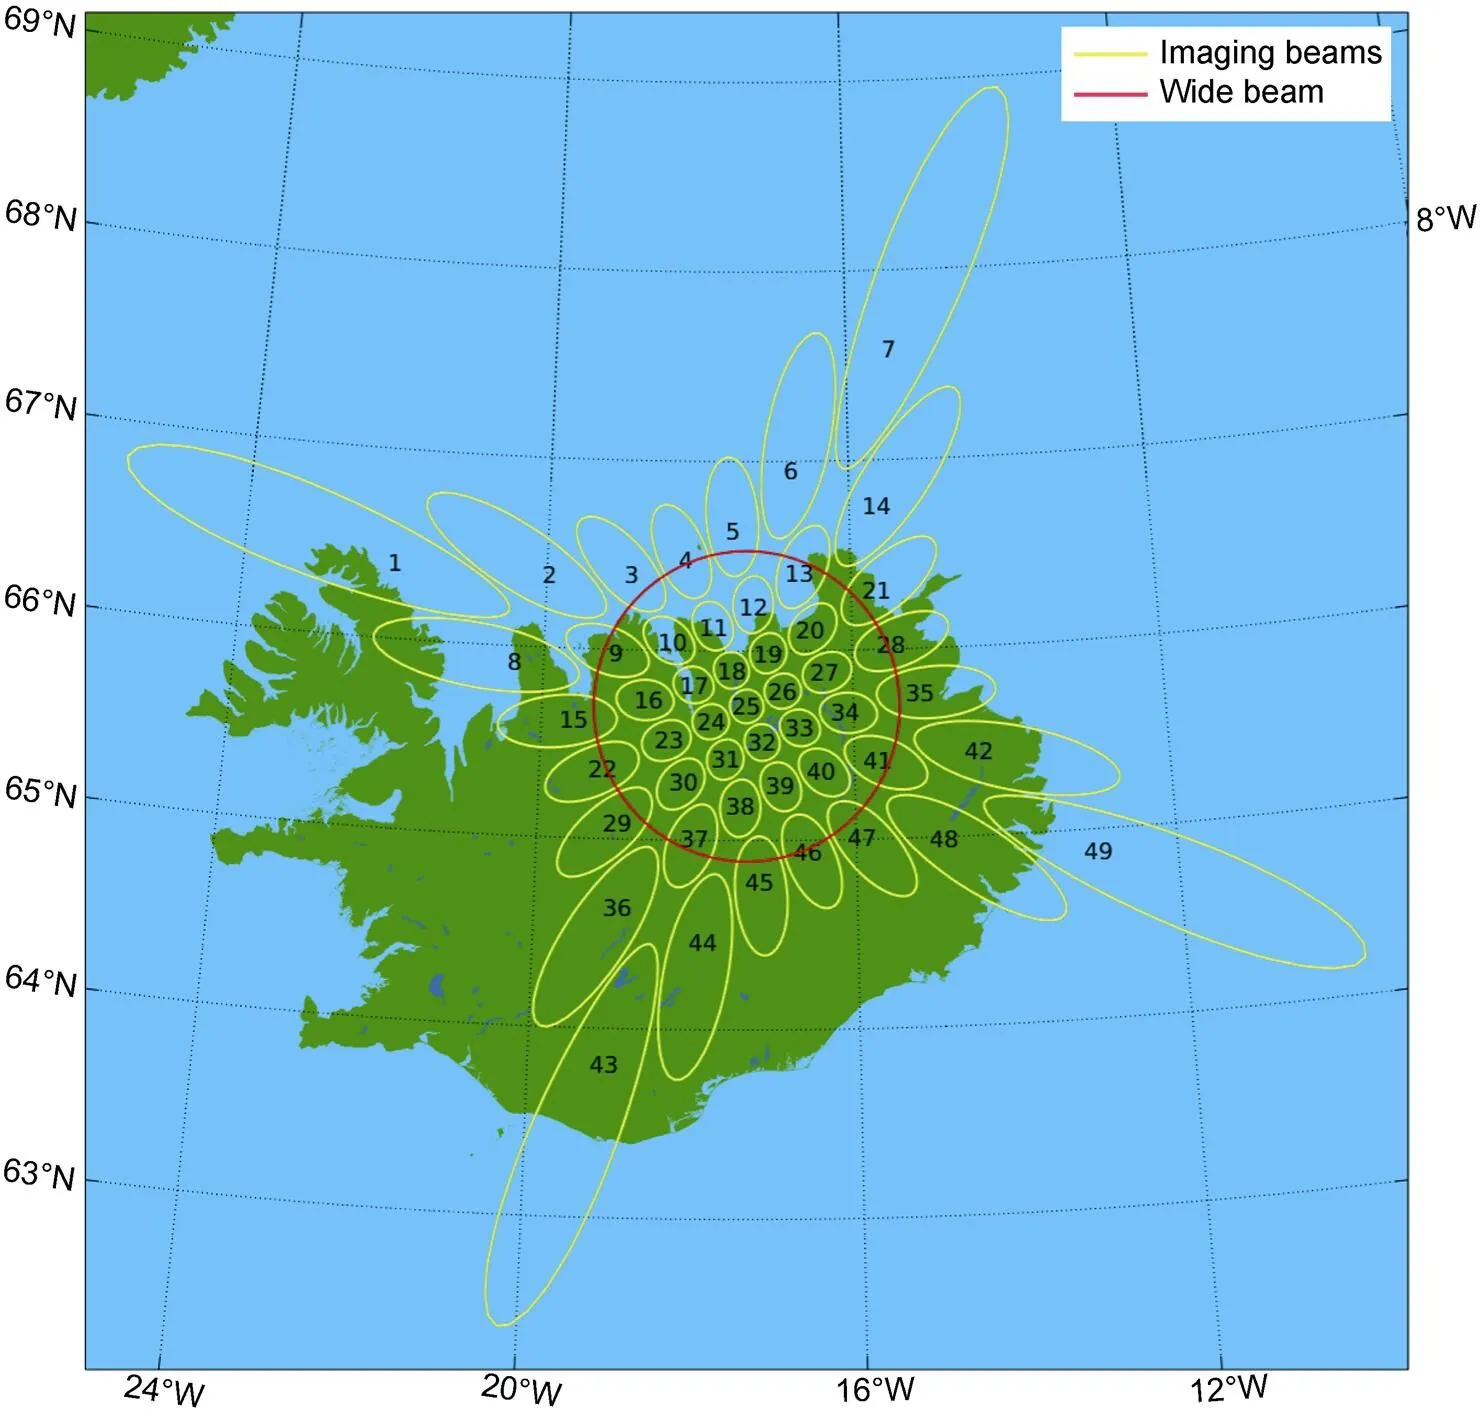
Figure 1 The projection of the half-power width of the antenna beams of the imaging riometer and the wide-beam riometer onto an ionospheric absorption altitude of 90 km at CIAO. The large red circle shows the wide-beam riometer field of view. The 49 imaging beams are numbered.
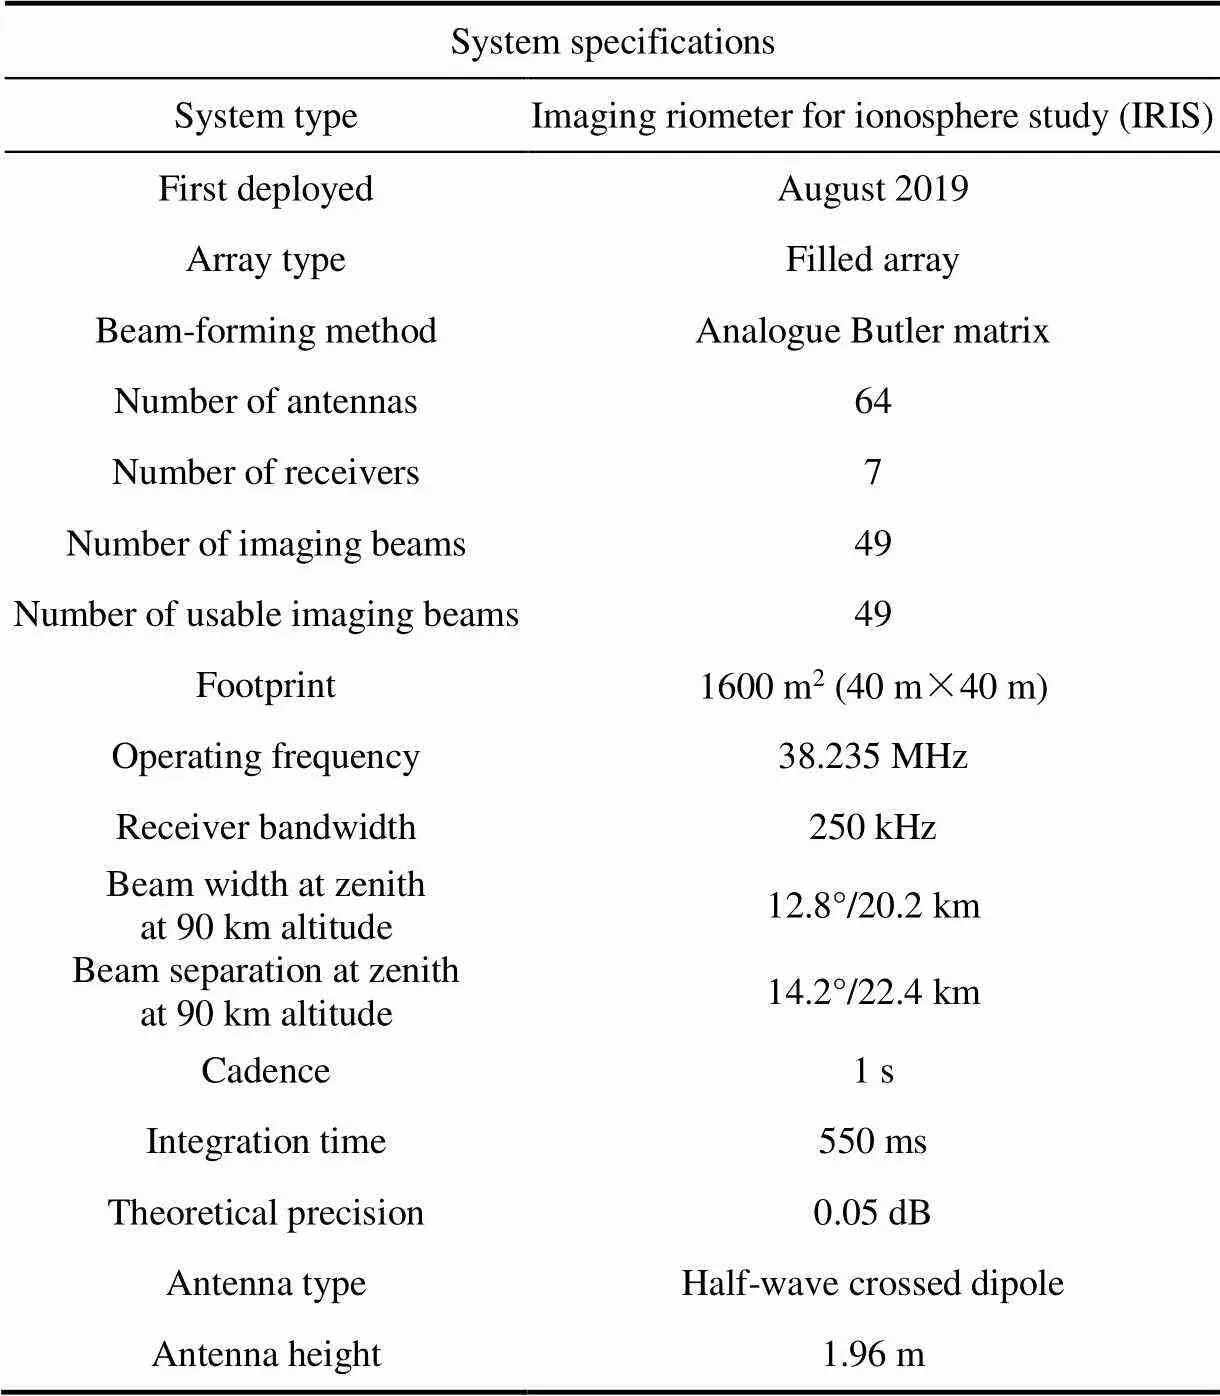
Table 1 CIAO imaging riometer system specification
3 Analysis method
The beam-forming correction is a routine work after the installation of whole imaging riometer system. The onsite antenna array’s installation depends on a variety of factors such as the proper field area selection, the flatten field work and the geomagnetic direction aligning. For the two separate parts of the system (outdoor antenna array and indoor receiver), the correction procedure is important and necessary to ensure the antenna array’s deployment is correct just as we design the scanning order of the receivers as expected. Since the CIAO imaging riometer was installed in August 2019, it operates automatically without on-site staff monitoring. The maintenance work is carried out by PRIC staff every summer. The riometer raw data are logged and in daily data file stored in on-site storage and are transferred to Shanghai once each day. The data has been collected, awaiting analysis and confirmation of correct operation. The data analysis described here uses the Multi-Instrument Analysis (MIA) (Marple and Honary, 2004) package for Matlab.
To measure ionospheric absorption, it is necessary to know the signal power that the riometer would measure in the absence of absorption. The signal power is a function of sidereal time because the source of the received noise is the cosmic background. The expected levels for all sidereal times can be collected during a ‘quiet day’, that is, during a geomagnetically quiet time when no absorption is expected. In practice MIA normally generates quiet day curves by analyzing data from 16 solar days, and taking the upper envelope of signal power. In the absence of interference, the largest value at each sidereal time bin (1 s as the native time resolution) can be used. In practice better QDC are obtained by using additional data, smoothing with a sliding median filter, and by taking the mean of the third and fourth highest values for each sidereal time bin. The QDC estimate approach used here was described in details by He et al. (2014). Although the cosmic background signal (excluding contributions for solar activity) does not vary over human lifetimes the quiet day curves are recalculated every 16 d to account for seasonal absorption effects and other factors such as changes in ground conductivity and possible pile-up of snow inside the antenna array.
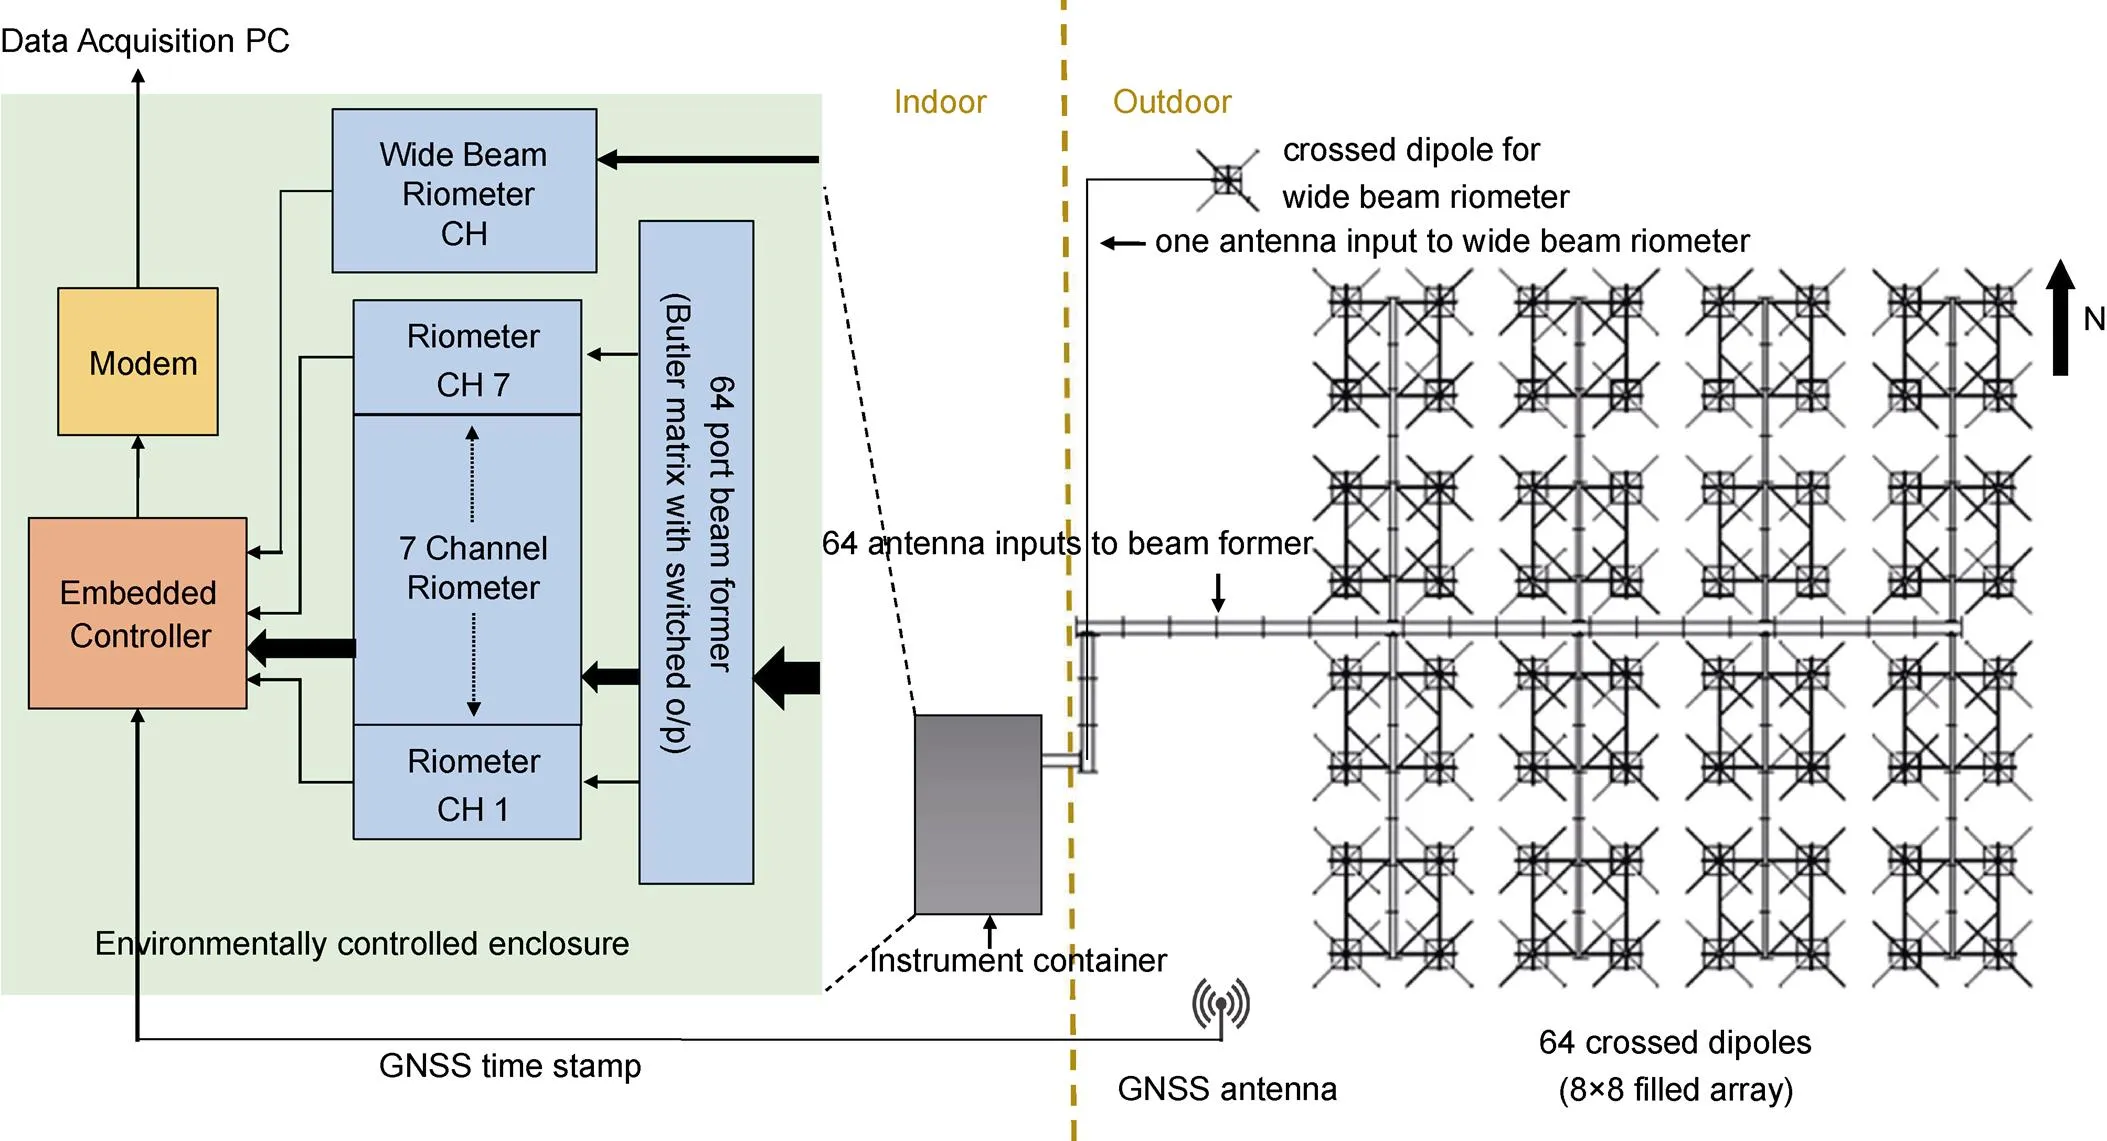
Figure 2 Block diagram of CIAO riometer system.
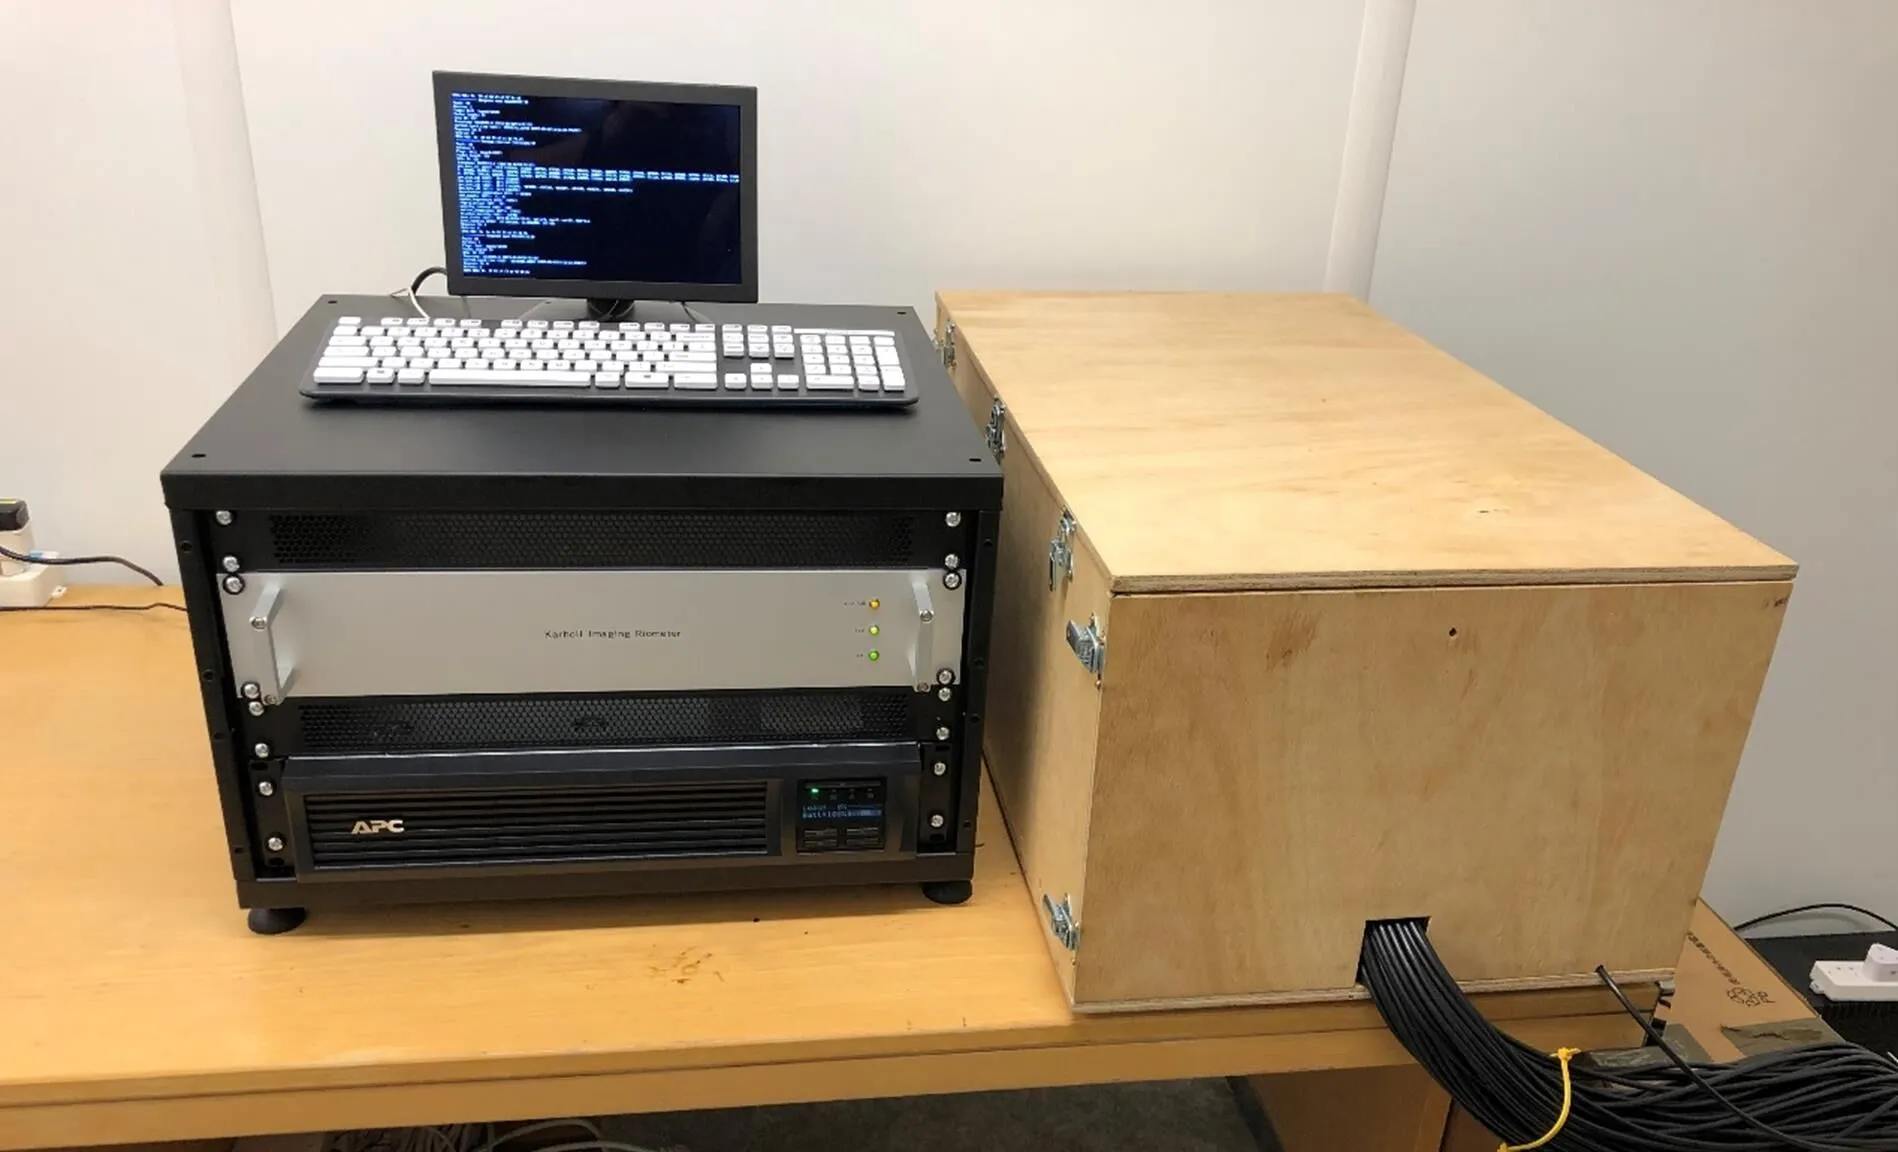
Figure 3 Riometer indoor facilities at CIAO with a UPS (2U high at the bottom of the rack).
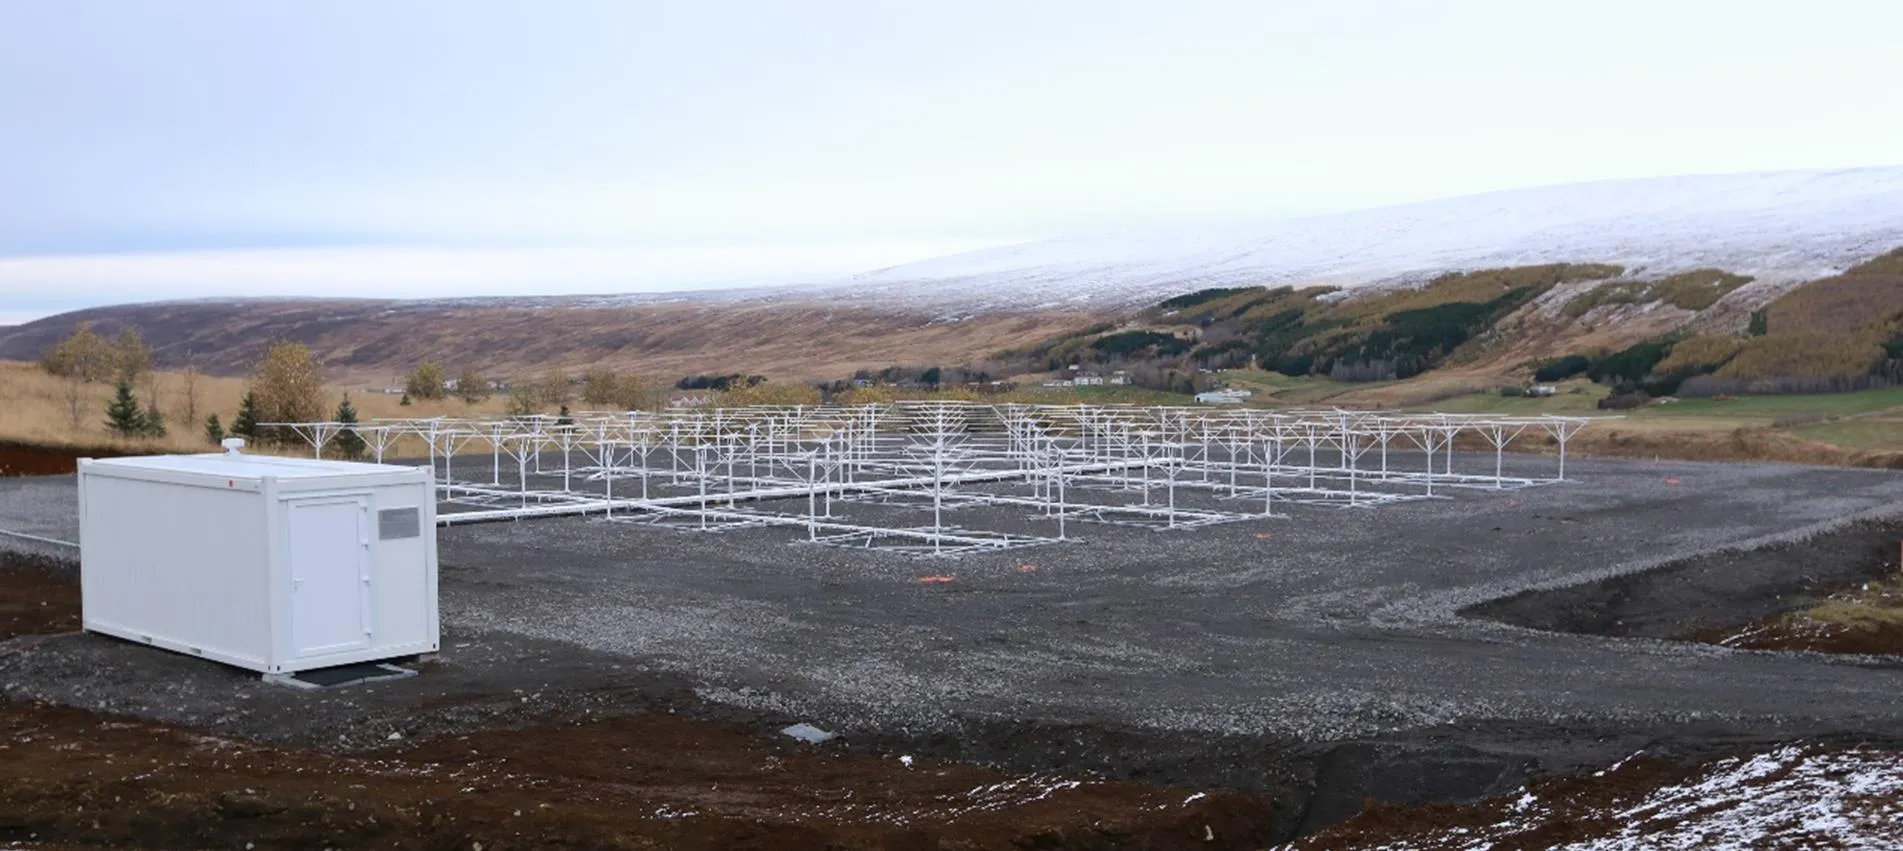
Figure 4 The panorama view of the imaging riometers with the antenna array at CIAO.
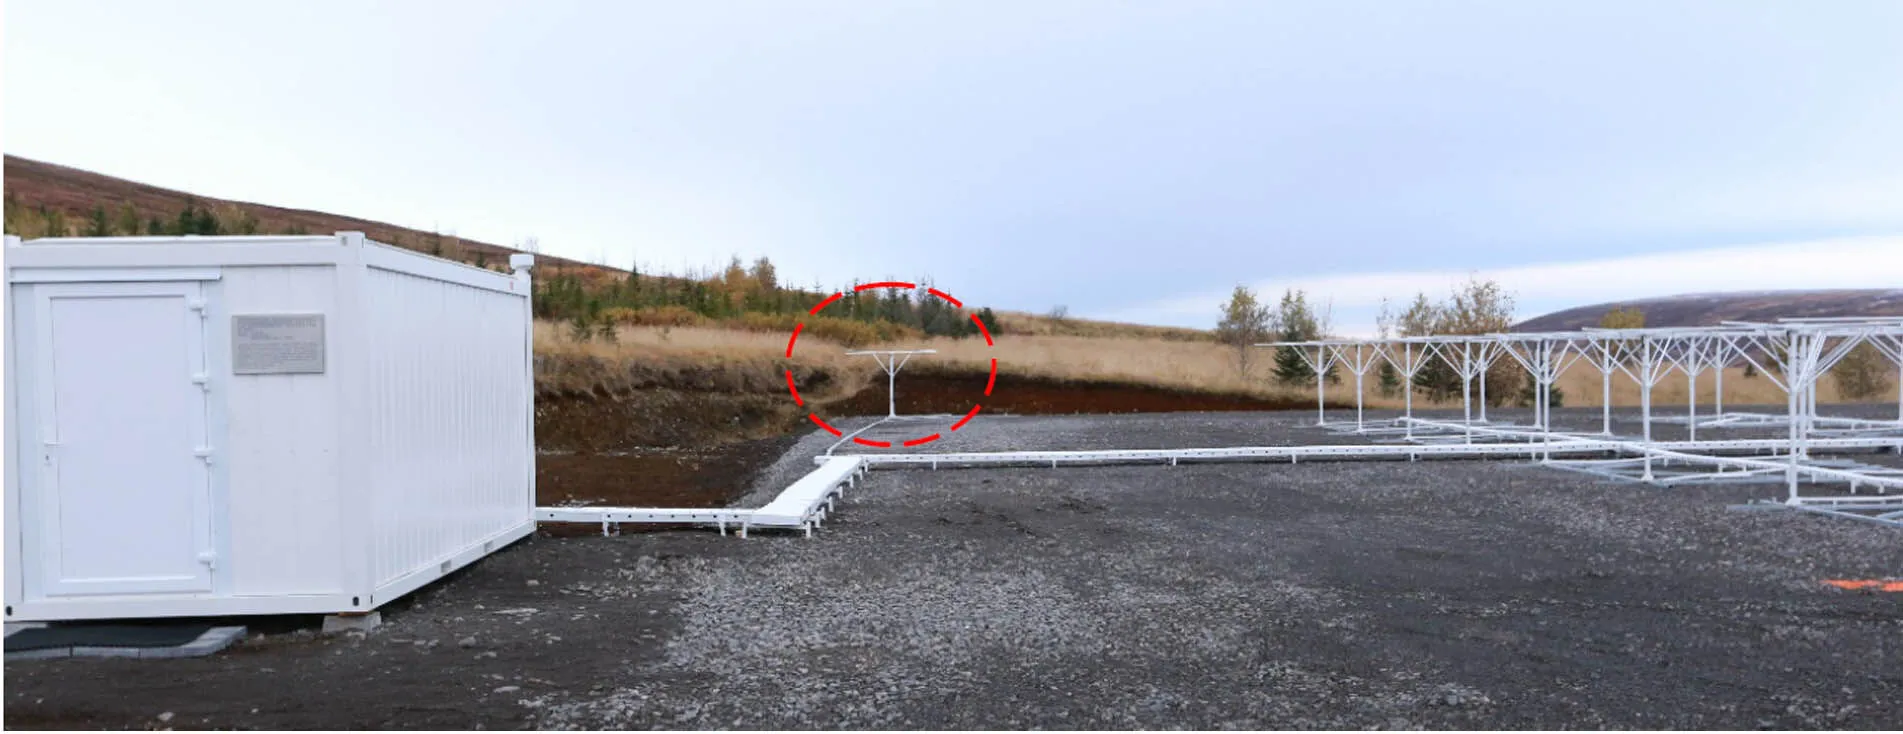
Figure 5 The solo antenna for the wide-beam riometer located at the northwest corner of the site (indicated by the red dashed circle).
To analyze the riometer’s beam-forming performance the quiet day curves are a natural place to start as by design they remove noise and absorption events. We analyzed quiet day curves for the period 2019-10-09 to 2019-10-23, which were derived from data recorded from 2019-10-08 to 2019-10-24.
The cosmic radio background contains strong spatial variations. The Milky Way can be readily seen when the riometer quiet day curves are converted to a sky map. There are also strong radio sources (particularly Cygnus A and Sagittarius A*) which are responsible for clear maxima in some of the quiet day curves. These features can be combined with the riometer beam projection to confirm that the beam numbering is correct.
The centers of the riometer beams projected onto the ionosphere do not form a neat grid, although they can be approximated to a grid with pin-cushion distortion. The −3 dB outline of the beams projected onto a curved ionosphere at 90 km altitude can be seen in the Figure 1. This map view is correct when considering absorption, which occurs in a thin layer at about 90 km altitude. When considering received power and the radio sources responsible it must be remembered that the beams do not stop at 90 km altitude but project back to the cosmic radio background. One consequence is that beams at CIAO that point northwards, with a zenith angle equal to 90°−65.71°= 24.29°, will be parallel to the axis of rotation and thus will observe approximately the same portion of cosmic background regardless of sideral time. Such a quiet day curve will be nearly flat (Even if a beam is perfectly aligned with the axis of rotation, it is unlikely to be truly flat as that would require the beam to be conical with no side lobes). Beams that point northwards with zenith angles larger than 24.29° will observe the cosmic background on the opposite side of the Earth, and can be identified by a phase shift in their sideral curve when compared to the zenithal beam. Beams that point South and have large zenith angles trace longer paths across the cosmic background so they typically have larger rates of change in received power. These properties can be used to confirm the correct beam numbering for the rows of the beam projection.
To confirm the beam number is correct with respect to the columns it is possible to analyze the timing of peaks from a strong radio source. Beams which point East will observe the maxima earlier than beams which point West. These are the properties that will be checked to confirm the beam numbering is correct.
3.1 Row order
Information was used to set the correct beam row scan numbering prior to the riometer installation at CIAO. The correct scan mapping was programmed into the riometer data acquisition microcontroller EEPROM. The send_ cmd.py program can be used to query and modify any of the EEPROM settings. The scan mapping setting should not be modified. The microcontroller sends all of its EEPROM settings to the Raspberry Pi data logger whenever it boots. The initial value of this setting is stored in an array:
Scan_mapping = [0, 4, 2, 6, 1, 5, 3, 7]; //Last value not used
Since C/C++ language uses zero-indexed array values the first row (beams 1 to 7) is row zero, and the last row of beams (43 to 49) is row 6. To obtain the scan number for row zero we use scan_mapping [0], that is, send 0 to the Butler matrix controller. To obtain the scan number needed for row 3 (central row, beams 22 to 28) we use scan_mapping [3], so 6 is sent.
As shown in Figure 6 all quiet day curves are plotted in their corresponding beam location, with the same-axis limits. It can be seen that beams 4, 11 and 18 contain less dynamic range than the other beams in that column. There is not a clear phase shift indicating a beam viewing the cosmic background from the opposite hemisphere. This suggests that the rows are approximately correct. The beams 7, 14, 21, 28, 35, 42 and 49 are more representative of what would be expected from the central column. This suggests a possible issue with the column ordering.
3.2 Column order
There is no specific row mapping setting in the data acquisition microcontroller. When the riometer was shipped to CIAO no mapping corresponding to that used for rows was implemented for the columns. During a short operation period it was not possible to check the row ordering, mostly because the riometer had not collected sufficient data to allow good quiet day curves to be generated. The column ordering can be checked from the plot of beams 36–42 shown in Figure 7, and the initial column mapping is shown in Table 2.
We use the maxima that is visible after 12 h sidereal time. The maxima are seen first in beam 39, then 41, 37, 42, 38, 40 and finally in beam 36. The expected order is 42 (the beam which looks most easterly), then 41, 40, 39, 38, 37 and finally beam 36. This strongly suggests that the beams are incorrectly ordered. The likely correction is to apply the same mapping as is used for rows (Likely because the row and column phasing are essentially identical but there is the possibility of a left-right swap). The mapping is zero-indexed and the count must be start at zero.
Applying the mapping we now desire the first column (0), and the mapping returns 0. That is, beam 36 is still beam 36. The second column (1) will be beam 37, the mapping states that column 4 (current beam 40) is the real beam 37. The method is: to find the current beam number, to obtain the column mapping from that row, to look for the row where the index matches the column mapping, the middle column is the actual beam number. Subsequently, we got the results as shown in Table 3.
The order observed was 39, 41, 37, 42, 38, 40, 36. The actual beam order using this mapping is: 42, 41, 40, 39, 38, 37, 36 as shown in Figure 8. This could be the expected behavior – the most easterly beam observes the maxima first and most westerly beam observes the maxima last. This corrected mapping also explains the column ordering issues identified in the row ordering section.
3.3 Revised column ordering
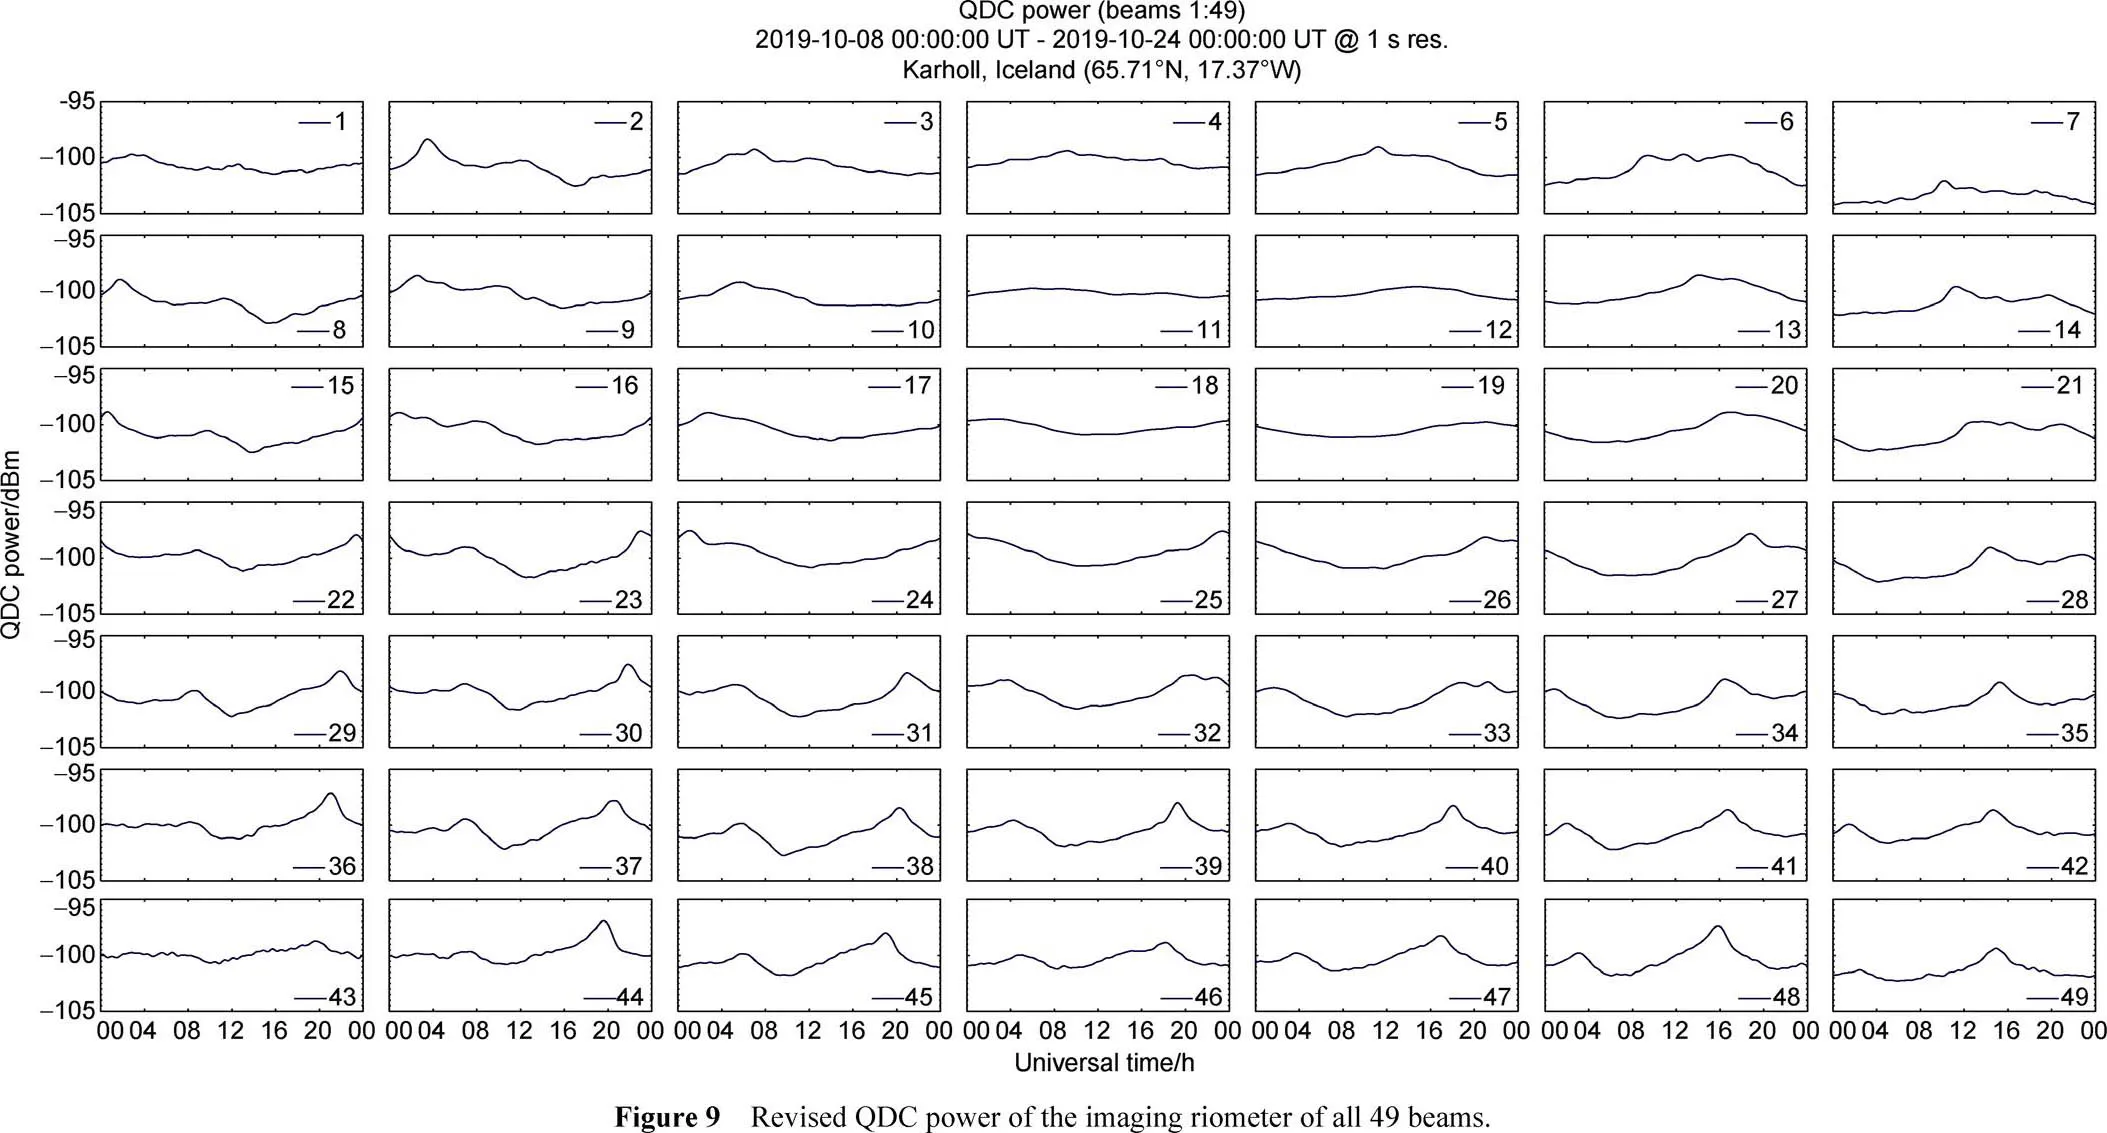
The plots in Figure 9 show the result of the revised column ordering. For simplicity this was implemented in MIA and corrects the data order as the files are read by Matlab. The cleanest correction would be a modification to the Python data logging program, and to reprocess all of the existing data.
The plots show a phase shift between beams 11 and 18, as is expected. Beam 11, which is aligned most closely to Earth’s axis of rotation, has the quiet day curve with least dynamic range. The maxima observed in beams 36 to 42 now occurs in the expected order. The column mapping revision has corrected all of the observed issues and the beam numbering and projections are correct and as designed.
One minor observation is the lower power level observed in beam 7. The riometer has seven receiver channels as shown in Figure 2 of each making this measurement which is responsible for the other beams in that column so it does not appear to be an issue with the riometer or the ADC channel. The lower level appears to be a realistic feature of that particular beam. It should be noted that the corner beams all have multiple grating lobes stronger than −6 dB (relative to the beam center) and as a result of the spatial ambiguities this causes MIA defaults to not using the data when creating absorption images. Therefore, the lower received power level in Beam 7 is not a cause for concern.
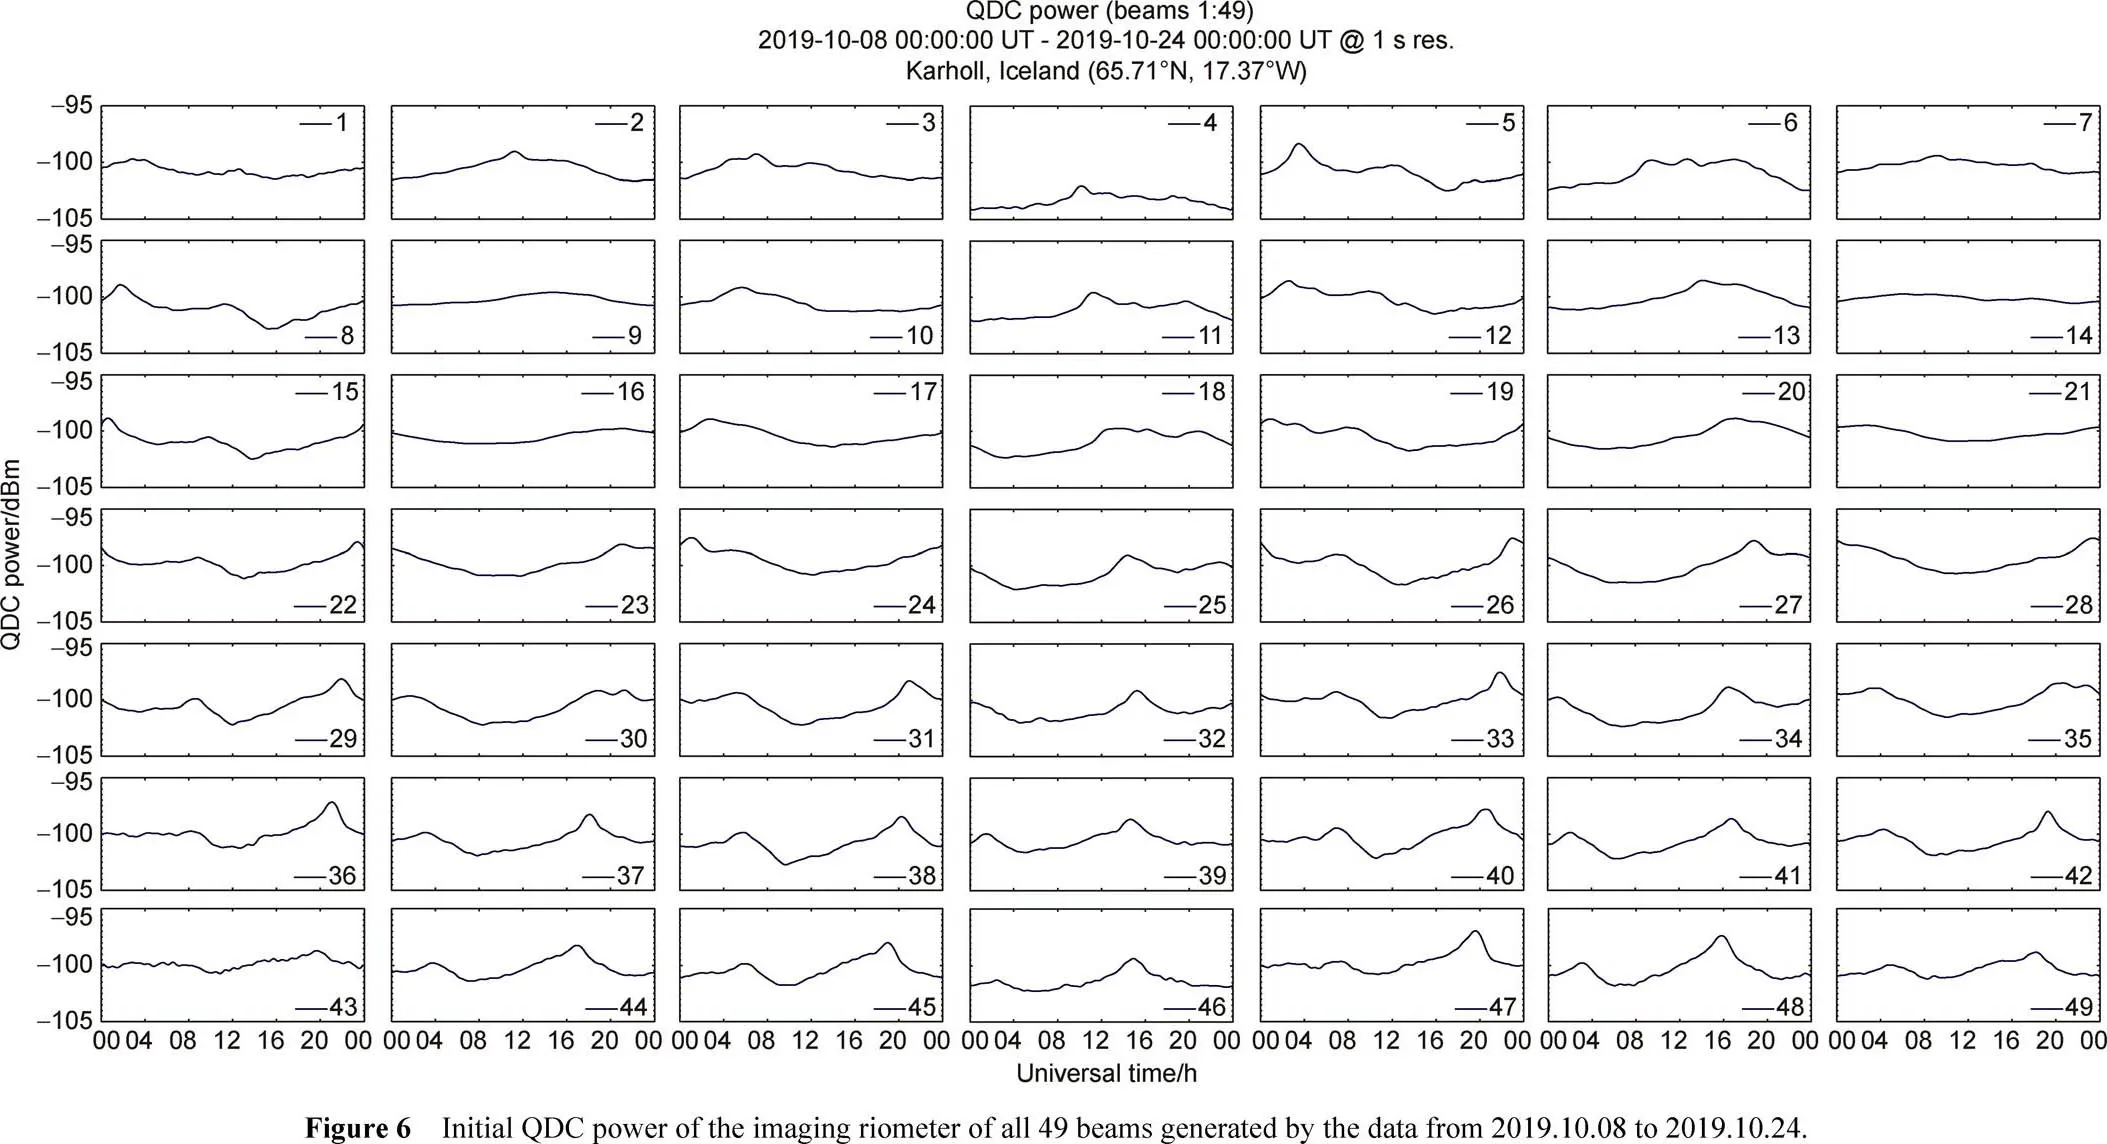
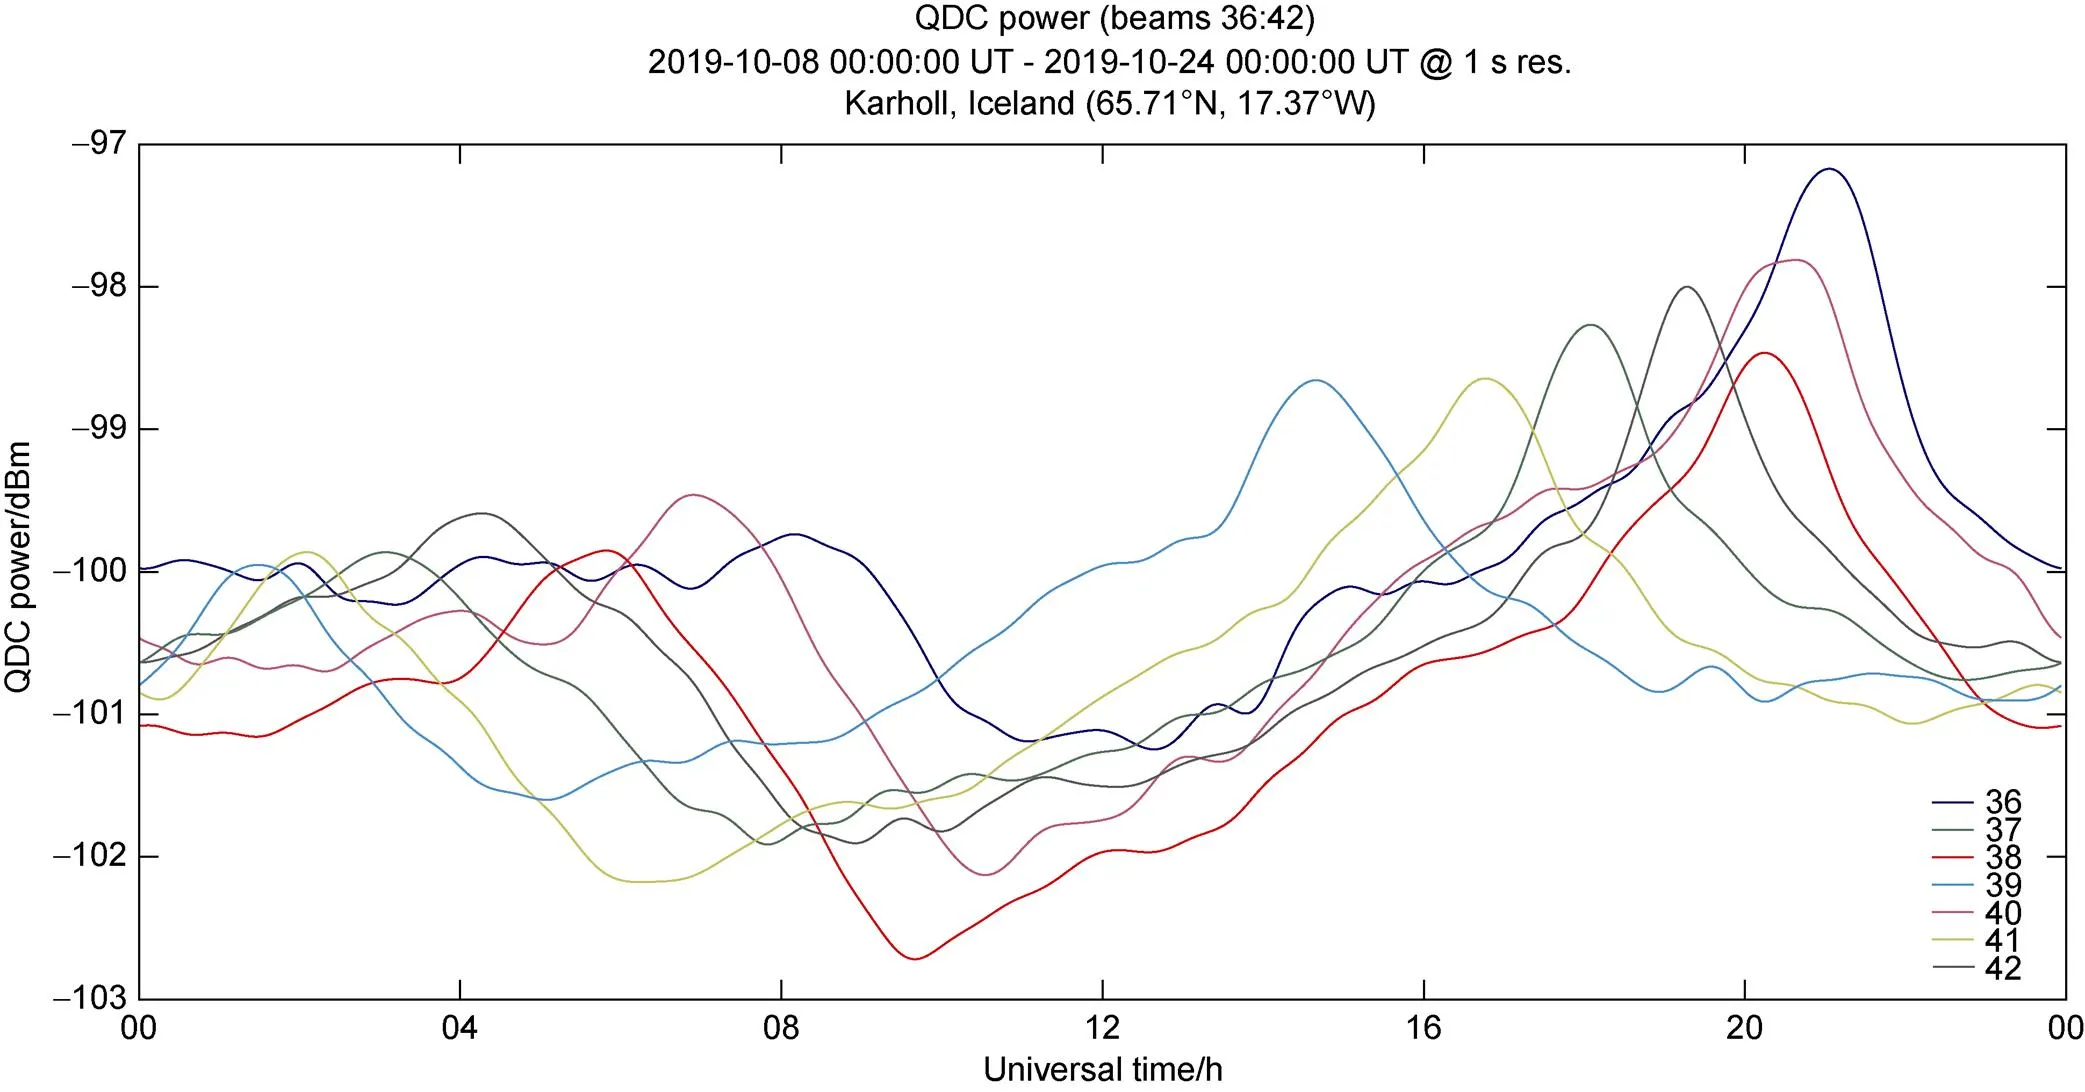
Figure 7 Initial QDC power of the beams 36–42 generated by the data from 2019.10.08 to 2019.10.24.

Figure 8 Revised QDC power of the beams 36–42.
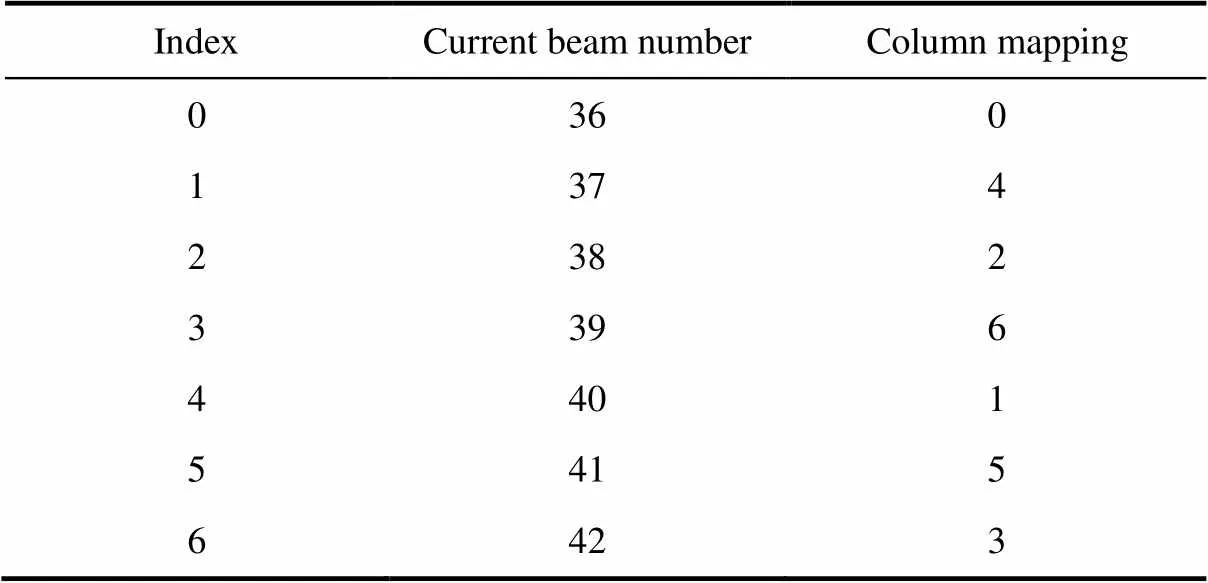
Table 2 The initial column mapping for beams 36–42

Table 3 The actual beam number after revised
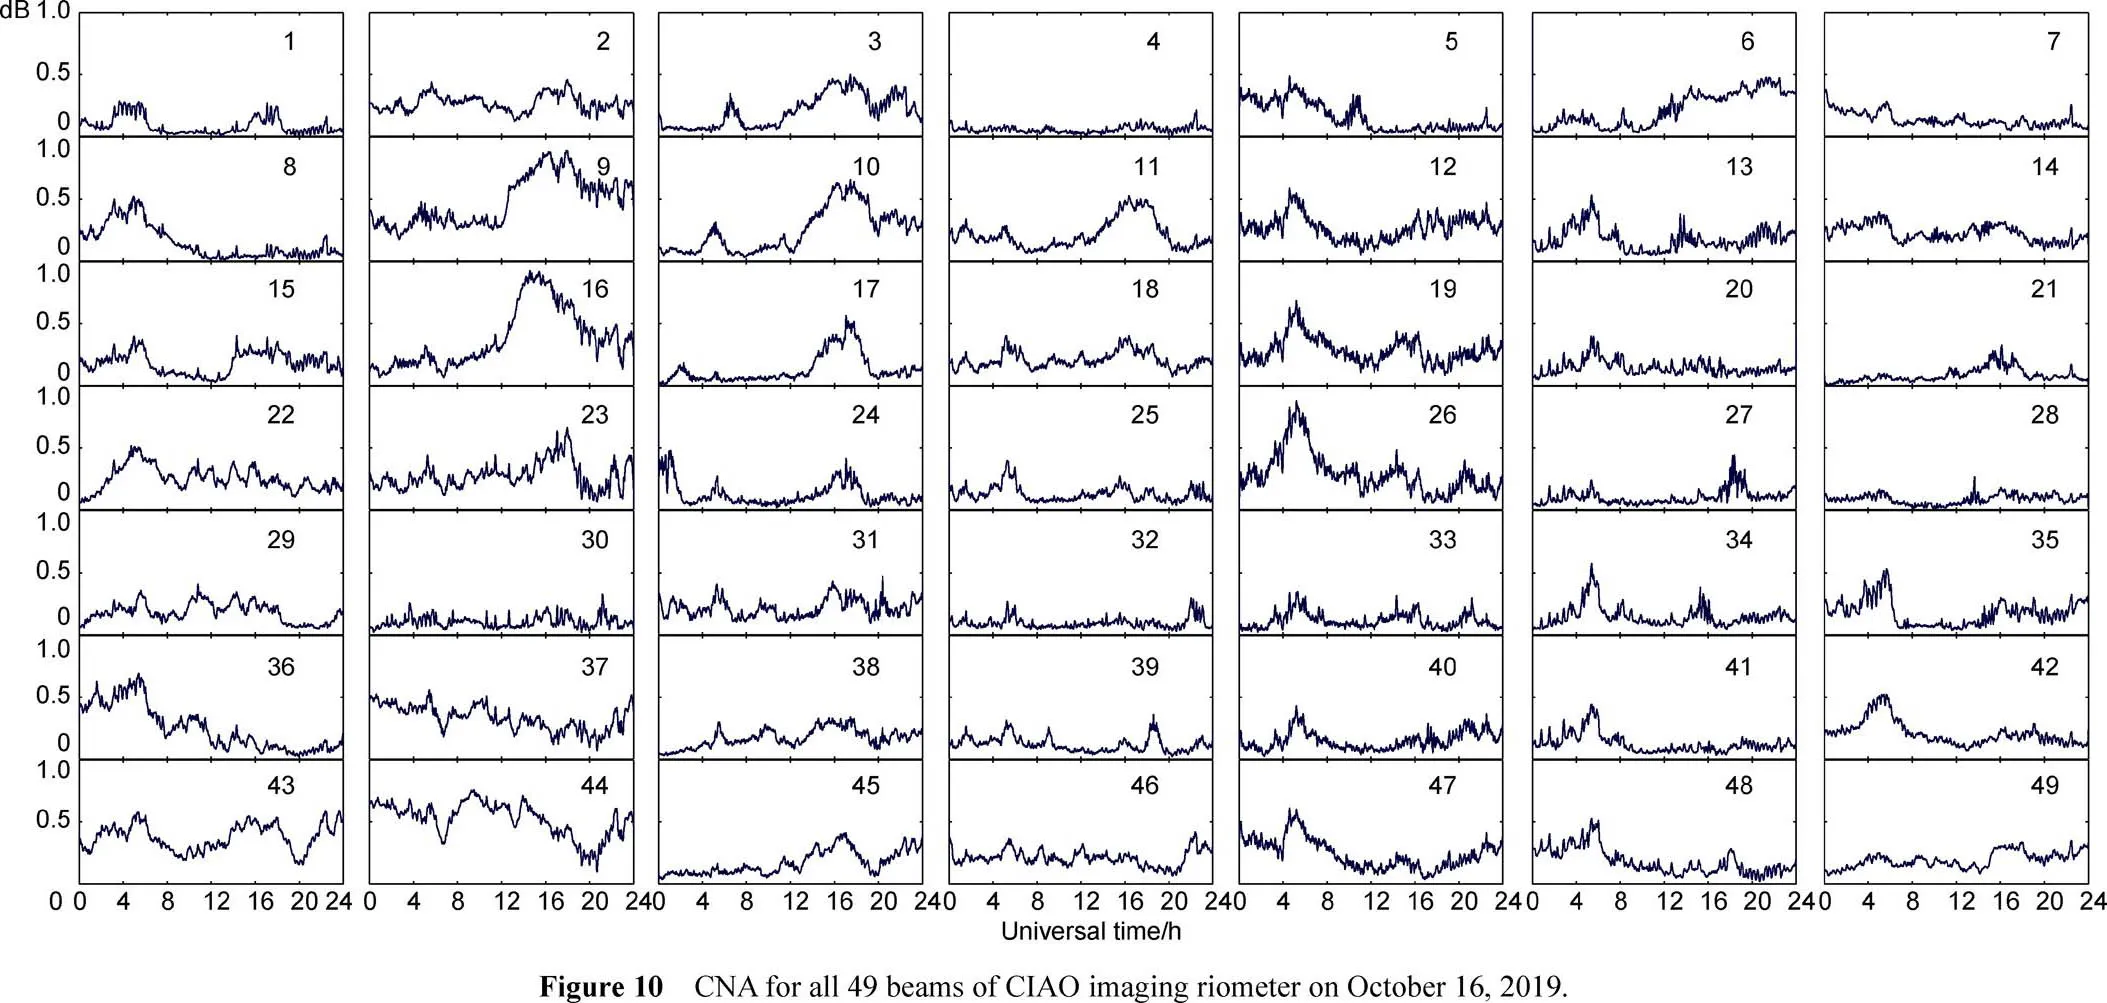
October 16, 2019 is a geomagnetically active day referring to the Kp and Ap index provided by World Data Center for Geomagnetism, Kyoto. Based on the QDC power in Figure 9, all the 49 beams’ cosmic noise absorption (CNA) of CIAO imaging riometer are presented in Figure 10. All the absorption level was less than 1 dB, which indicated that there was no significant absorption occurred on this day. The CNA in column 5 showed there was an absorption enhancement from ~4:00 UT to ~5:30 UT for all the seven beams. A series of 2D images of CNA over CIAO with 7 s intervals from 5:10:35 UT to 5:14:12 UT is shown in Figure 11. The images indicate the evolution of absorption area in the field of view. The evolution shown in Figure 11 gave a local absorption variation with no significant absorption patches transit across over CIAO during the period.
The 2D absorption data of imaging riometer can reflect the absorption evolution at 90 km altitude. It is usually used to study auroral precipitation processes with co-located optical imagers because they could have the same source from the morning-side inner magnetosphere or magnetotail. Sometime the two kinds of data (imaging CNA data and aurora optical data) may have the same evolution feature. And by comparing the two kinds of data, the 2D absorption data could be used to validate whether the beam direction is correct or not. However, the 2D CNA data alone could not be used to validate the beam direction, so as to demonstrate the validity of the beam direction correction. And even by using the method of comparing the two kinds of data as stated, it is not a guaranteed approach to ensure the validity of the beam direction, because sometimes the co-located optical and CNA data are not showing the similar evolution trend. The proper way to correct the beam-forming is the method introduced in subsection 3.1 and 3.2.
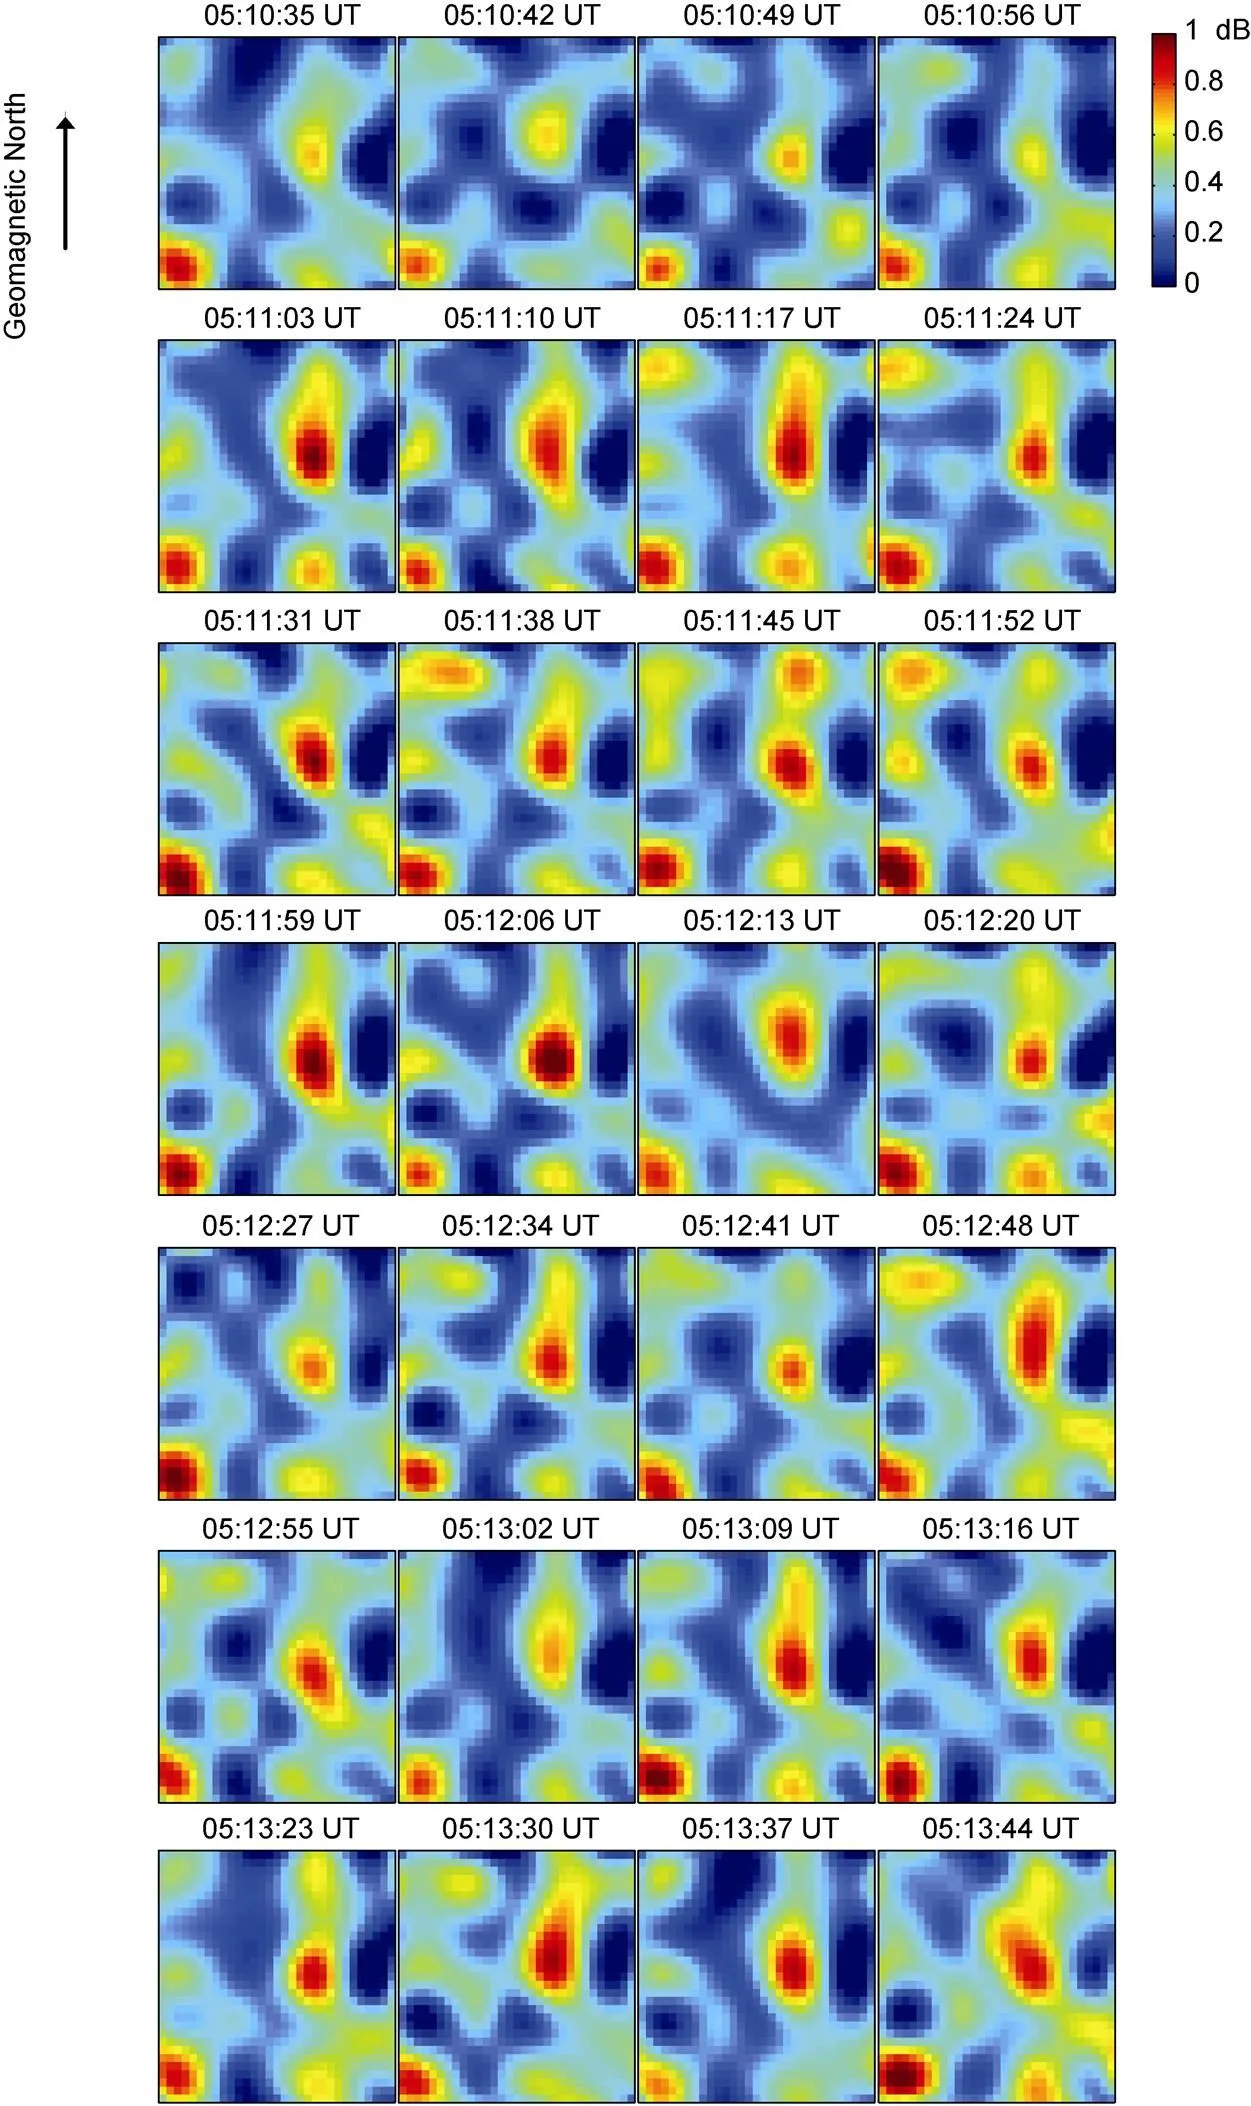

Figure 11 2D images of CNA over CIAO with 7 s intervals from 5:10:35 UT to 5:14:12 UT.
4 Summary and prospects
The CIAO is located at Kárhóll in the northern part of Iceland, with geomagnetic latitude of ~65.5°. This geographical site makes it suitable for the ground-based observations of ionospheric response to magnetotail reconnection and energy transfer process after substorm commencement on the nightside. For this purpose, a riometer system has been setup in August, 2019, including an imaging and a wide-beam riometer. The features of the riometer system are presented. Based on the preliminary data, a beam-forming correction method was introduced and applied to the column ordering.
Geospace is a significant part of the environment of importance for the survival and development of mankind. Space weather has a remarkable effect on human activities, especially on the radio communication system. As an active significant indicator of the solar wind-magnetosphere- ionosphere coupling process, nightside aurora absorption and polar cap absorption are getting important for space weather monitoring. At Yellow River Station in the Arctic and Zhongshan Station in Antarctica (both located at the cusp-latitude auroral oval and are suitable for observations of the dayside aurora absorption) a digital and a typical analogue imaging riometer (Hu et al, 2017) has already been running continuously for more than a decade, respectively. After the deployment of CIAO imaging riometer, it is able to carry out the dayside and nightside optical aurora form observation and aurora absorption observation simultaneously at Yellow River Station and CIAO in Arctic. It will promote future research and monitoring capabilities of space weather, auroral physics, and the solar wind-magnetosphere-ionosphere coupling process.
Acknowledgements This work was supported by the National Key R & D Program of China (Grant no. 2018YFF01013706), the National Natural Science Foundation of China (Grant no. 41874195) and the International Cooperation on Key Scientific Issues in the International Meridian Circle (Grant no. A131901W14). The Chinese polar observation data of upper atmosphere physics is open to public via National Arctic and Antarctic Data Center of China (www.chinare.org.cn), and the registered user can apply data via the website. However, the CIAO riometer data has not been open to public yet, and will be open soon. The CIAO riometer data could be applied via personal contact to the authors before its opening to public online. The online release of Kp and Ap index data was provided by the World Data Center for Geomagnetism, Kyoto. Special gratitude is owed to Mr. Li Zhong, Mr. Cao Hongjian, Mr. Ji Yanlong, Mr. Duan Zhengwei, Mr. Halldór Jóhannsson and Mr. Reinhard Reynisson for their efforts on the CIAO riometer installation work. We appreciate two anonymous reviewers and Associate Editor, Dr. Akira Kadokura for their valuable suggestions and comments regarding further improvement of this article.
Ansari Z A. 1964. The aurorally associated absorption of cosmic noise at College, Alaska. J Geophys Res, 69(21): 4493-4513, doi:10.1029/ jz069i021p04493.
Bailey D K. 1968. Some quantitative aspects of electron precipitation in and near the auroral zone. Rev Geophys, 6(3): 289-346, doi:10.1029/ RG006i003p00289.
Belon A E, Romick G J, Rees M H. 1966. The energy spectrum of primary auroral electrons determined from auroral luminosity profiles. Planet Space Sci, 14(7): 597-615, doi:10.1016/0032-0633(66)90044-4.
Burch J L. 1991. Diagnosis of auroral acceleration mechanisms by particle measurements//Meng C I, Rycroft M J, Frank L A. Auroral Physics. New York: Cambridge University Press, 97-107.
Butler J, Lowe R. 1961. Beam-forming matrix simplifies design of electronically scanned antennas. Electronic Design, 9: 170-173.
Campbell W H, Leinbach H. 1961. Ionospheric absorption at times of auroral and magnetic pulsations. J Geophys Res, 66(1): 25-34. doi:10.1029/jz066i001p00025.
Collis P N, Hargreaves J K, Korth A. 1984. Auroral radio absorption as an indicator of magnetospheric electrons and of conditions in the disturbed auroral-region. J Atmos Terr Phys, 46(1): 21-38, doi:10.1016/0021-9169(84)90041-2.
del Pozo C F, Hargreaves J K, Aylward A D. 1997. Ion composition and effective ion recombination rate in the nighttime auroral lower ionosphere. J Atmos Sol Terr Phys, 59(15): 1919-1943, doi:10.1016/ S1364-6826(97)00033-3.
He F, Hu H Q, Hu Z J, et al. 2014. A new technique for deriving the quiet day curve from imaging riometer data at Zhongshan Station, Antarctic. Sci China Technol Sci, 57(10): 1967-1976, doi:10.1007/s11431- 014-5616-z.
Honary F, Marple S R, Barratt K, et al. 2011. Digital beam-forming imaging riometer systems. Rev Sci Instrum, 82(3): 031301, doi:10.1063/1.3567309.
Hu Z J, He F, Liu J J, et al. 2017. Multi-wavelength and multi-scale aurora observations at the Chinese Zhongshan Station in Antarctica. Polar Sci, 14: 1-8, doi:10.1016/j.polar.2017.09.001.
Kosch M J, Honary F, del Pozo C F, et al. 2001. High-resolution maps of the characteristic energy of precipitating auroral particles. J Geophys Res: Space Phys, 106(A12): 28925-28937, doi:10.1029/2001JA9 00107.
Mailloux R J. 2005. Phased array antenna handbook, 2nd edition. Boston: Artech House.
Marple S R, Honary F. 2004. A multi-instrument data analysis toolbox, Adv Polar Upper Atmos Res, 18: 120-130.
Mende S B, Eather R H, Rees M H, et al. 1984. Optical mapping of ionospheric conductance. J Geophys Res, 89(A3): 1755, doi:10.1029/j a089ia03p01755.
Penman I M, Hargreaves J K, McClwain C E. 1979. The relation between 10 to 80 keV electron precipitation observed at geosynchronous orbit and auroral radio absorption observed with riometers. Planet Space Sci, 27(4): 445-451, doi:10.1016/0032-0633(79)90121-1.
Rees M H. 1963. Auroral ionization and excitation by incident energetic electrons. Planet Space Sci, 11(10): 1209-1218, doi:10.1016/0032- 0633(63)90252-6.
Robinson R M, Vondrak R R. 1994. Validation of techniques for space based remote sensing of auroral precipitation and its ionospheric effects. Space Sci Rev, 69(3-4): 331-407, doi:10.1007/BF02101699.
Sears R D, Vondrak R R. 1981. Optical emissions and ionization profiles during an intense pulsating aurora. J Geophys Res, 86(A8): 6853-6858, doi:10.1029/ja086ia08p06853.
Stauning P. 1996. High-latitude- and-region investigations using imaging riometer observations. J Atmos Terr Phys, 58(6): 765-783, doi:10.1016/0021-9169(95)00073-9.
Vondrak R, Harris S, Mende S. 1983. Ground-based observations of subauroral energetic-electron arcs. Geophys Res Lett, 10(7): 557-560, doi:10.1029/GL010i007p00557.
Vondrak R R, Sears R D. 1978. Comparison of incoherent scatter radar and photometric measurements of the energy distribution of auroral electrons. J Geophys Res, 83(A4): 1665-1667, doi:10.1029/ja083ia 04p01665.
: He F, Hu Z J , Hu H Q, et al.An introduction to the riometer system deployed at China-Iceland joint Arctic observatory and its beam-forming correction method based on the preliminary data. Adv Polar Sci, 2021, 32(3): 248-260,doi:10.13679/ j. advps.2021.0031
10.13679/j.advps.2021.0031
Corresponding author, ORCID: 0000-0001-6781-6977, E-mail: hefang@pric.org.cn
29 June 2021;
5 August 2021;
25 August 2021
杂志排行
Advances in Polar Science的其它文章
- The marine environmental evolution in the northern Norwegian Sea revealed by foraminifera during the last 60 ka
- Application of unmanned underwater vehicles in polar research
- Different physiopsychological changes between AMS- susceptible and AMS-resistant pre-selected Antarctic expeditioners in Tibet
- Characteristics of hydrogen/oxygen isotopes in water masses and implications for spatial distribution of freshwater in the Amundsen Sea, Southern Ocean
- Marine biogenic aerosols and their effects on aerosol- cloud interactions over the Southern Ocean: a review
- Utilization of clean energy and future trend of Antarctic research stations
