Chemical and physical characteristics of quartz from gold deposits in the North China platform: relationship to gold mineralization
2021-11-04JianzhaoYinYangLiuHongyunShi
Jianzhao Yin • Yang Liu • Hongyun Shi
Abstract This paper seeks to identify macroscopic metallogenic mechanisms of various mineral deposits by studying microscopic typomorphic characteristics of typical minerals associated with the deposits and to reveal the mechanism of lattice gold in detail by studying both physical and chemical characteristics of quartz from representative gold deposits in the North China Platform. As part of their extensive research, the authors examine the relationship between trace elements with wall rock, the ore-forming media, and gold immigration of various types of gold deposits, including their salinity, type, temperature.These are key factors to revealing the mineralization mechanism, and indicators for mineral prospecting,exploration, mining, and metallurgical technology. In order to address the questions posed, the following methods were used: field investigations of geology and sampling of the representative gold deposits, physical study and chemical analysis of quartz including, but not limited to, fluid inclusions as well as their compositions and trace elements in quartz, the unit cell parameters, electron paramagnetic resonance spectrum (EPR), and infrared spectroscopic analysis (ISA). As a result of this study, the authors observe the following key findings: unit cell parameters of quartz vary with their contents of foreign elements including gold,paragenetic stage, wall rock type, and other factors; the higher the forming temperature and the lower the gold content in quartz, the smaller the unit cell parameters, and vice versa. Additionally, the EPR absorption lines resulted from the O–Al defect center. The density of these types of hole centers increases and the EPR signal strengthens when the temperature decreases. Based on the findings, the authors conclude that lattice gold exists in quartz. Gold, in the form of Au+ and/or Au3+, entering quartz and producing an electron–hole center, namely, the O-Au hole center, makes the center produce spin resonance absorption and results in the EPR absorption peak #I. Both unit cell parameters and EPR of quartz can potentially be used in mineral prospecting, relative ore-forming temperature determination, and grade control during mining.
Keywords Physical and chemical characteristics ∙Quartz ∙Gold mineralization ∙Unit cell parameter ∙Electron paramagnetic resonance spectrum ∙Infrared spectrum
1 Introduction
Gold typically occurs in nature mainly in its metallic form,and/or as various alloys by forming complete series of solid solutions with silver, copper, nickel, palladium, and platinum. In association with the platinum metals, gold can occur both as free gold and in solid solution (Jones and Fleischer 1969). Generally speaking, free native gold occurs in hard rock minerals via four forms; namely, as inclusions in other minerals, filling in gaps between crystals of other minerals, in fractures of other minerals, and as lattice gold in other minerals mainly including pyrite,quartz etc. (Yin and Shi 1995).
Throughout history, very limited research has been done on lattice gold, though numerous studies have been done on gold occurring as inclusions, in fractures, and between crystals of other minerals.
In the 1990s, a few researchers conducted preliminary Electron Paramagnetic Resonance Spectra (EPR) studies on electron and hole centres, to discuss their significance in the evaluation of gold deposits in China (Dang 1991; Hu 1993; Liu 1997; Wang and Chen 1996).
Here, we seek to reveal the mechanisms of lattice gold in detail by studying both the physical and chemical characteristics of quartz from representative gold deposits in the North China Platform and to determine their relationship to gold mineralization. Meanwhile, the authors aim to reveal the macroscopic metallogenic mechanism and ore-forming process of the gold deposits by studying the microscopic typomorphic characteristics of auriferous quartz associated with the deposits, and by observing the microscopic world through the dominant gold-bearing mineral quartz in the study area.
For the first time, this paper confirms the existence of lattice gold in quartz from gold deposits in the North China Platform. The test methodology of lattice gold in quartz has wide-ranging applications for gold deposits in other countries and geographic areas.
This study on the occurrence of gold, especially lattice gold in hard rock minerals, will help with mineral prospection and evaluation, as well as gold mineralization studies of related deposits. This study will also provide a solid basis for metallurgical technology of gold deposits with lattice gold, and thus improve the metallurgical recovery of gold ore.
2 Geology
The northwestern Hebei Province, a relatively newer gold mining district in China, is located at the convergent area between the Inner Mongolian axis and the Yanshan folding zone in the center of the northern margin of the North China Platform, though there exist over 100 lode gold deposits of different sizes and placer gold mining dates back more than a millennium. Most of the lode gold deposits in the area are located within a triangular area among the Xuanhua, Checheng, and Chongli towns, which is thus called a gold triangle with an area of 1500 km2(Yin and Shi 1995). The proved gold reserve of typical lode gold deposits in the area is 175 metric tons or tonnes, including Xiaoyingpan, Zhangquanzhuang, Dongping, Hougou,Shuijingtun, Hanjiagou, Xiangshuigou, Zhongshangou, and Huangtuliang (Fig. 1). Annual output of recovered gold from the gold mines in the area is more than 160,772 oz or 5,000 kg in total (Song et al. 1994; Yin and Shi 1995; Xu et al. 2014).

Fig. 1 Simplified geological map of the gold deposits in the study area. ( Modified from Yin and Shi 1995)
1. Quaternary sediments; 2. Tuff conglomerate, sandstone, and breccia of the Upper Jurassic system; 3. Sandstone, siltstone, and dolomite of the Proterozoic Changcheng system; 4. Metamorphic granulite of the Late Archean Hongqiyingzi group; 5. Metamorphic granulite of the Aijiagou formation of the Archean Sanggan group; 6.Gneiss of the Shuidizhuang formation of the Archean Sanggan group; 7. Metamorphic granulite of the Jiagouhe formation of the Archean Sanggan group; 8. Granite of the Yanshan orogeny; 9. Amphibolite monzonite of the Hercynian orogeny; 10. Pyroxene amphibolite monzonite of the Hercynian orogeny; 11. Quartz monzonite of the Hercynian orogeny; 12. Amphibolite adamellite of the Hercynian orogeny; 13. Syenite of the Hercynian orogeny; 14.Pyroxenite of the Hercynian orogeny; 15. The Proterozoic granite-gneiss; 16. The Archean granite-gneiss; 17. The Archean metamorphic mica quartz diorite; 18. Marginal migmatization zone of the monzonite; 19. Fault and/or fault zone; 20. Small to large size gold deposits; 21. Town and/or village.
Strata of the area are mainly composed of four tectostratigraphic units: the metamorphic basement consisting of dark-colored granulite, plagioclase hornblende gneiss and migmatite of the Archean Sanggan group, and host rocks of the replacement and quartz vein types of gold deposits; the marine facies sedimentary cover of the middle Proterozoic Changcheng group; the continental facies volcanic-sedimentary rocks of the Mesozoic age; and the Cenozoic sedimentary overburden.
Strata of the area, especially the Archean metamorphic basement, experienced multiphase tectonic activities,which include three phases of folding which respectively formed the east-western hinge synclinorium, the overturned NNW-NWW hinge synclinorium, and the NWNWW hinge synclinorium. The well-developed faults include east–west, northwest, and northeast striking ones.Of these, the east–west striking Chongli-Checheng giant fault, also the boundary between the Inner Mongolian axis and the Yanshan folding zone, plays an important role in the formation of the numerous lode gold deposits. Ore bodies are mainly located at the intersections of different secondary level faults. Igneous rocks including ultra-basic,basic, intermediate, acid, and alkali intrusive rocks are well developed and mainly formed in the four tectonomagmatic cycles: namely, the Archean gneissic granite, diorite, and hornblende diopsidite; the early Proterozoic peridotie,pyrolite, and dunite; various granite, alkali complex intrusive rocks and ultrabasic rocks of the Hercynian orogeny; and the widespread distributed granite of the Mesozoic Yanshan orogeny. Numerous different kinds of dykes are well developed in the area (Zhang 1984; Wang 1986;Zheng 1990; Gao 1991).
There exist three metallogenic series, or three mineralization styles of gold deposits in the area, including quartz vein style (e.g. Zhangquanzhuang), replacement style (e.g.Xiaoyingpan), and alkali complex intrusive related style(e.g. Dongping) of gold mineralization.
Alterations include potassium, silicification, sericite,chlorite, carbonate, and epidote. The paragenetic stages from early to late include the potassium feldspar-quartz,white big quartz vein, smoky grey quartz-multiple metallic sulfide, and carbonate. The ore consists mainly of potassium feldspar, magnetite, specularite, quartz, pyrite,galena, chalcopyrite, bornite, native gold, electrum, tetrahedrite, calaverite, ankerite, calcite, barite, hematite, and malachite (Yin and Zhai 1994; Yin and Shi 1995).
3 Sampling and analytical methodology
Quartz, which occurs in almost each of the deposit’s paragenetic stages (Boyle 1979), is also one of the most common auriferous minerals in the study area. With the addition of gold, the characteristics of quartz will surely change. As a result, the mineralization mechanism of the lode gold deposits can be revealed by studying these microscopic alterations. To realize this, sampling is the key step for this purpose.
3.1 Filed sampling
Samples were collected from proper locations of the typical ore bodies at different levels of the selected representative large gold deposits in the study area, mainly Xiaoyingpan and Zhangquanzhuang. They are described in detail after being taken out of the underground workings to the ground surface, then properly labeled or numbered and wrapped with waxed paper to avoid cross contaminations with other samples in the same sample boxes, and finally packed and shipped to the work laboratory of the China University of Geoscience (Beijing).
3.2 Lab sampling and preliminary processing
In the lab, all samples were sorted, air-dried, and then stage crushed to 6-Tyler mesh, well homogenized, and then rotary split into 1 kg assay aliquots. One assay aliquots were wet screened into different sized fractions, and the-10mesh + 65mesh fraction was used for this study to get a better representative sub-sample for assay.
After being crushed and screened through different sizes of mesh, the quartz and other associated minerals in the fraction from 10 to 65 meshes to be used for further analyses were then manually separated and picked up under a binocular microscope, and its crystal forms and other physical mineralogical characteristics were observed and described in detail. Then, the selected quartz samples were pulverized to 90% passing 75 μm for further research and testing, to help reveal the mineralization mechanism of the corresponding lode gold deposits and the common metallogenic model for all of the lode gold deposits in the study area.
3.3 Analytical methodology
Gold was analyzed through standard fire assay procedures.A weighed sample (30 g for FA430 and 50 g for FA450,both FA430 and FA450 are the Lab analytical codes) was mixed with fire assay fluxes (borax, soda ash, silica, and litharge) and Ag was added for inquartation. The mixture was placed in a crucible to produce a fluid slag at 1000 °C.The crucible was then removed from the assay furnace and the molten charge was carefully poured from the crucible into a mould allowing the slag to separate, leaving a lead button at its base. After cooling, the lead button was placed in a preheated cupel, which absorbed the lead when cupelled at 950 °C to recover the silver + gold (dore´bead). Gold was then separated from the silver in the dore´bead by parting with nitric acid. The remaining precious metals bead (gold) was weighed gravimetrically on a microbalance, and then dissolved in acid, and analyzed by Atomic Absorption (AA) Spectrophotometer. During fireassay, a commercial gold standard (GS-P1A, reference value 0.143 g/t) was inserted as QA/QC.
Silver and other trace elements were determined by Thermo Scientific ICP Spectrometer – iCAP6000 after full acid digestion. During the ICP analysis, an internal standard quartz sample was used as a reference. Assays of the standard and reference are reported in the corresponding table along with the sample assays.
The gaseous components of the fluid inclusions in quartz were analyzed both by Raman spectroscopy and gas chromatographic method. As a versatile non-destructive technique for fluid inclusion analysis and commonly used to calculate the density of CO2fluids, the chemistry of aqueous fluids, and the molar proportions of gaseous mixtures present as inclusions, the Raman spectroscopy technique has a wide field of applications ranging from qualitative detection of solid, liquid and gaseous components to identification of polyatomic ions in solution. The main advantages of this technique are the minimal sample preparation and the high versatility.
The particle size of the 99.9% purity quartz sample was controlled to 0.5–1.0 mm to avoid damaging the fluid inclusions. According to the respective burst temperatures,the primary inclusions in the quartz were opened by the thermal explosion, and the fluid components were obtained by heat-blast-leaching. The released gas-phase components such as H2O, CO2, CO, H2, N2, and CH4were measured by gas chromatography. Decrepitated mineral was added with deionized water, and ultrasonic extraction was then carried out. The extract liquor was measured by atomic absorption spectrometer for K+, Na+, Ca2+, Mg2+, and other cationic components in the solution, while anion components such as F-, Cl-, SO42-, etc. were determined by ion chromatography or spectrophotometry. In addition, Fe, Cu, Pb,Zn, Sb, Hg, Au, Ag, and other related ore-forming metal elements can be determined by the atomic absorption flameless method as required. Then, the gas and liquid phase components in the mineral inclusions determined were converted into the mass concentration of each component contained in the mineral inclusion aqueous solution.
Conversion of liquid components: At room temperature,1 ml of water weighs about 1 g. First, the mass of water in the analysis result is converted into the volumeVH2O, and the mass concentration ρBof each ion in the inclusion water is calculated via the following formula (Li and Liu 2000):
The volume of inclusion waterVH2O= ωH2O/1000.Mass concentration of ions in a liter of water ρB= ωB/VH2O.
For the measurement data of vapor phase components H2O, CO2, CO, H2, and CH4, a relevant diagram (Li et al.1986) was applied to estimate the temperature, pressure,oxygen fugacity, carbon dioxide fugacity, reduction coefficient, and other geochemical parameters such as pH and Eh of the equilibrium among the components in the mineral inclusions.
4 General characteristics
In general, quartz of the three typical representative lode gold deposits in the area, namely Xiaoyingpan, Zhangquanzhuang, and Dongping, formed each in the three consecutive paragenetic stages and has different characteristics (Yin and Zhai 1994; Yin and Shi 1995), of which,milky white quartz of the early stage and smoky gray quartz of the middle stage has a closer relationship with gold mineralization. The general characteristics of the quartz from Xiaoyingpan are summarized in Table 1.

Table 1 General characteristics of quartz of Xiaoyingpan gold mine
Quartz from Zhangquanzhuang is similar to that of Xiaoyingpan, except that deformation of the milky white quartz of Zhangquanzhuang is weaker than that of the latter, and the two differ in their gas–liquid inclusion shapes. Milky white and smoky gray quartz take clear gradational curved contact with each other, possibly meaning the latter resulted from anatexis of the former.
5 Trace element compositions
Analytical results of gold and other trace elements in quartz from the representative gold deposits are listed in Table 2,and further computer-processed results with SPSS (Statistical Product and Service Solutions) are presented in Table3, from which it can be seen that quartz from both of the gold mines contains Al, K, Na, Cu, Pb, Zn, S, Fe, Ca, C,Sr, As, Sn, Bi, Co, and Ni, but not Rb.

Table 3 continued

Table 3 Correlation matrix of trace elements in quartz of the representative gold deposits

Table 4 Comparison of trace element contents in various typical quartz (× 10–6)
Correlation analysis is a statistical analysis method to study the correlation between two or more random variables in the same position. The correlation coefficient obtained by calculation is a quantitative criterion for judging the correlation between different variables. The specific method of calculating the correlation coefficient is to divide the covariance of two variables by the product of the standard deviation of the two variables. The final result obtained is a dimensionless correlation coefficient between-1.000 and 1.000. The larger the coefficient, the stronger the correlation between the two variables, and the value in the negative range is a negative correlation. The correlation coefficient can be directly embodied in the form of a semimatrix. In the above steps, the original random variables can be imported through the SPSS software, and the correlation coefficient matrix can be directly obtained. The random variable in this paper is the chemical analysis value of the content of each element in the quartz sample. A total of 18 element content correlation coefficients were calculated, and 324 data were obtained and arranged in a semimatrix.
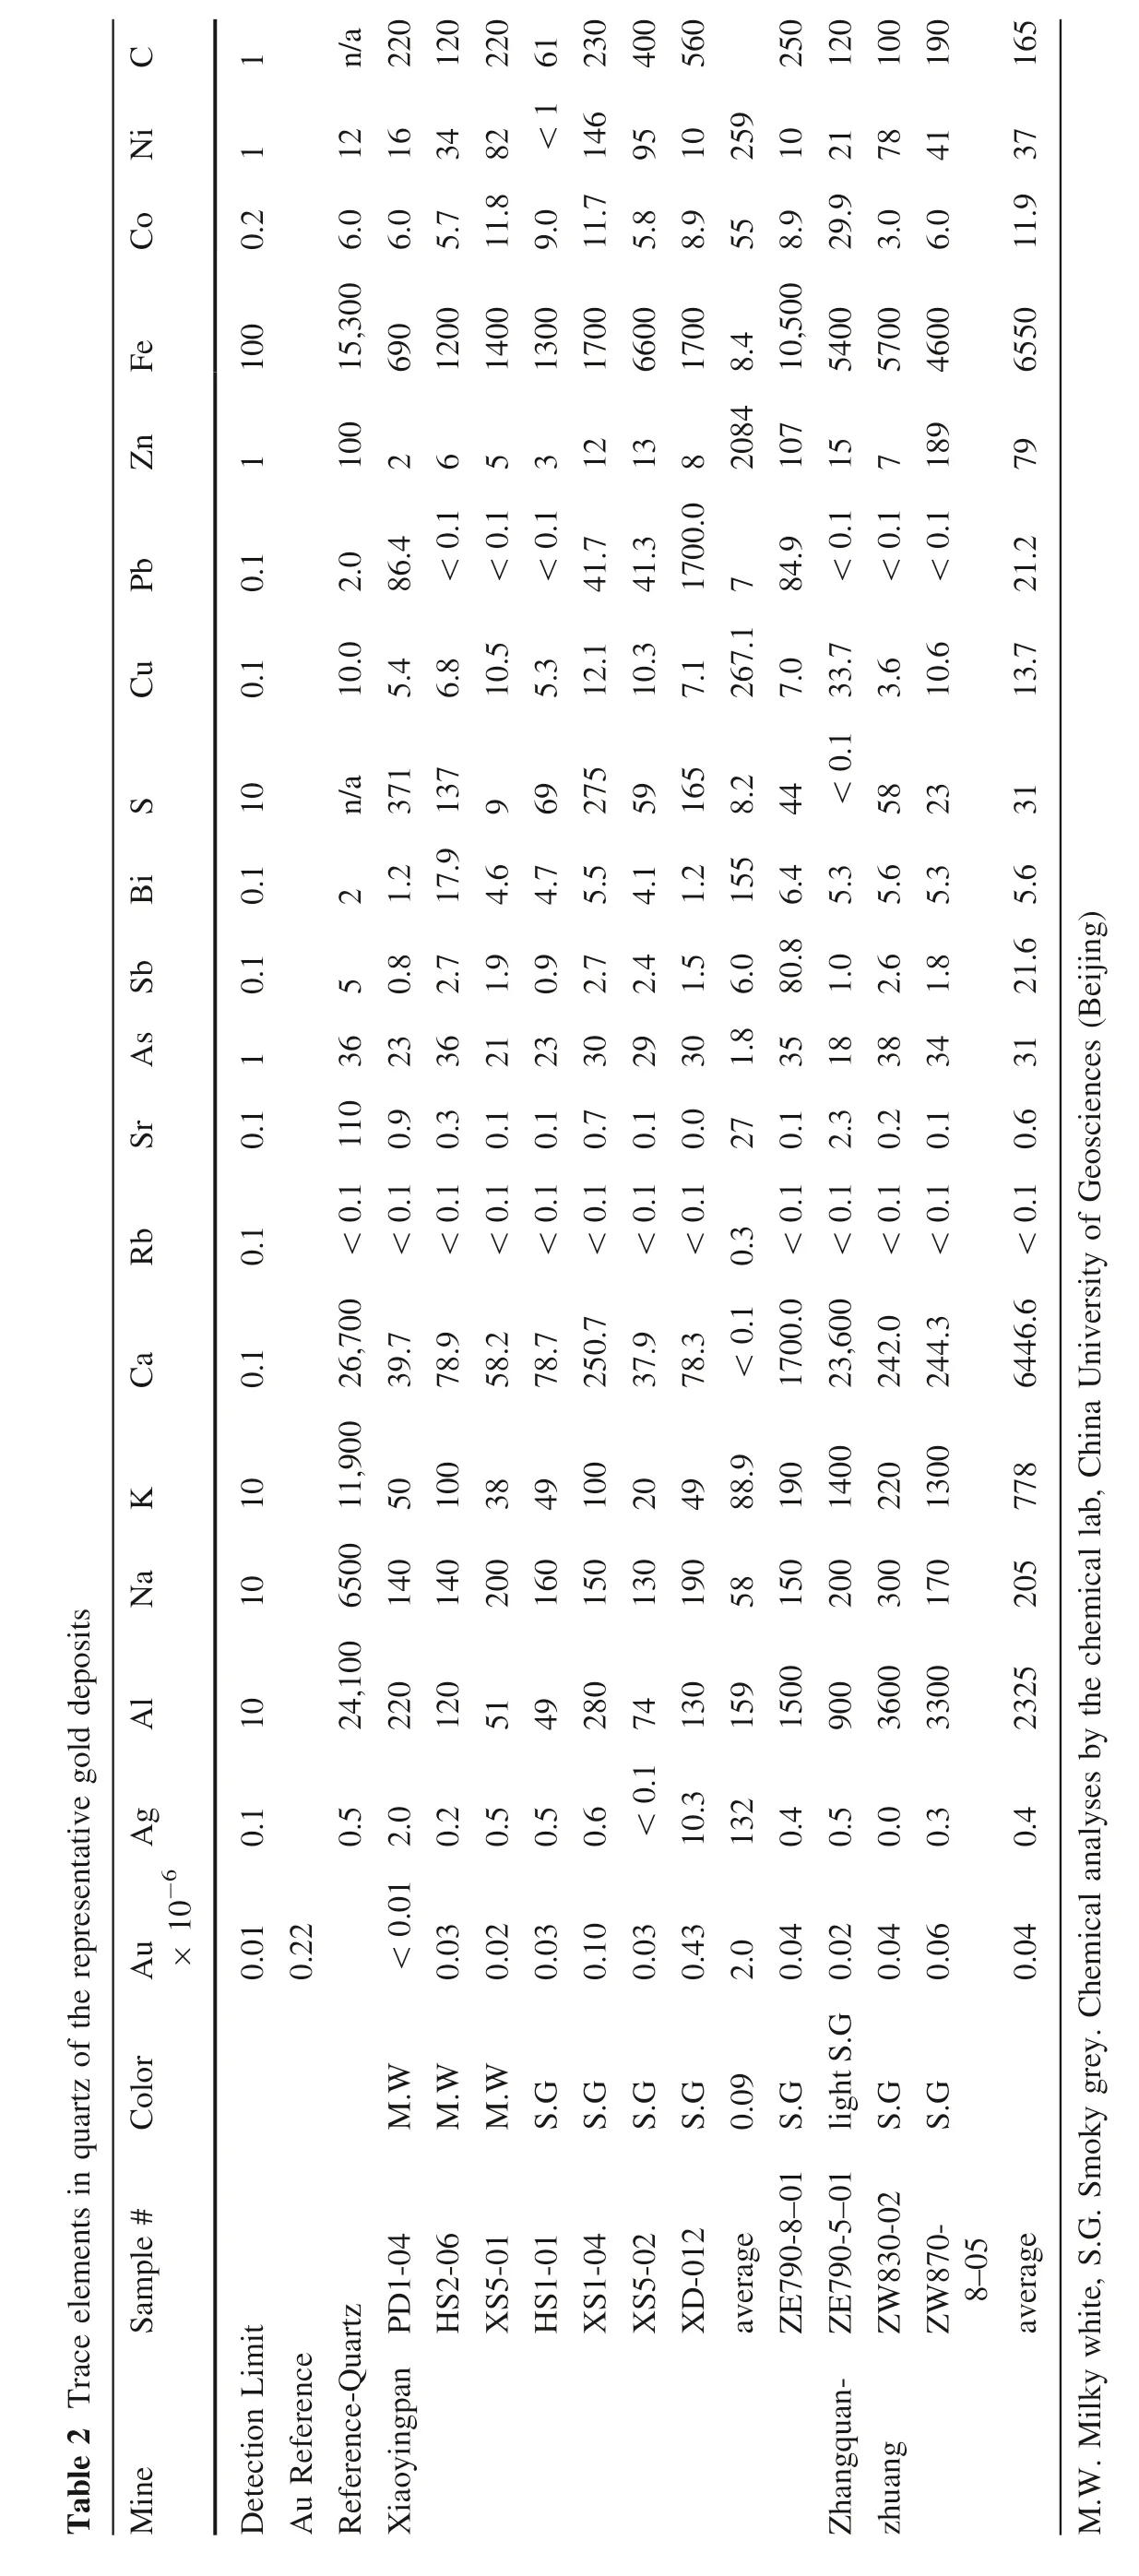
C N i Co Fe Zn Pb Cu 1 1 2 0.100 1 1 0.1 0.a n/220 120 220 230 400 560 250 120 100 190 12 16 34<1 61 95 10 259 10 78 41.0 07.8 82 0.7 146 89.9.9 21 00,300 6 6.5.11 9.11 5.8.55,500 8 29 3.6.15 690 1200 1400 1300 1700 6600 1700.4 10 5400 5700 4600 100 2.1 6.1 5.1 3 12 13.0 8 2084 8 107.1 15.1 7.1 189 0.4.7.3.9 2.86<0<0<0 41 41 1700 84<0<0<0.0.5.1.3.1 7.7.6 10 48 5.6.10 3 5.12 10 1 7.267 0 7..1 33 6 3.10 165.9 37 11 6550 79.2 21.7 13 S B i Sb As Sr 10 1 0.1 0.1 1 0.a n/371 969 275 59 165.2 44<0 58 23 2.9 137 21.17 67 4.4.51 5.4.2 1.155 8.4 36 3 5.5.5..8.7.9.9.7.4.5.0.8 6.0.6.8.1 110 36 5.9 23 0.3 36 2.1 21 1.1 23 0.7 30 2.1 29 2.0 30 1 8 6 1..1 35 80.3 18 1.2 38 2.1 34 1.1 0.1 0.1 0.1 0.1 0.1 0.1 0 27.1 0.1 2.1 0.1 0 31.6.6 5.6 31 21.1 0 ing)i j(Be e s e nc c i os Ge s i t pos de d gol ive a t ent e s pr re the of z r t qua in s nt eme e l e a c 2 Tr e Tabl Rb Ca K Na A l Ag 10-6 Au ×or Col#e mpl Sa ne M i 1 0.<0<0<0<0<0<0,700 <0<0.3.1 0.0 <0<0<0.6 <0.9.7.2.7.7.9.3<0 1700,600 <0.0.3 1 0.,900 26 39 78 58 78 250 37 78 23 242 244 6446 10,100 6500 11 50 100 38 49 100.9 20 49 88 190 1400 220 1300 778 10 140 140 200 160 150 130 190 58 150 200 300 170 205 10 24 220 120 51 49 280.1 74 130 159 1500 900 3600 3300 2325 1.3 0.5 0..0 2 5 5 6 4 5 0 3 4.01 2 0.0.0.0.<0 10 132 0.0.0.0.0.01 0.22 0.<0 03 0.02 0.03 0.10 0.03 0.43 0.004 2.0..02 04 06 04 G 0 0.0.0.S.M.W M.W M.W G S.G S.G S.G S.09 0..G ght G G S.l i S.06 04 01 01 04 02-012 ge 8–01 S 5–01 02 ge n PD1-HS2-XS5-HS1-XS1-XS5-ra 8–05 ra z i t r t XD a ve ZE790-ZE790-ZW830-ZW870-a ve L im e nc Qua n-ion re e-fe nc ngpa c t re te Re ngqua ng De Au fe Re a oyi X i Zha zhua of y i t r s ve Uni na Chi b,la l ca m i che the by e s lys ana l ca m i Che.ey gr Smoky G.S.,te whi lky M i.M.W
In Xiaoyingpan, Au has a positive correlation with Ag,Al, Na, Ca, As, S, Pb, Zn, Co, and C, but a negative correlation with other elements in Table 3. In Zhangquanzhuang, Au has a positive correlation with Al,As, Sb, Bi, S, Pb, Zn, Ni, and C, of which correlation with Zn, As, Al, and C are most obvious and the correlation coefficients are respectively 0.863, 0.710, 0.669, and 0.519.However, Au has a negative correlation with the other elements in Table 3, of which Ca, Sr, Co, and Cu are most clear and the respective correlation coefficients are- 0.842, - 0.830, - 0.795, and - 0.705. The correlative relationships between Au and Ag in quartz from the two gold deposits are opposite: that of Xiaoyingpan is positive with a correlative coefficient of 0.951, while that of Zhangquanzhuang is negative with a coefficient of- 0.204. Meanwhile, there is the opposite correlation between Au and Na, Ca, Sb, Bi, Co, and Ni of the two gold deposits, possibly indicating that their geneses are different from each other.
Comparisons of the major trace elements in quartz from the representative gold deposits with that of quartz from other origins are listed in Tables 4 and 5 and shown in Fig. 2. Al and K contents in quartz and their relationship with wall rocks are listed in Table 6, from which it can be seen that Al and K contents increase when the wall rocks are granitoid rocks, while decrease when the wall rocks are plagioclase amphibolite. Wall rock of Zhangquanzhuang is granitoid migmatite and thus the Al and K contents are higher than that of Xiaoyingpan.

Fig. 2 Spider diagram of trace element contents in various typical quartz

ce sour ta Da 1990 o Sha 1987 n Che r pe pa s Thi,nt eme e l on t i z a l i ra ne M i Ge and As,and Be ,,Ta Sn,W,Ta ,B i,,Nb Be,,,.705)(31),,,,(1–9)(85–.29).34).947),.89)(13 As Cu e s e s .96)(88(27.42)(8 Cu (31(11 Pb ,.5)and nc nc(20 and As,As Co(26–180)Cu(19–20),Co abunda(6)abunda Cu ,,,As ,,.8–4,,(18).56),.321),.927).4125).267)Nb 2)Sb(0 Pb.02).02)(0.647).649),.65)(0 1.Sb Pb kk(2(17(2(6(6 Sr(79(5(0 and a r a r to and Ag,Zn B i Ag B i Sr,,and C l C l Ag Ag Zn,,,(22–46).3–14)(113)Zn and,,the(up the,,Sn,.05).18).46),a nd.7).23).092).567)Be ,Ag .8361)B i,,to(11–690)to .0375).58),(3,Ag ee (0(0(0,840)(31–99),(18(86(267(1(21(21,(258(165)L i Au W Au W Au os c l os c l Au Pb Ba Au Pb Sb C Au Pb Sb C Na 297 297 a n/286–519 160 315 a n/111,300(35).75 0–1 363 130–200(7).6 158 150–300 205(4)10–6)(×s i t pos de of y e t r i K 278 aa n/n/a n/a n/483 4,a 2n/,700(35).14 1–4 1.448 1,20–100(7)58,400 190–1.5 777(4)va a om fr z r t qua ous r i va in s nt eme e l A l 800 2,000 3,a n/550 4,500 3,,700 13 37 a n/,000*(35).16 93–9 103 2,51–280(7)132,600 900–3 325 2,(4)*e)mpl s a of e a c tr of sons r i 5 Compa e Tabl it pos De z z r t r t qua qua z te n r t z t i te r t gma qua n qua pe tungs t i d l l l-gol ta rna rna me he ne r t he r t re Ra Hype Hype Hypoge z r t qua d gol ne soge Me in s ne e,nc z r t m i ovi qua ne dPr ng d n gol hua gol m i l nz ta z the ndong l ngpa r t rma ys c r qua om f r Sha ne ngqua ne the z s t aoyi r t en z r t e a z r t X i m i z r t Zha m i Epi Qua r r na d d Ba Qua the Chi Qua om f r the gol Qua om f r the gol r(numbe ge ra ve/a x.. ~ma in(m
As for the mineralization elements, quartz from Xiaoyingpan is rich in Ni, Pb, and C but poor in Zn, As and Sb,while that from Zhangquanzhuang is rich in Zn, Co and Sr.
The (Cu + Pb + Zn) contents in quartz from both of the gold deposits increase with Au and (Au + Ag) contents(Table 7 and Fig. 3). This results from Au+and Au3+entering the quartz lattice to balance its internal electrovalence unsaturation produced by Al3+replacing Si4+(this will be discussed in detail below). The more Al3+enters quartz, the more Au+and Au3+enter as well; as such, they have a positive correlation with each other.Quartz from both gold deposits contains carbons that have a positive correlation with Au (Tables 2 and 7).
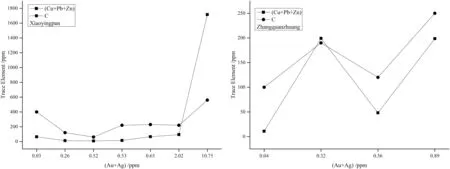
Fig. 3 Trace elements (Cu + Pb + Zn)/C – (Au + Ag) contents
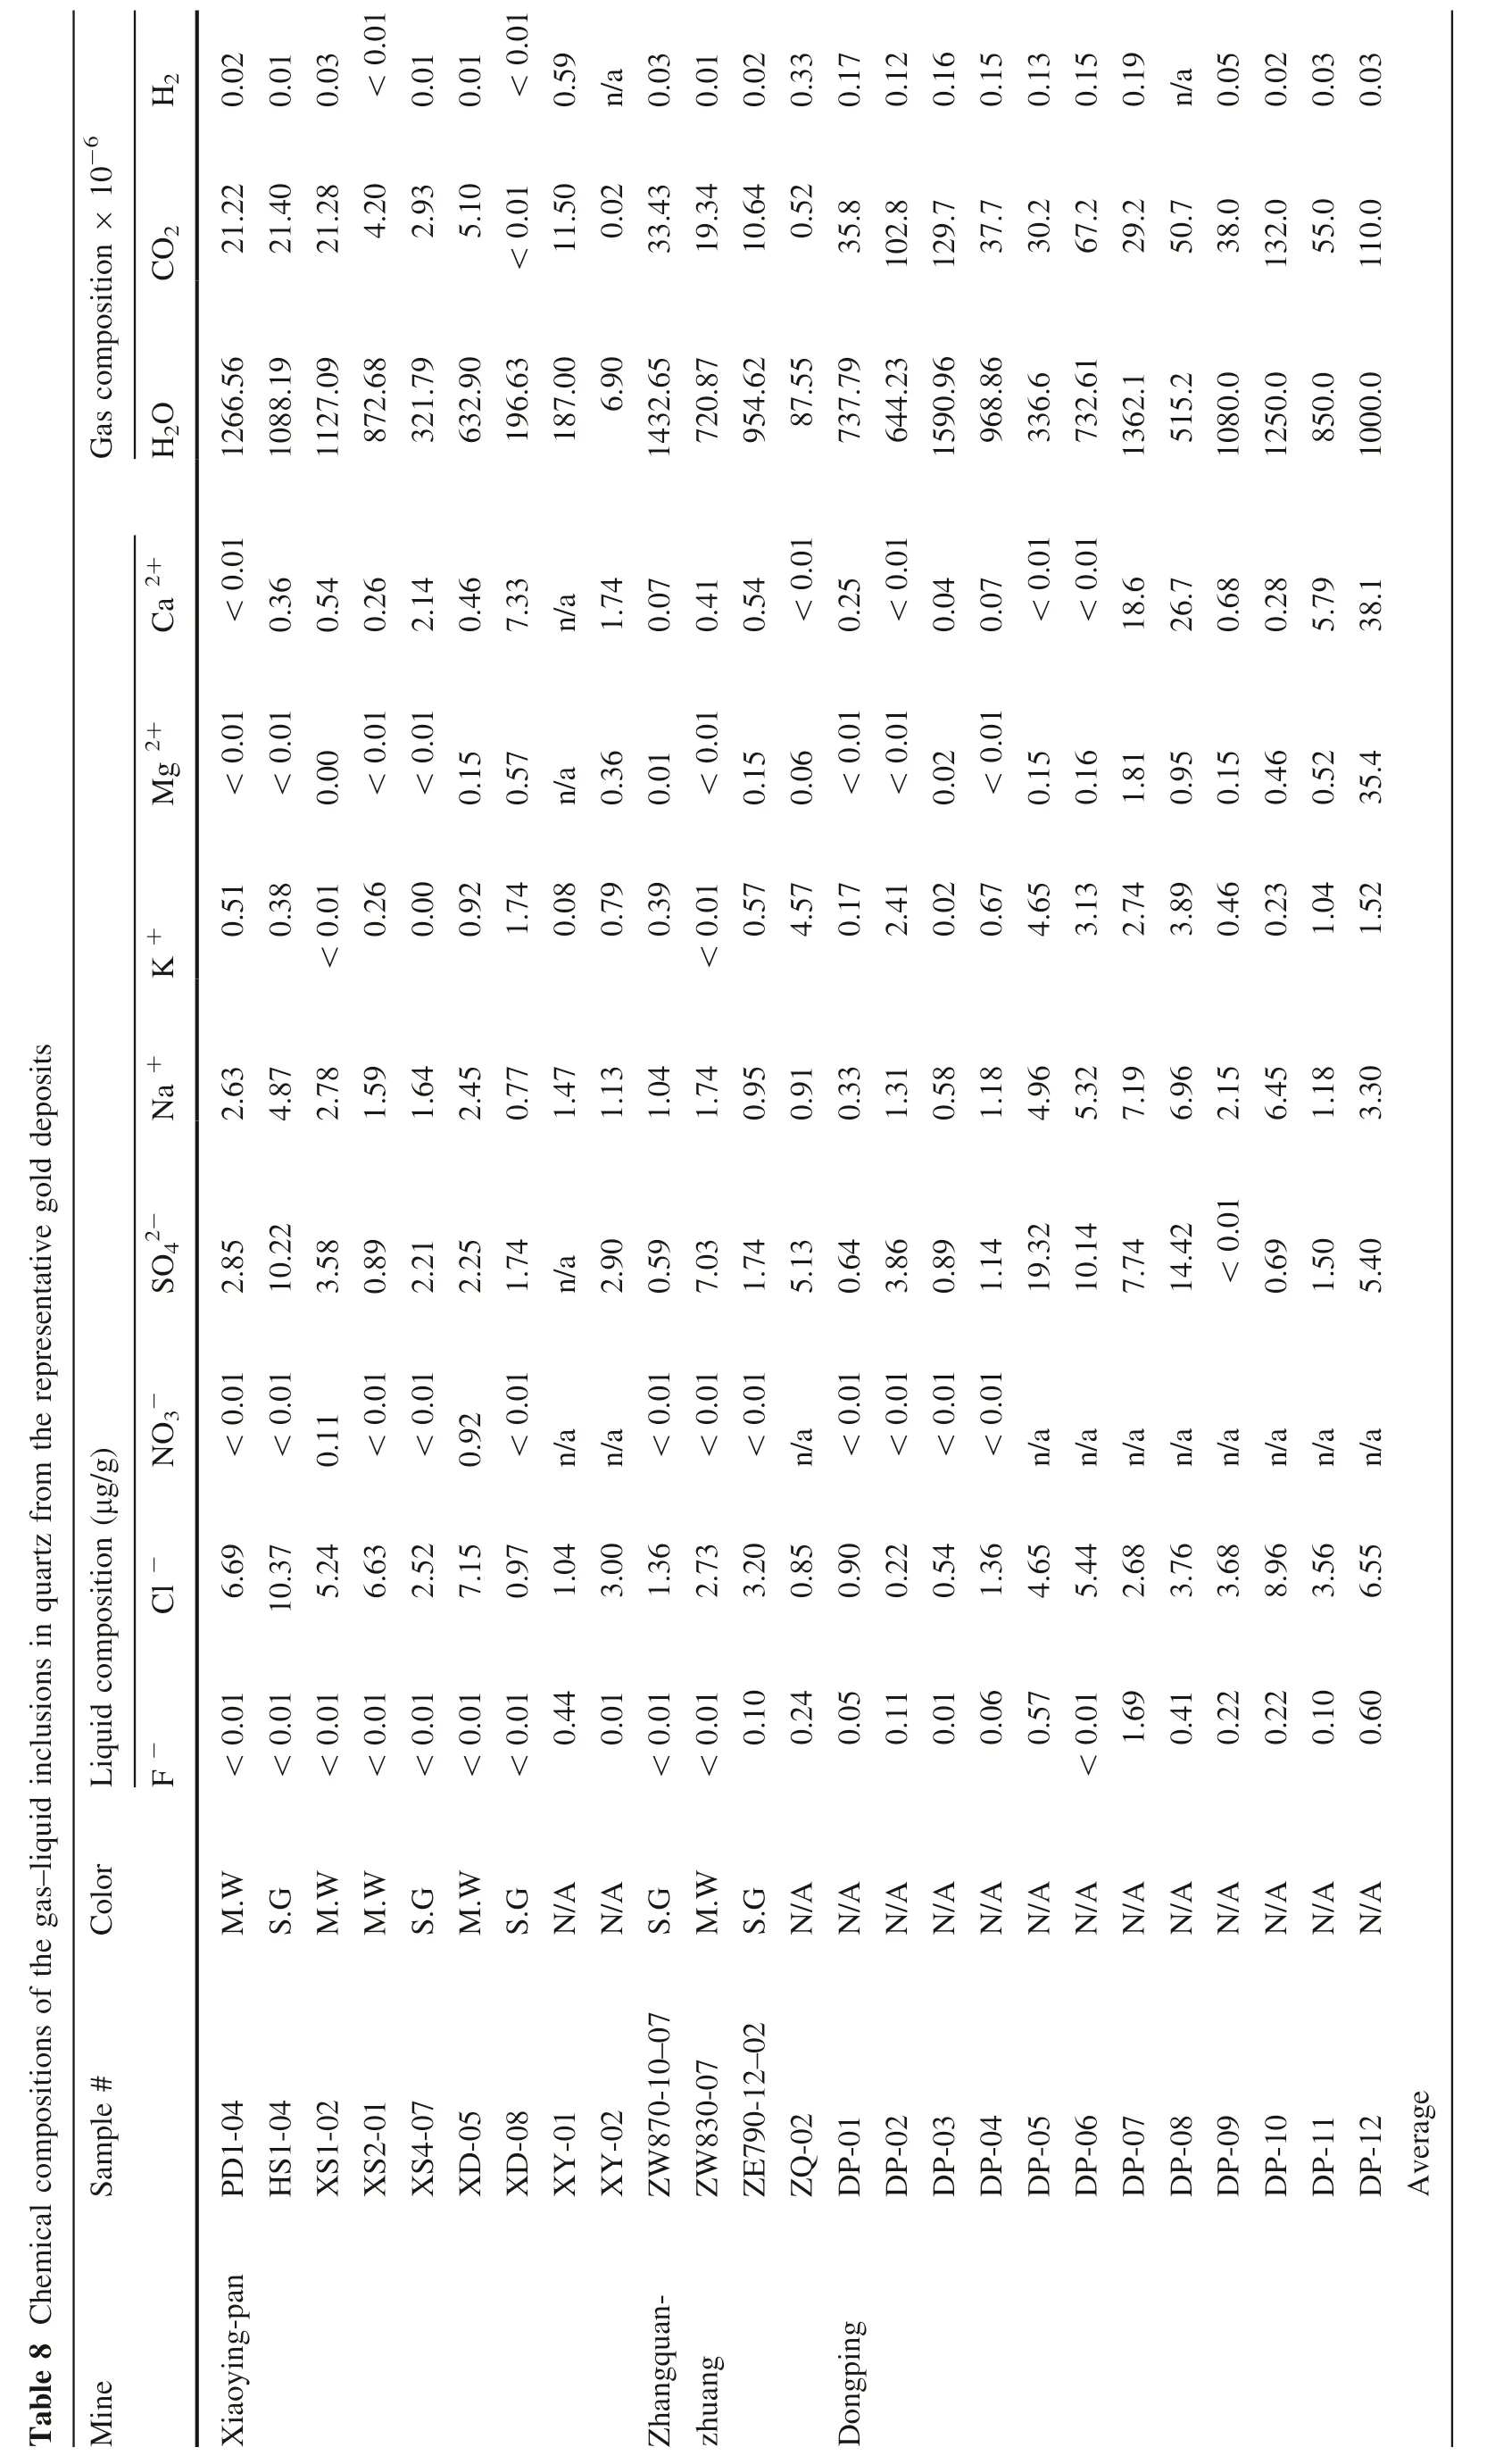
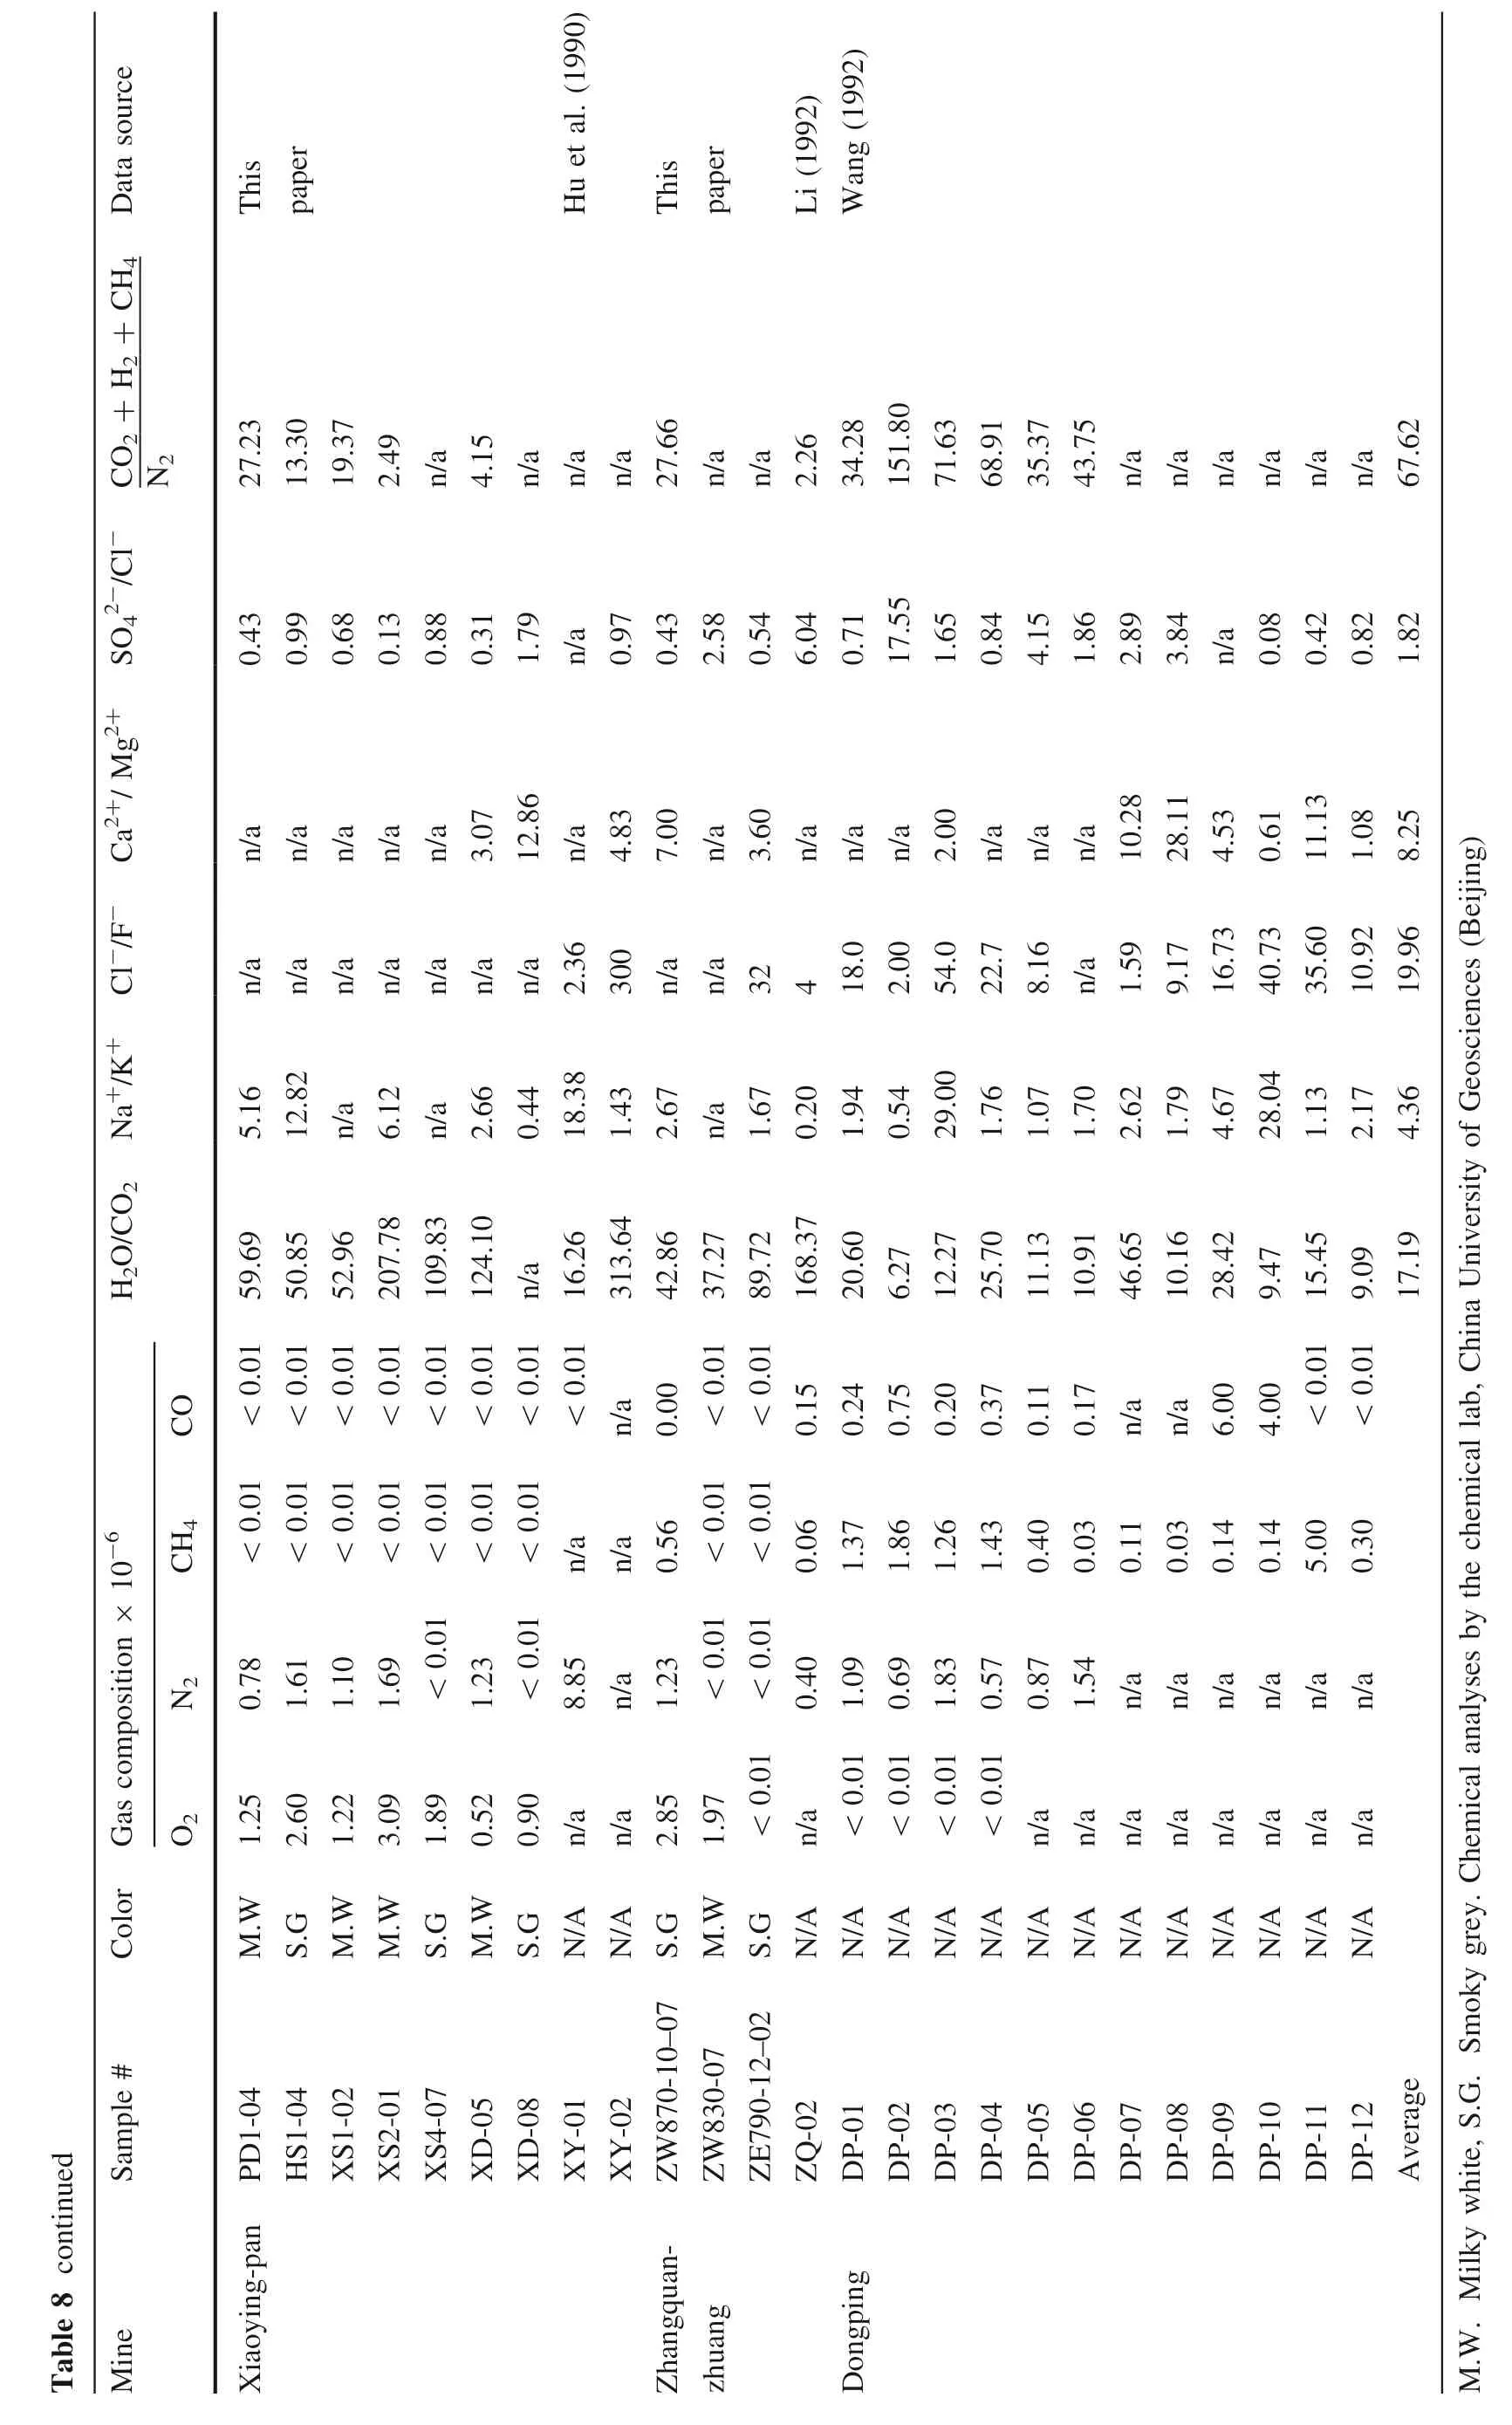
6 Chemical compositions of gas–liquid inclusions
Compositions of gas–liquid inclusions in quartz from the three representative gold deposits are listed in Table 8,from which it can be seen that gases of the inclusions mainly consist of CO2, H2O, H2, and N2, while liquids consist of Cl-, SO42-, Na+, K+, Mg2+, and Ca2+.
When comparing these compositions to that of the gold deposits in eastern Shandong Province, China (Table 9), it can be discovered that.
• Inclusions in the study area are very rich in H2O and H2O » CO2, possibly a result of a lower forming temperature than that of the other deposits in Table 9;
• The ratio of (CO2+ H2+ CH4)/N2of the gold deposits are higher than that of the others in Table 10,indicating that the ore-forming media are richer in CO2and H2than that of the other deposits in the same table;
• As for the ratio of Na+/K+, Xiaoyingpan >Dongping >Zhangquanzhuang, suggesting the forming temperature and depth of the three representative gold deposits are different from each other;
• As for the ratio of Cl-/F-, Xiaoyingpan >Dongping >Zhangquanzhuang, while for the ratio of SO42-/F-, Zhangquanzhuang >Dongping >Xiaoyingpan,demonstrating that the ore-forming media of Xiaoyingpan are rich in Cl-but poor in SO42-, that of Zhangquanzhuang are rich in SO42-but poor in Cl-,and that of Dongping are between the former two. This shows differences in the gold migrating forms in hydrothermal solutions. In addition to the common forms of Au(HCO3)-, Au(CO3)-, Au(HCO3)4-, and Au(CO3)2-, gold of Zhangquanzhuang immigrates in the forms of sulfide colloid, sulfur complex, for instance, Au(HS)2-, and/or thiosulfide complex anion together with SO42-gold of Xiaoyingpan immigrates in the forms of AuCl2-, Na(AuCl4), Na(AuCl2),Na[(Au(Cl3OH)] and Na[Au(Cl2S)]; finally, that of Dongping immigrates mainly in the forms of Xiaoyingpan, with characteristics of both.

ng hua nz ngqua Zha nna ngpa Chi a oyi i,be X i He gou api n li J i J i te ti gma m i A P.A P.(4)(4)325.5 2,777 r(7)pe pa 132(7)s 58 thi(4)(4)1990 o 8 9.7 1.Sha a xi Q i A P.(4)1680(4)300 k oc-r l l wa and z r t qua in s nt eme e l e ac tr e n twe be p hi ons t i la 6 Re e Tabl an adi X i o nda ha ns Sa n sha ongxi ngl L i n ha ongdongs na Chi,ngl ndong L i Sha na Chi,goung ia ie nj ongj Tua i l He ne m i d gol te a ni gr te ani gr te ani gr te ani gr y phyr por te ani G r k oc-r l l wa(5)(5)1680 1044(6)(6)2900 1740(13)(13)2726 2069(7)(7)1987 3186 2386 n Che 1985(8)(8)L i 6950 1990 and n J i zz r t qua r t c e qua in sour in A l ta K da e)mpl sa of r(numbe e,i t bol amphi se la oc agi Pl A.P.
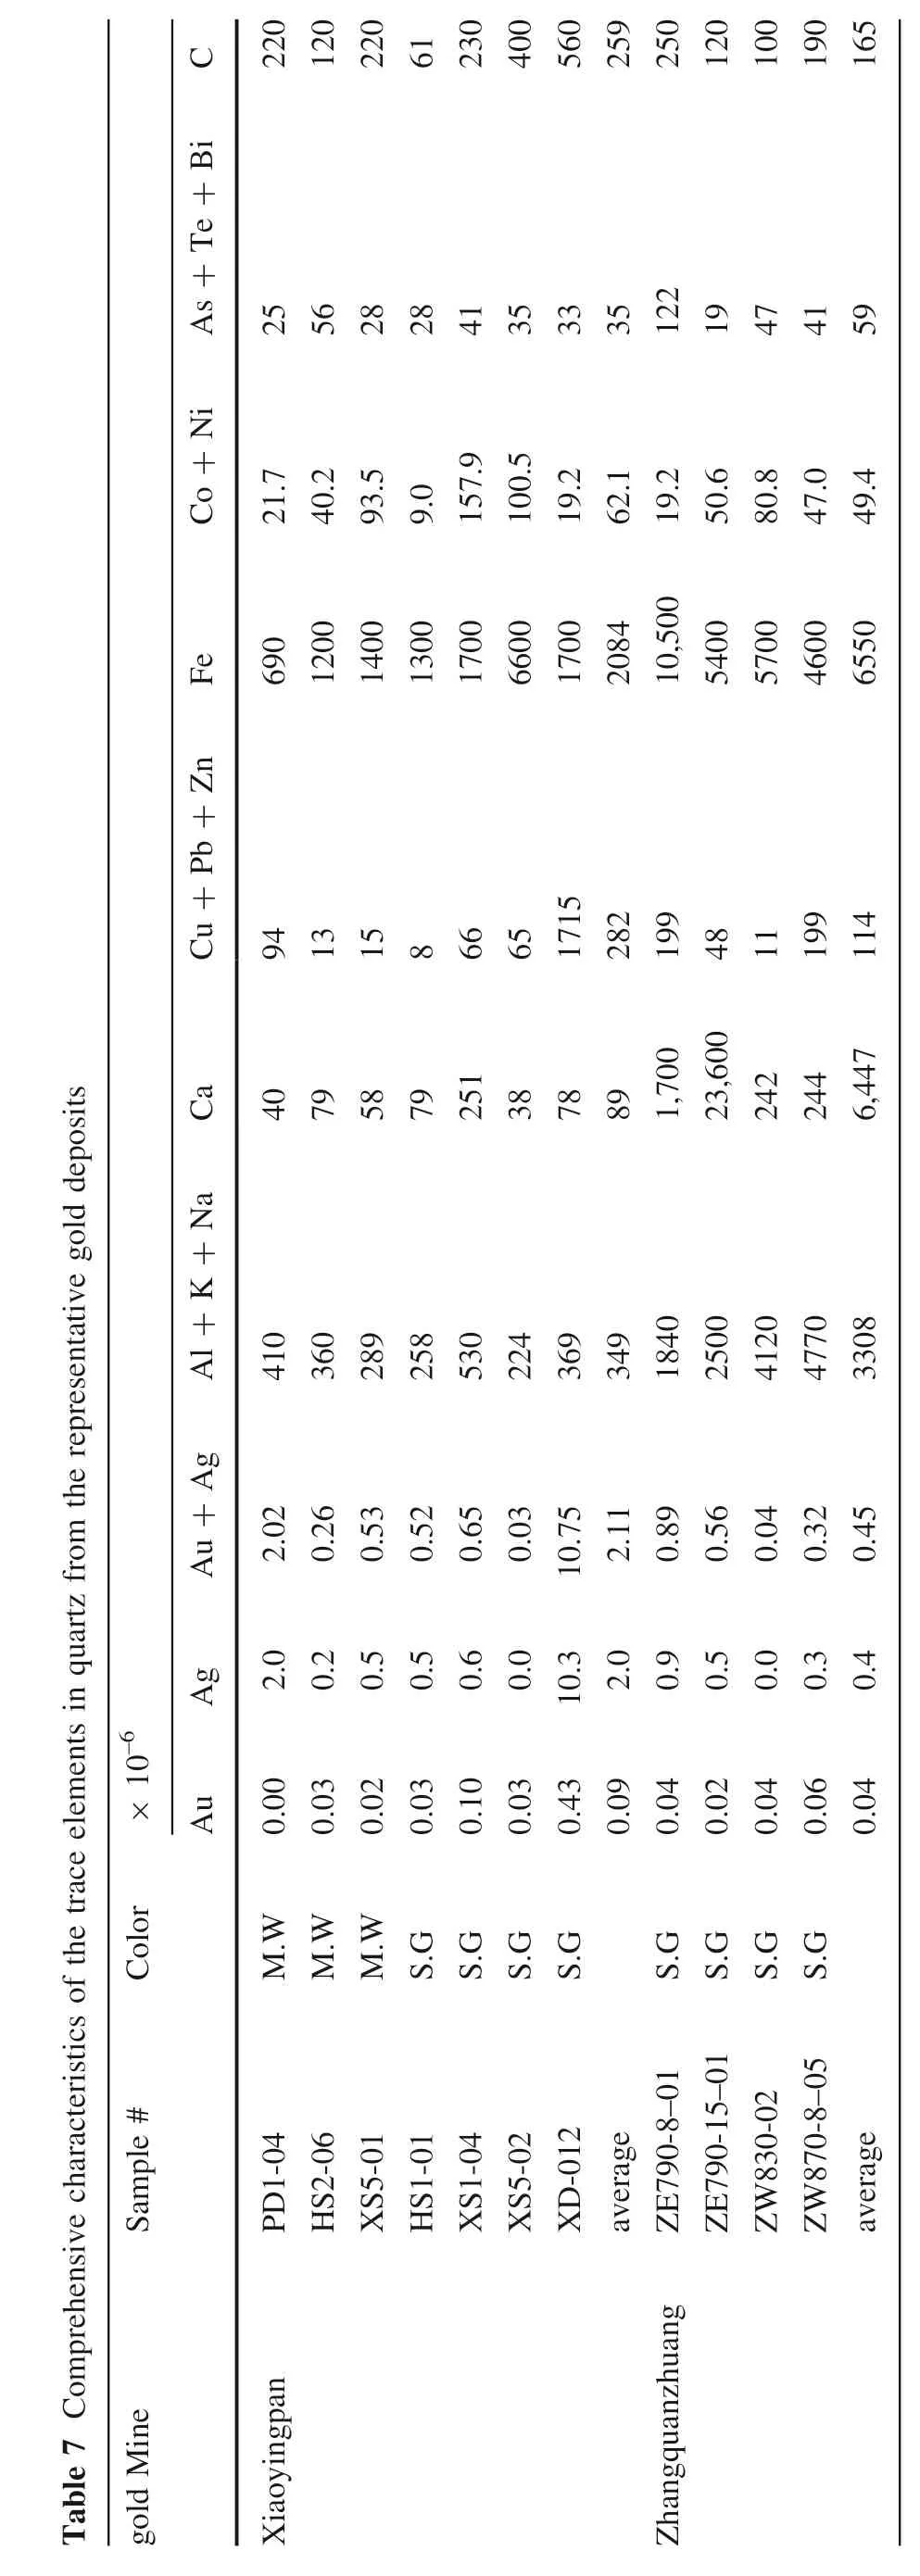
C B i+Te+As N i+Co Fe 220 120 25 56.7.2 21 40 690 1200 220 61 230 400 560 259 250 120 100 190 165 28 28 41 35 33 35 122 19 47 41 59.5.9.5.2.1.2.6.8.0.4 93 0 9.157 100 19 62 19 50 80 47 49 1400 1300 1700 6600 1700 2084,500 10 5400 5700 4600 6550 Zn+Pb+Cu 94 13 15 866 65 1715 282 199 48 11 199 114 s i t pos de d gol ive a t ent e s pr re the om f r z r t qua in s nt eme e l e a c tr the of c s t i is e r c t ra cha ive ns e he 7 Compr e Tabl 10–6×or Col#e mpl Sa ne M i d gol Ca Na+K+A l Ag+Au Ag Au 40 79 410 360 02 2.26 0.02 2.0.00 0.03 0.M.W M.W 04 PD1-06 HS2-n ngpa aoyi X i,600 58 79 251 38 78 89 700 1,23 242 244 447 6,289 258 530 224 369 349 1840 2500 4120 4770 3308 53 0.52 0.65 0.03 0..75 11 89 56 04 32 45 10 2.0.0.0.0.0.55 0.0.60 0.0..3 09 50 34 10 2.0.0.0.0.0.02 0.03 0.10 0.03 0.43 0.09 0.04 0.02 0.04 0.06 0.04 0.M.W G S.G S.G S.G S.G S.G S.G S.G S.8–05 15–01 01 01 04 02-012 ge 8–01 02 ge XS5-HS1-XS1-XS5-ra ra XD ave ZE790-ZE790-ZW830-ZW870-ave ng hua nz ngqua Zha
• The average Ca2+/ Mg2+values of the representative gold deposits have the following relationship (Table 9):Dongping (8.25) >Xiaoyingpan (6.92) >Zhangquanzhuang (5.30) gold deposits, indicating that the ore-forming media of Dongping is rich in Ca2+;
• As for the salinity of inclusions (Table 10), hydrothermal solutions of Xiaoyingpan is a mixture of both metamorphism and migmatization, while that of Dongping is a mixture of both metamorphism and subsurface brine.
In summary, the ore-forming media of Xiaoyingpan is of moderate salinity, weak acid-alkaline Na+-Ca2+-Cl-type,mesogene, mesothermal; that of Zhangquanzhuang is weak-moderate alkaline, Na+-Ca2+-SO42-type, mesogene, mesothermal; while that of Dongping is weak acidalkaline (pH = 6.14 - 8.62), Na+-Ca2+-Cl--SO42-type,mesogene, mesothermal. As for gold immigrations, that of Xiaoyingpan is mainly in the form of Cl complex, that of Zhangquanzhuang in the form of sulfur complex, while that of Donging in the form of between the former two deposits and mainly in the form similar to that of Xiaoyingpan in the early paragenetic stages and in the form similar to that of Zhangquanzhuang in the later stage.
7 Unit cell parameters
The Unit cell parameters of quartz vary with its contents of foreign elements including gold, paragenetic stages, wall rock types, and some other conditions. As a result, the parameters can be used to determine the gold content in quartz, its ore-forming conditions, and even the mineralization scale.
The X-ray diffraction of quartz from the representative gold deposits was conducted at the lab of the China University of Geosciences in Beijing. The raw data were processed with the 9214 program and the unit cell parameters are calculated and listed in Table 11 and shown in Fig. 4. Unit cell parameter scope, range, and averages are listed in Table 12. The results are discussed as follows.

Fig. 4 Unit cell parameter v0 – Au and trace elements (Al + K + Na) contents

Fig. 5 EPR spectra of quartz when T = 300 K
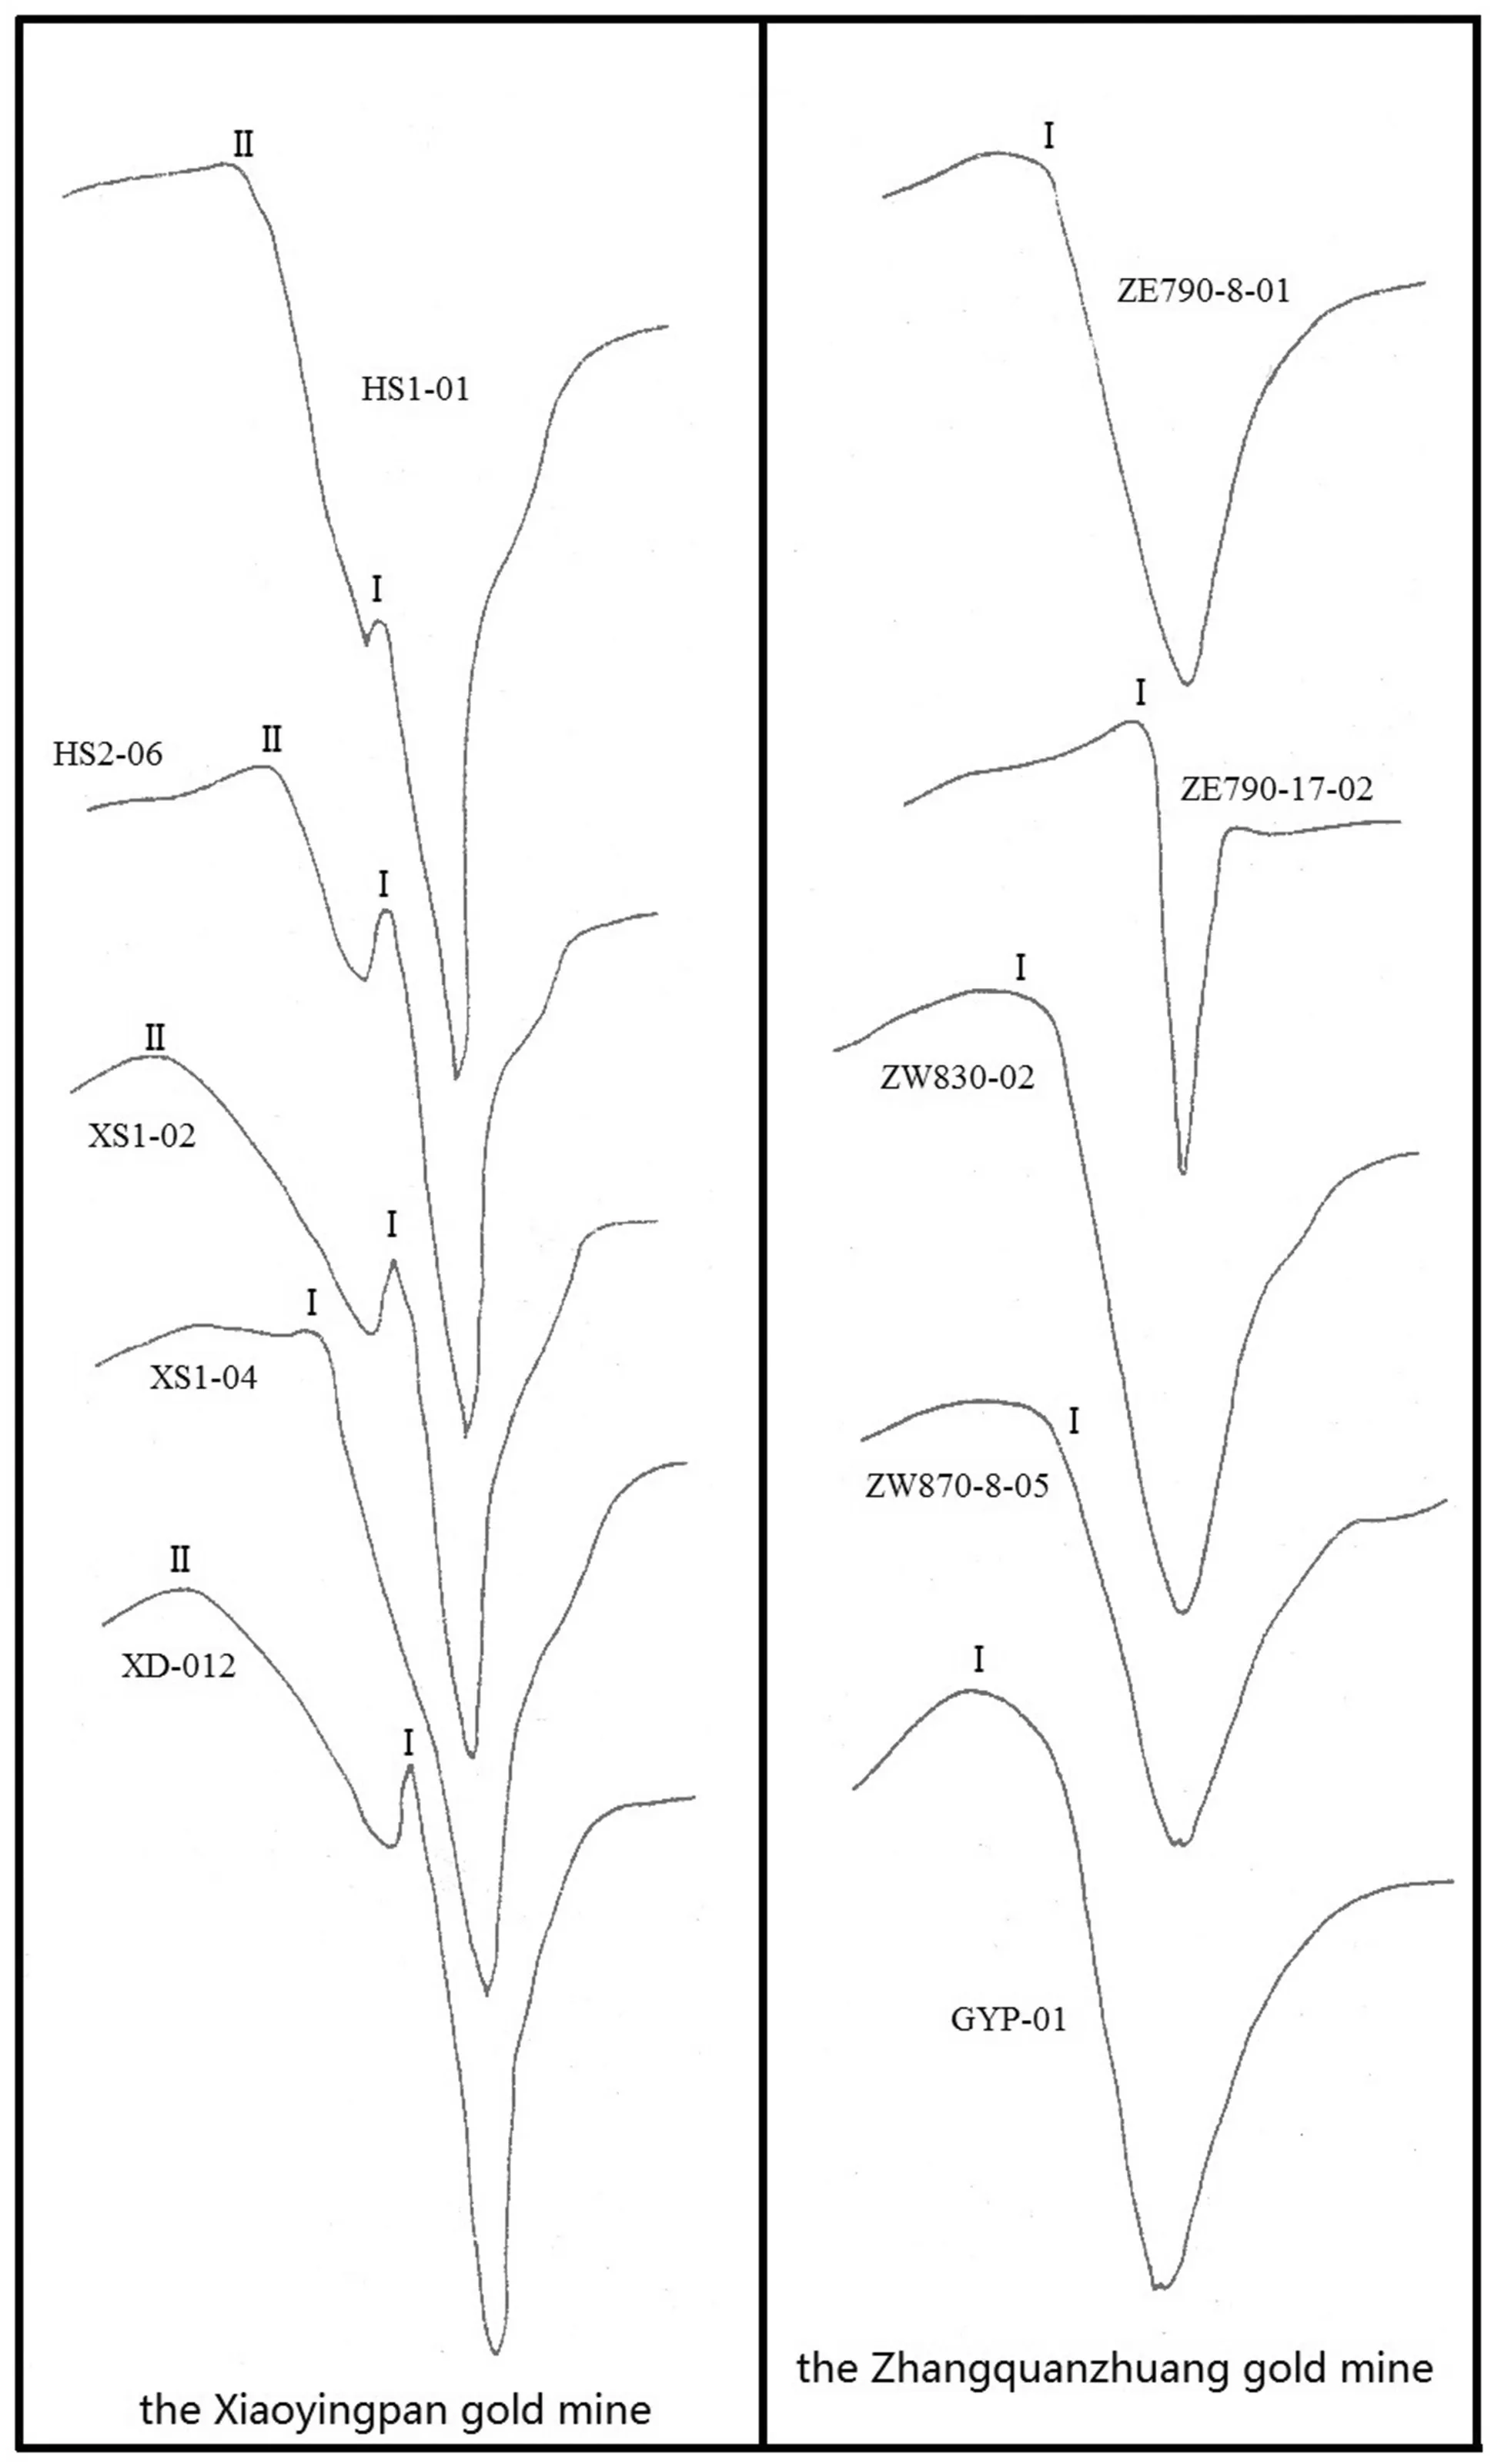
Fig. 6 EPR spectra of quartz when T = 72 K
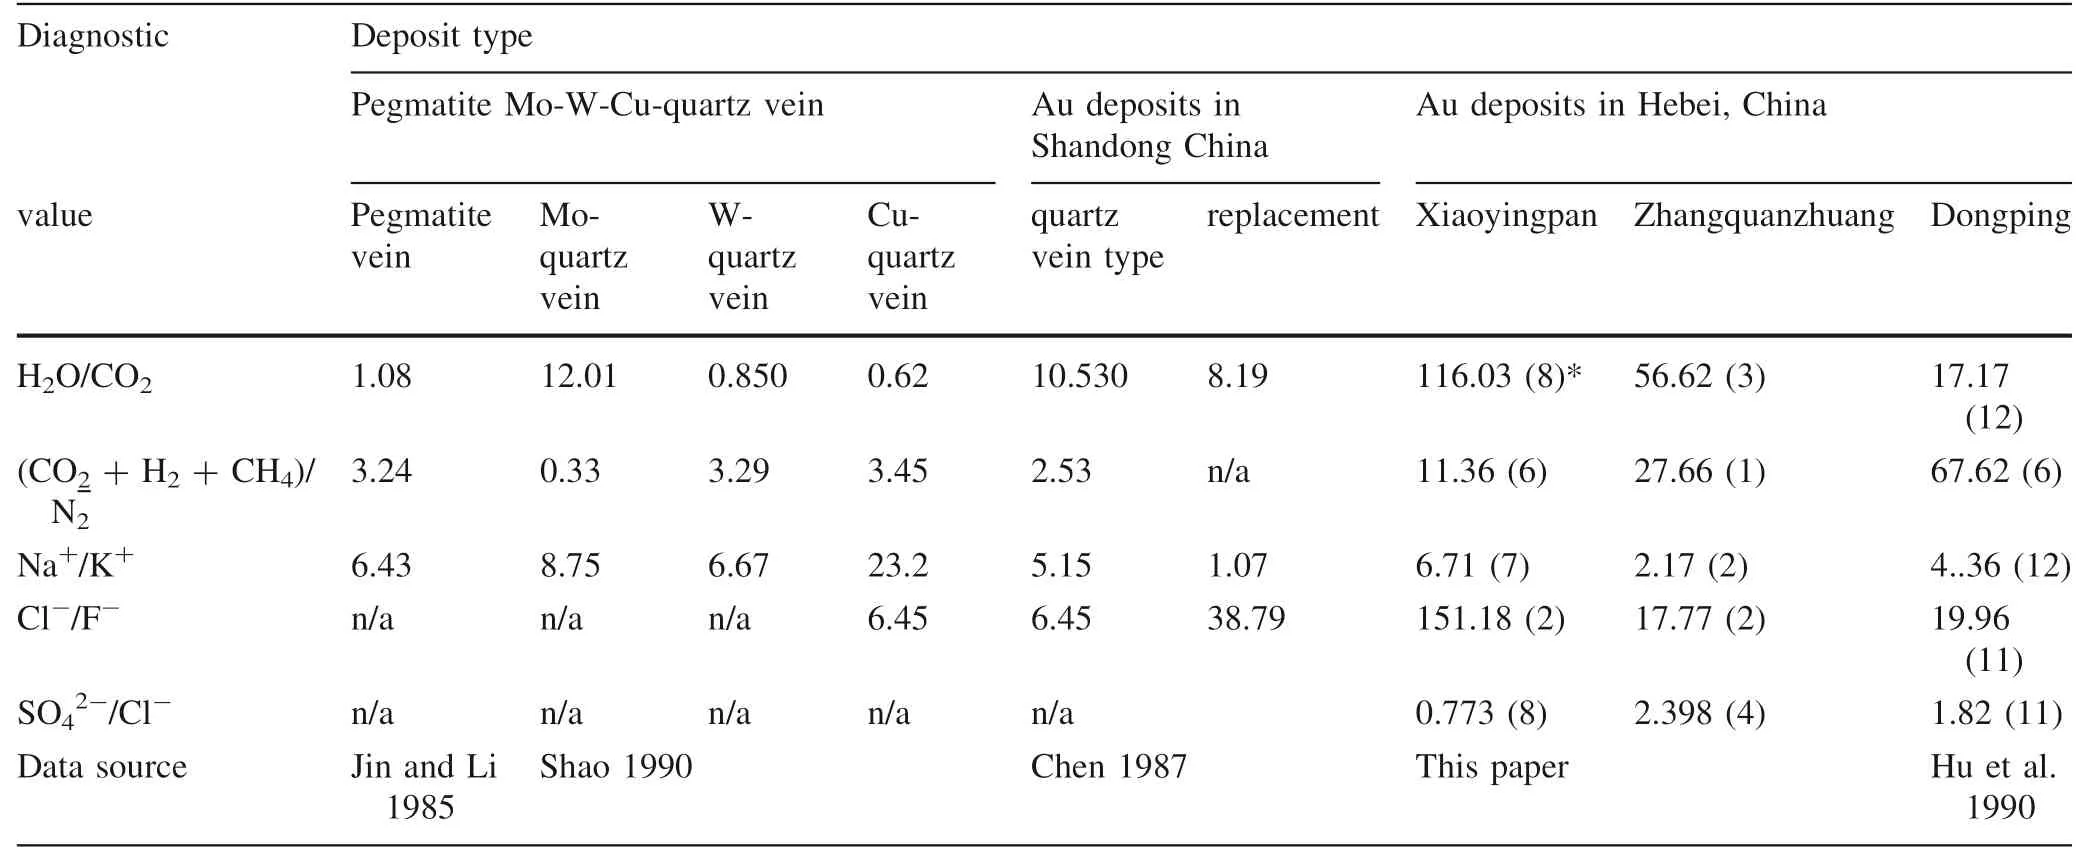
Table 9 Comparison of chemical compositions of the gas–liquid inclusions in quartz from different deposits

Table 10 Salinity of the gas–liquid inclusions in quartz from the representative gold deposits
For Xiaoyingpan, parameters of all 10 samples except for sample series #3 are larger than that of the standard sample, and the 10-sample average parameters are larger than that of the standard sample as well. Unit cell parameter scopes and ranges of quartz from Xiaoyingpan are as follows:

As for Zhangquanzhuang, parameters of all 11 samples except for sample series #11 are larger than that of the standard sample, and the total 11-sample average parameters are larger than that of the standard sample as well.This possibly has something to do with Al and other base metals entering quartz as an isomorphous mixture. Unit cell parameter scopes and ranges of quartz from Zhangquanzhuang are as follows:

.01.01 H2 02 0.01 0.03 0.<0 01 0.01 0.<0 59 0.a n/03 a 0.01 0.02 0.33 0.17 0.12 0.16 0.15 0.13 0.15 0.19 0.n/05 0.02 0.03 0.03 0.10-6×ion CO2.22.40.28 20 93 10.01.50 02 21 21 21 4.2.5.<0 11 0..43.34.64 52.8.8.7.7.2.2.2.7.0.0.0.0 33 19 10 0.35 102 129 37 30 67 29 50 38 132 55 110 i t compos s Ga H2O .56.19.09.68.79.90.63.00 90 1266 1088 1127 872 321 632 196 187 6..65.87.62.55.79.23.96.86.6.61.1.2.0.0.0.0 1432 720 954 87 737 644 1590 968 336 732 1362 515 1080 1250 850 1000 Ca 2+Mg 2+K +.01<0 36 0.54 0.26 0.14 2.46 0.33 7.a n/74 1..01.01.01.01<0<0 00 0.<0<0 15 0.57 0.a n/36 0.51 0.38 0..01 26 00 92 74 08 79<0 0.0.0.1.0.0..01.01.01.01 07.6.7.1 0.41 0.54 0.<0 25 0.<0 04 0.07 0.<0<0 18 26 68 0.28 0.79 5.38.01.01.01.01 01.4 0.<0 15 0.06 0.<0<0 02 0.<0 15 0.16 0.81 1.95 0.15 0.46 0.52 0.35 39 0..01 57 57 17 41 02 67 65 13 74 89 46 23 04 52<0 0.4.0.2.0.0.4.3.2.3.0.0.1.1.s i t pos de Na +63 2.87 4.78 2.59 1.64 1.45 2.77 0.47 1.13 1.04 1.74 1.95 0.91 0.33 0.31 1.58 0.18 1.96 4.32 5.19 7.96 6.15 2.45 6.18 1.30 3.d gol ive a t ent e s pr re the om f r z r t qua in ions lus inc g)(μg/ion i t compos d qui L i 2-SO4-NO3-C l F -.01 85.22.32.14.42 2.10 58 3.89 0.21 2.25 2.74 1.a n/90 2.59 0.03 7.74 1.13 5.64 0.86 3.89 0.14 1.19 10 74 7.14<0 69 0.50 1.40 5..01.01.01.01.01.01.01.01.01.01.01.01<0<0 11 0.<0<0 92 0.<0 aa n/n/<0<0<0 a n/<0<0<0<0 aa n/n/aa n/n/aa n/n/aa n/n/69 6..37 24 63 52 15 97 04 00 36 73 20 85 90 22 54 36 65 44 68 76 68 96 56 55 10 5.6.2.7.0.1.3.1.2.3.0.0.0.0.1.4.5.2.3.3.8.3.6..01.01.01.01.01.01.01 44 01.01.01 10 24 05 11 01 06 57.01 69 41 22 22 10 60<0<0<0<0<0<0<0 0.0.<0<0 0.0.0.0.0.0.0.<0 1.0.0.0.0.0.d iqui s–l ga the or Col M.W G A A A A A A A A A A A A A A S.M.W M.W G S.M.W G S.N/AG N/S.M.W G S.N/N/N/N/N/N/N/N/N/N/N/N/N/of ions i t compos#e mpl Sa 04 PD1-04 HS1-02 XS1-01 XS2-07 XS4--05-08-01-02 XD XD XY XY 10–07 ZW870-07 ZW830-12–02 ZE790--02 01 02 03 04 05 06 07 08 09 10 11 12 ZQ DPDPDPDPDPDPDPDPDPDPDPDPge ra Ave l c a m i 8 Che e Tabl ne M i n pa ngaoyi X i n-ngqua ng Zha zhua ng Dongpi
c e sour ta Da r s Thi pe pa(1990).a l e t Hu r s Thi pe pa(1992)(1992)ng L i W a 4 CH+2 H+2 CO N2-C l 2-/SO4.23.30.37 27 13 19 49 a aa a 2.n/15 4.n/n/n/43 0.99 0.68 0.13 0.88 0.31 0.79 1.a n/97 0..66.28.80.63.91.37.75 27 aa n/n/26 2.34 151 71 68 35 43 aa n/n/aa n/n/aa n/n/43.55 0.58 2.54 0.04 6.71 0.17 65 1.84 0.15 4.86 1.89 2.84 3.a n/08 0.42 0.82 0..62 67 82 1.Mg2+Ca2+/aa .86 n/n/aa n/n/a n/07 3.12 a n/83 4.00.28.11.13 7.a n/60 3.aa n/n/a n/00 2.aa n/n/a n/10 28 53 4.61 0.11 08 1.25 8.ing)i j F--/C l K+Na+//CO2 H2O aa n/n/aa n/n/aa n/n/a n/36 2.300 16.82.38 5.12 a n/12 6.a n/66 2.44 0.18 43 1..69.85.96.78.83.10.26.64.01 59 50 52 207 109 124 a n/16 313.01.01.01.01.01.01.01 aa .0.0.7.73.73.60.92 n/n/32 418 00 2.54 22 16 8.a n/59 1.17 9.16 40 35 10 67 a .00.04 2.n/67 1.20 0.94 1.54 0.29 76 1.07 1.70 1.62 2.79 1.67 4.28 13 1.17 2..86.27.72.37.60.27.70.13.91.65.16.42.45 42 37 89 168 20 27 6.12 25 11 10 46 10 28 47 9.15 09 9..01.01.01.01.96 19 36 4..19 17(Be e s enc c i os Ge of y i t rs ve Uni na Chi CO <0<0<0<0<0<0<0<0 a n/00 0.<0<0 15 0.24 0.75 0.20 0.37 0.11 0.17 0.aa n/n/00 6.00 4.<0<0 b,la l 10-6 CH4.01.01.01.01.01.01.01<0<0<0<0<0<0<0 aa n/n/.01.01 56 0.<0<0 06 0.37 1.86 1.26 1.43 1.40 0.03 0.11 0.03 0.14 0.14 0.00 5.30 0.c a m i che the×ion i t compos s or Ga Col N2 O2.01.01.01.01 78 a aa aa aa 0.61 1.10 1.69 1.<0 23 1.<0 85 8.n/23 1.<0<0 40 0.09 1.69 0.83 1.57 0.87 0.54 1.n/n/n/n/n/n/.01.01.01.01.01 25 1.60 2.22 1.09 3.89 1.52 0.90 0.aa n/n/85 2.97 1.<0 a n/<0<0<0<0 aa n/n/aa n/n/aa n/n/aa n/n/M.W G A A A A A A A A A A A A A A S.M.W M.W G S.M.W G S.N/AG N/S.M.W G S.N/N/N/N/N/N/N/N/N/N/N/N/N/by e s lys a na l c a m i Che.ey gr d inue#e mpl Sa 04 PD1-04 HS1-02 XS1-01 XS2-07 XS4--05-08-01-02 XD XD XY XY 10–07 ZW870-07 ZW830-12–02 ZE790--02 01 02 03 04 05 06 07 08 09 10 11 12 ZQ DPDPDPDPDPDPDPDPDPDPDPDPge ra Ave Smoky G.S.,te whi ont 8 c e Tabl ne M i n pa ngaoyi X i n-ngqua ng Zha zhua ng Dongpi ky i l. M M.W
Unit cell parameters of quartz from the two gold deposits are close to each other, and both are larger than that of quartz from gold deposits in the eastern Shandong Province of China, which are respectively Δα = 0.0076 × 10⁻¹⁰m, Δc= 0.0095 × 10⁻¹⁰m, and ΔV= 0.0714 × 10⁻³⁰m3(Chen 1987), possibly indicating that formation of the two gold deposits were of multiphase, multi-stage and multi-source.
Except for the series #1 sample, unit cell parameters of all other samples of both gold deposits tend to increase with the increase of (Al + Na + K) values in the quartz.
According to Table 12, the average unit cell parameters of the smoky quartz are larger than that of the milky white quartz of the same deposit. Considering that white quartz with lower gold content formed at higher temperatures in the early paragenetic stages, while smoky quartz with higher gold content formed at lower temperatures in the later paragenetic stages, it may be concluded that the higher the forming temperature and the lower the gold content in quartz, the smaller the unit cell parameters, and vice versa. The larger unit cell parameters have to do both with Al+, Na+, and K+entering quartz lattice and with Au+and Au3+in quartz lattice, which will be discussed below.
The average unit cell parameters of quartz from Zhangquanzhuang are larger than that of Xiaoyingpan,partly due to the ore of the former being rich in sulfide,while that of the latter being poor in sulfide. In addition, the ore-forming temperature of Xiaoyingpan is higher than that of Zhangquanzhuang1; namely, unit cell parameters of quartz have a negative correlation with ore-forming temperature.
8 Electron paramagnetic resonance spectrum(EPR)
The EPR measurement of quartz was carried out at the EPR lab in the Department of Physics at Peking University,China. Lab test conditions are described respectively at the bottoms of both Tables 13 and 14. The EPR test was carried out on 10 quartz samples of different colors from both Xiaoyingpan and Zhangquanzhuang, each of which has 5 samples, to confirm if there is any lattice gold available in quartz in the area. To confirm the relationship between EPR and temperature, the measurements were done both atT= 300 K andT= 72 K. The results are shown in Figs. 5 and 6 and Tables 13 and 14.
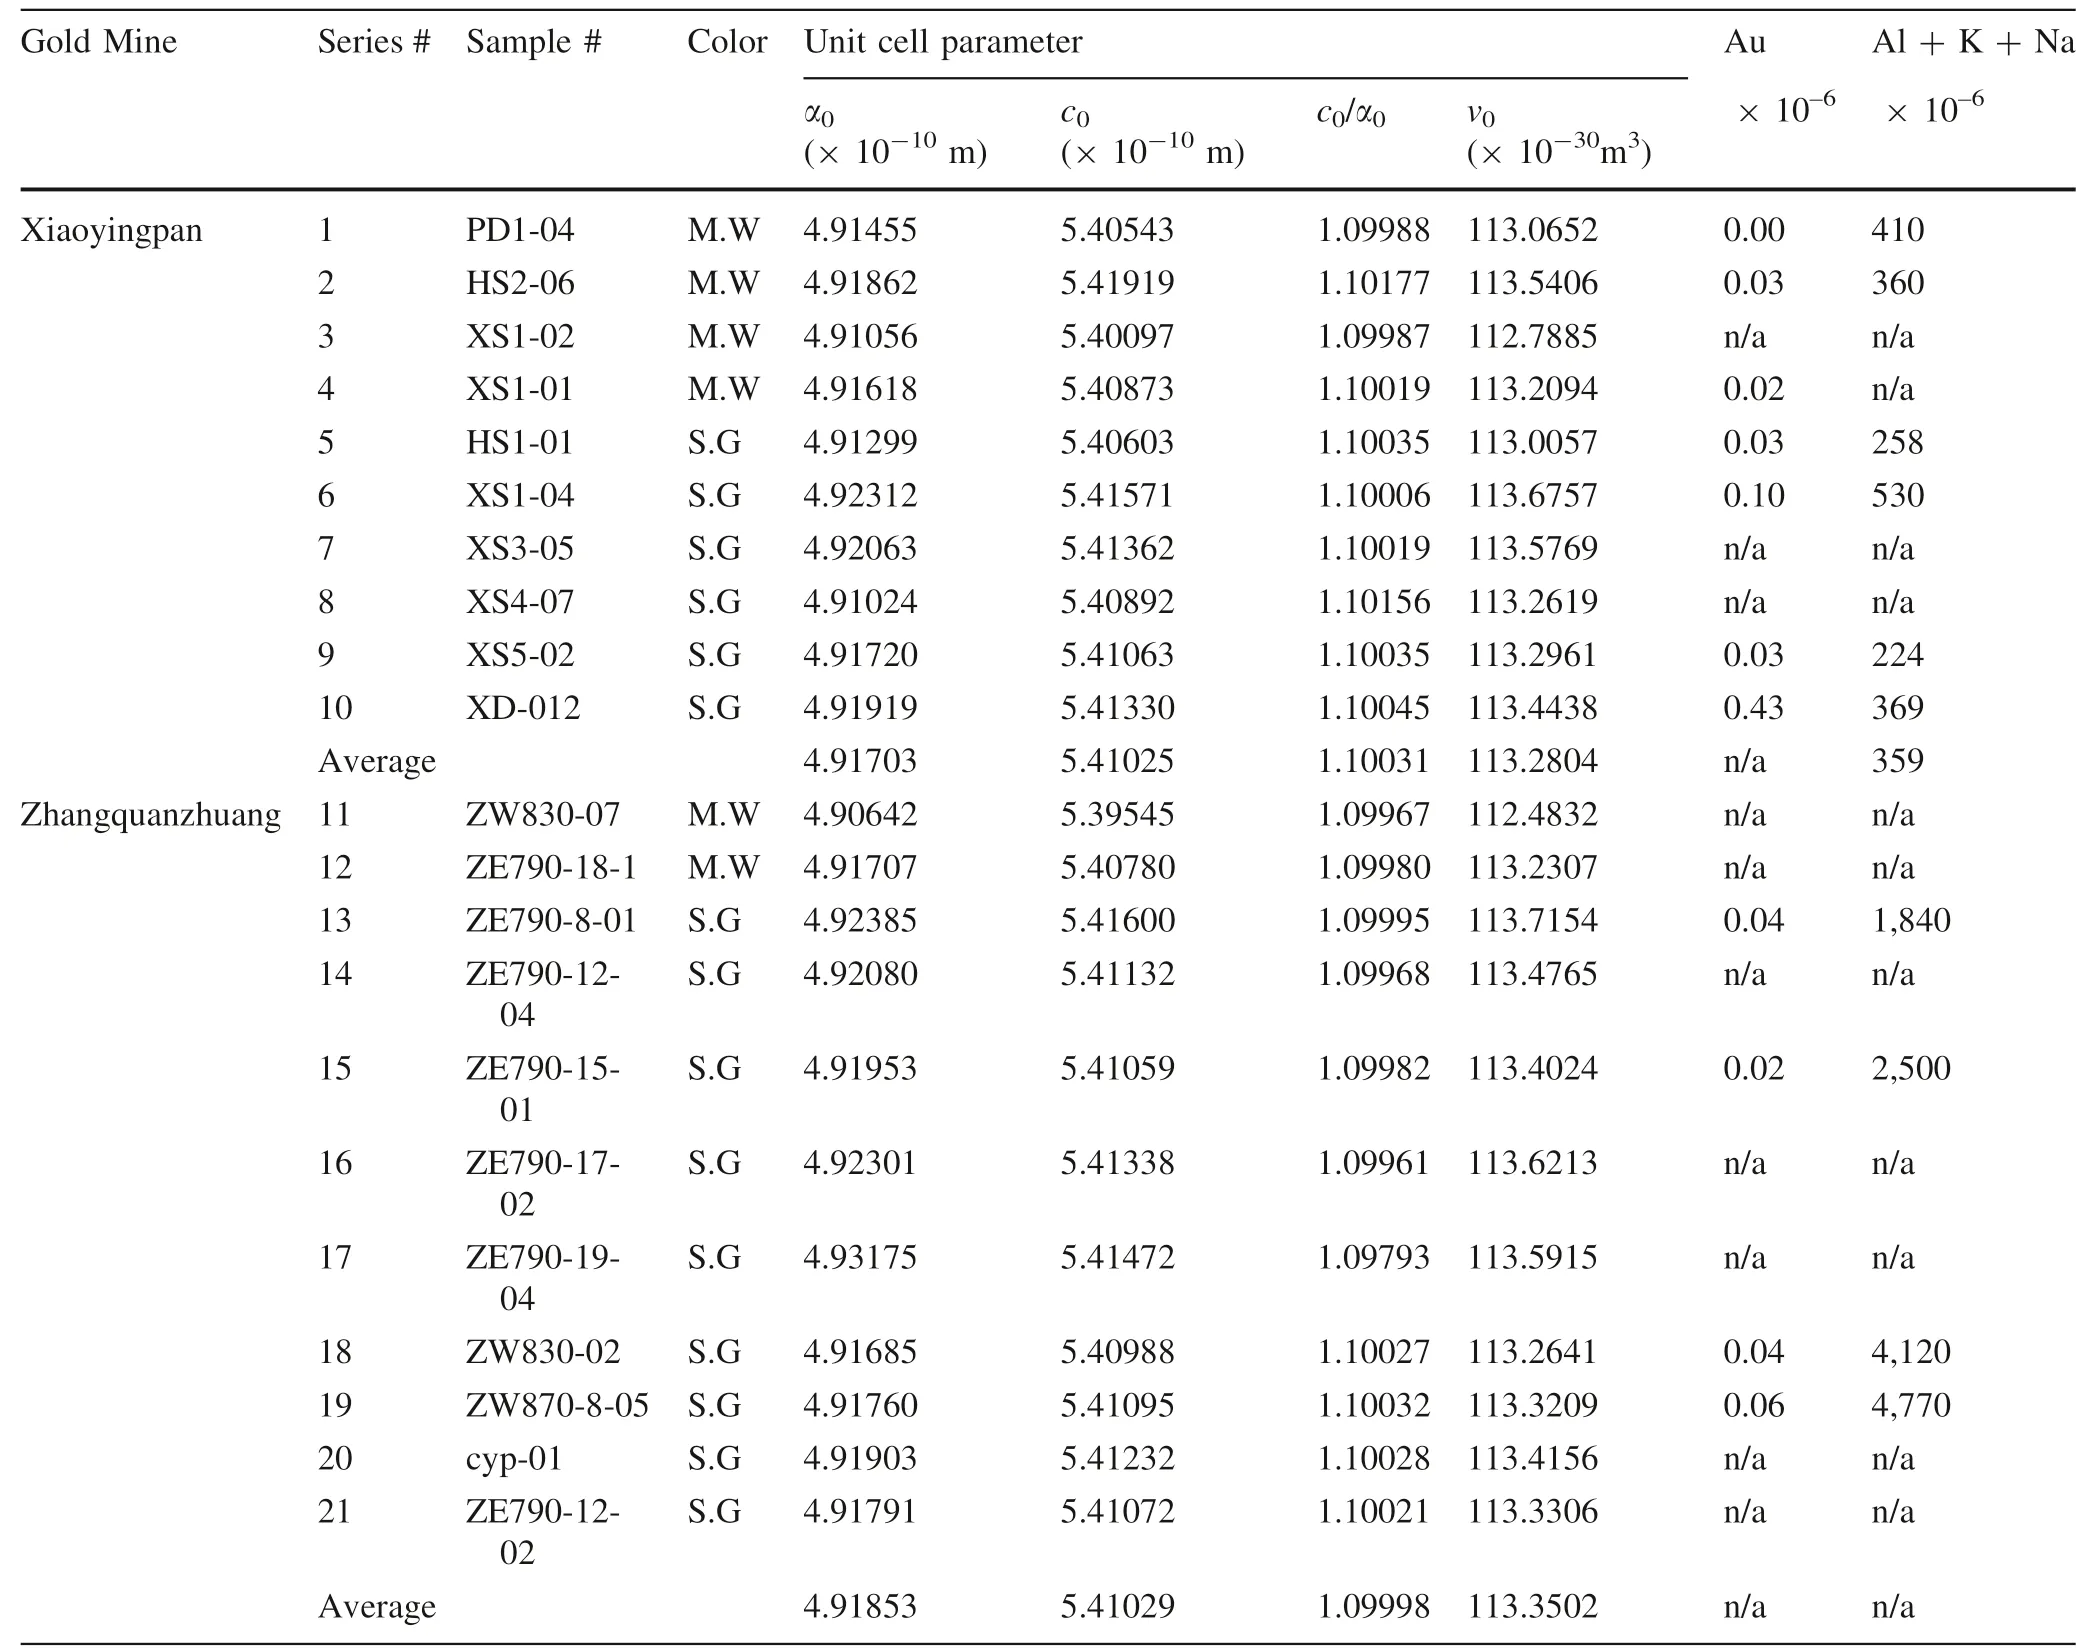
Table 11 Unit cell parameters of quartz of the representative gold deposits
The study targets of EPR are those materials with unpaired electrons, for instance, paramagnetic foreign ions and/or electron–hole centers available in the crystal structure, all of which are called paramagnetic centers, namely those unpaired electrons and/or ion free radicals. Paramagnetic centers can be divided into groups of point defect,line defect, and plane defect. Generally, paramagnetic center refers to a point defect mainly resulting from anion and/or cation holes, foreign ions and disordered distribution of atoms, and so forth.
Natural quartz has a variety of paramagnetic centers, of which the most common and important type is the O--Al center (also called Al center); the formation of foreign element centers resulting from Al3+inequivalence replacement with Si4+. The O--Al center is a type of hole center with agfactor close to thege(= 2.0023 ± 0.001) of free electrons. Because it is at a non-cubic symmetry location, the O--Al center demonstrates a characteristic of anisotropy. When expressing thegfactors of O--Al centers in quartz in the form of an optical indicatrix,g1=g2-=g⊥= 2.0045,g3=g‖= 2.0590. The O-–Al center in quartz is stable when the temperature is below 300 °C. The quartz’s smoky grey color partly results from its O--Al center. Fe3+, Co2+, Ni2+, Cu2+, Mn2+, Cr3+, and Au in quartz show absorption band/line on EPR (Chen, 1987).This is the theoretical basis for the authors of this paper to confirm if there is any lattice gold available in quartz from the representative gold deposits through the use of EPR.
According to Figs. 5 and 6 and Tables 13 and 14, the following preliminary conclusions can be reached:
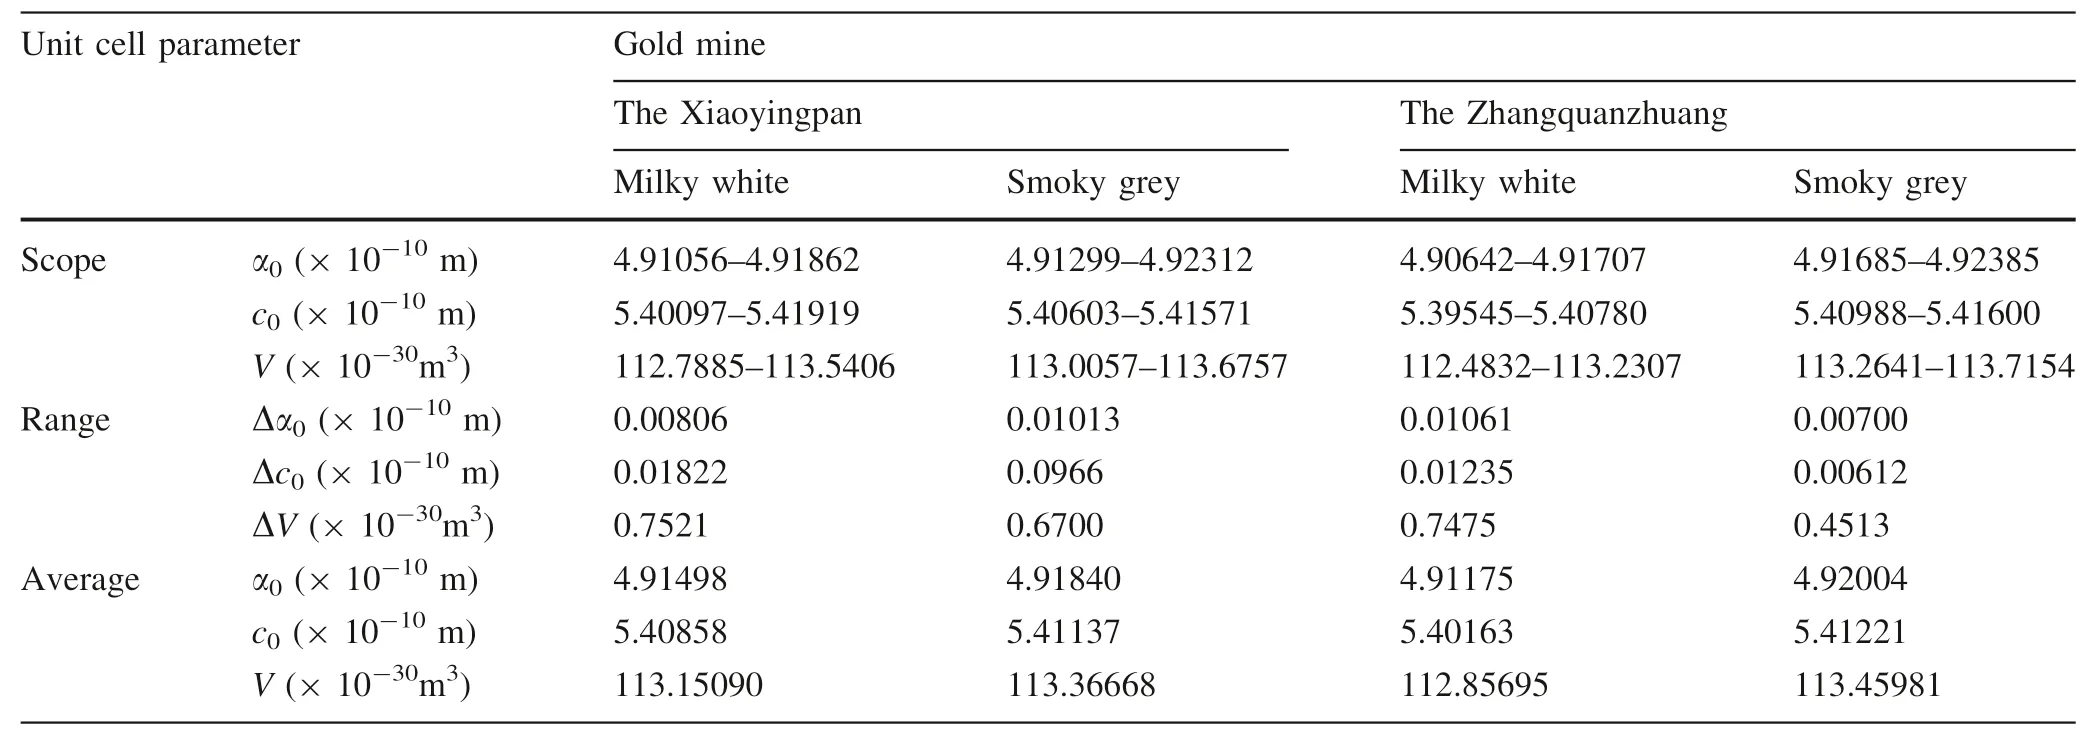
Table 12 Relationship between unit cell parameters and color of quartz from the representative gold deposits

Table 13 Calculated EPR parameters of quartz from the representative gold deposits (T = 300 K)
The paramagnetic centers including electron–hole centers and paramagnetic ions vary with temperature changes.Specifically, with decreasing temperature, signals of the EPR absorption peaks increase; in other words, with decreasing temperature, the density of the paramagnetic centers increases.
Differences between the EPR absorption peaks of the same quartz samples at different temperatures are only reflected in absorption intensity, and that of the EPR shape is not obvious. The single EPR absorption peak at T = 72 K of part of the samples, for example, GYP-01,ZW830-02, and ZW870-8–05 split into two weaker peaks at temperature T = 300 K. Due to the decreasing scanning scope, the single peak was pulled open and signals from the original, relatively weak absorption peaks were amplified.
Regardless of temperature, gold content in the quartz has a statistically positive correlation with the intensity of the EPR absorption peaks.
EPR absorption peak #I comes out at both temperatures,of which the calculatedgfactor is very close toge(= 2.0023 ± 0.001) of the free electrons. In addition, the #I peak has a close relationship with the gold in quartz. EPR absorption peak #II comes out of part of the samples, of which the calculated g factors, varying between 2.0063–2.0230 and focusing around 2.006, are larger thange.
The affiliation attribute and mechanism of the EPR bands/lines are discussed as follows:
8.1 Absorption peaks #II
According to Tables 13 and 14,gfactor of the #II peak is greater thange= 2.0023.gfactor determines the position of the EPR bands/lines and only has something to do with physical property. Free electron refers to those electrons with only spin angular momentum but without orbital angular momentum. General transition metal ions have both spin and orbital angular momenta. As a result, theirgfactors are far from thege= 2.0023. According to Chen(1987), when thedshell electron of the transition metal ions is below half full,g<ge; conversely, when thedshell electron of transition metal ions is above half full,g>ge;additionally, when thedshell electron of transition metal ions is just half full,g≈ge. As a result of this, theg>geabsorption peak #II in Figs. 5 and 6 results from those transition metal ions with d shell electron above half full.
The best material abundance range for EPR to test is(10–1,000) × 10–6. Ions that could produce spectra at both temperatures include Fe3+13. As discussed above, it is common for quartz in the area to contain Fe3+) (Tables 2,3, and 4). Thedshell electron of Fe3+is 3d5, which is above half full, and itsgis equal to 2.0060, which is larger thange. As a result, the absorption peak #II was produced by the resonance absorption of the paramagnetic foreign ion Fe3+.

Table 14 Calculated EPR parameters of quartz from the representative gold deposits (T = 72 K)
8.2 Absorption peak #I
Thegfactor of absorption peak #I is almost equal toge(Tables 13 and 14). Therefore, it is clear that the peak results from the resonance absorption of the existing electron–hole center in the quartz structure. As mentioned above, the center could only be produced by the O-–Al center and/or ionic gold in quartz.
As discussed above, the O--Al center is a type of abnormal hole center with the full characteristics of the Ocenter. Its EPR signal is similar to the EPR absorption of free electrons and thus itsg≈ge. The more Al3+replacing Si4+and the more O--Al hole center forming in gold-rich quartz. As a result of this, the stronger the EPR signal, the larger the absorption intensity; or vice versa, the smaller the absorption intensity, with lesser Al3+replacing Si4+,the lower the density of the O--Al center in gold-poor quartz. In summary, absorption peak #I could be produced by the O--Al centers.
When the symmetry described by the crystal space group is destroyed, crystal structure imperfection occurs.For instance, a hole of anion and/or cation, isomorphous replacement, and the disordered distribution of ion can all result in lattice defects in the crystal. These defects then destroy the original electric neutrality locally and form a variety of ‘‘centers’’ in the crystal. For example, when a hole of an anion or cation is replaced by another cation with a greater positive charge, the crystal structure position would show a positive charge owing to the lack of negative charge, and become an electron trap. This position would then become an electron center when capturing one or more electron(s). If a hole of a cation and/or some cation is replaced by another cation with a less positive charge, this crystal structure position would show negative charge owing to a lack of positive charge, and become a positive electron trap; under certain conditions, for instance, under irradiation, an anion next to this position would lose surplus electrons and produce a hole center.
The study targets of EPR are these electron–hole centers available in the crystal structure. The EPR bands/lines produced by these electron–hole centers are extremely narrow and theirg≈ge, with only one fine line. It is clear that the absorption peak #I in Figs. 5 and 6 results from the electron–hole center in the quartz.
The 6s6porbit of Au + is empty and can possibly form ansp3hybrid orbital. As a result, gold in the form of Au+and/or Au3+can enter the quartz lattice and form four-fold coordination, and meanwhile take up tetrahedral interstice like the Si–O bond. Gold entering quartz in the form of Au3+would result in crystal distortion and make the coordination polyhedron distort into a square and/or orthogon from tetrahedron because the radius of Au+is larger than that of Si4+. Gold entering quartz in the form of Au+would result in an electrovalent imbalance between itself and O2-, meanwhile producing an O--Au hole center in the quartz lattice. Like other electron–hole centers, the O--Au hole center, when applying an external magnetic field, will produce resonance absorption and emit absorption signals similar to that of free electrons. It is clear that the density of the O--Au center has a positive correlation with the ionic gold content scattered in quartz. This analysis is identical to the EPR test results. As a result, the absorption peak #I can also be produced by the ionic gold(Au+and/or Au3+) in quartz.
Based on the discussions above, it can be preliminarily concluded that:
• It is the O--Al and/or O-center that results in EPR absorption information. The density of this type of hole center increases and the EPR signal strengthens when the temperature decreases.
• The intensity of the EPR absorption peak has a positive correlation with gold content in quartz. A similar conclusion was reached respectively by Dang (1991),Hu (1993), Wang (1996), and Liu (1997) when they studied quartz from various gold deposits in many other Provinces of China with EPR.
• There does exist lattice gold in quartz from the gold deposits. Gold, in the form of Au+and/or Au3+,entering quartz and producing an electron–hole center(namely, the O--Au hole center), makes the center produce spin resonance absorption and results in the EPR absorption peak #I.
• The absorption peak #II of the quartz possibly results from the existence of Fe3+.
9 Infrared spectroscopic analysis
Infrared spectroscopic analysis (ISA) was conducted on powders of 10 quartz samples from the representative gold deposits. Results are respectively shown in Fig. 7 and Table 15.
If the infrared spectrum absorption peaks are numbered respectively as γ1,γ2… through γ10from high to low wavenumbers,D1throughD10will be the corresponding absorbance, andDi/D1the relative absorbance. It can be seen from both Fig. 7 and Table 15 that:

Table 15 ISA results of quartz from the representative gold deposits
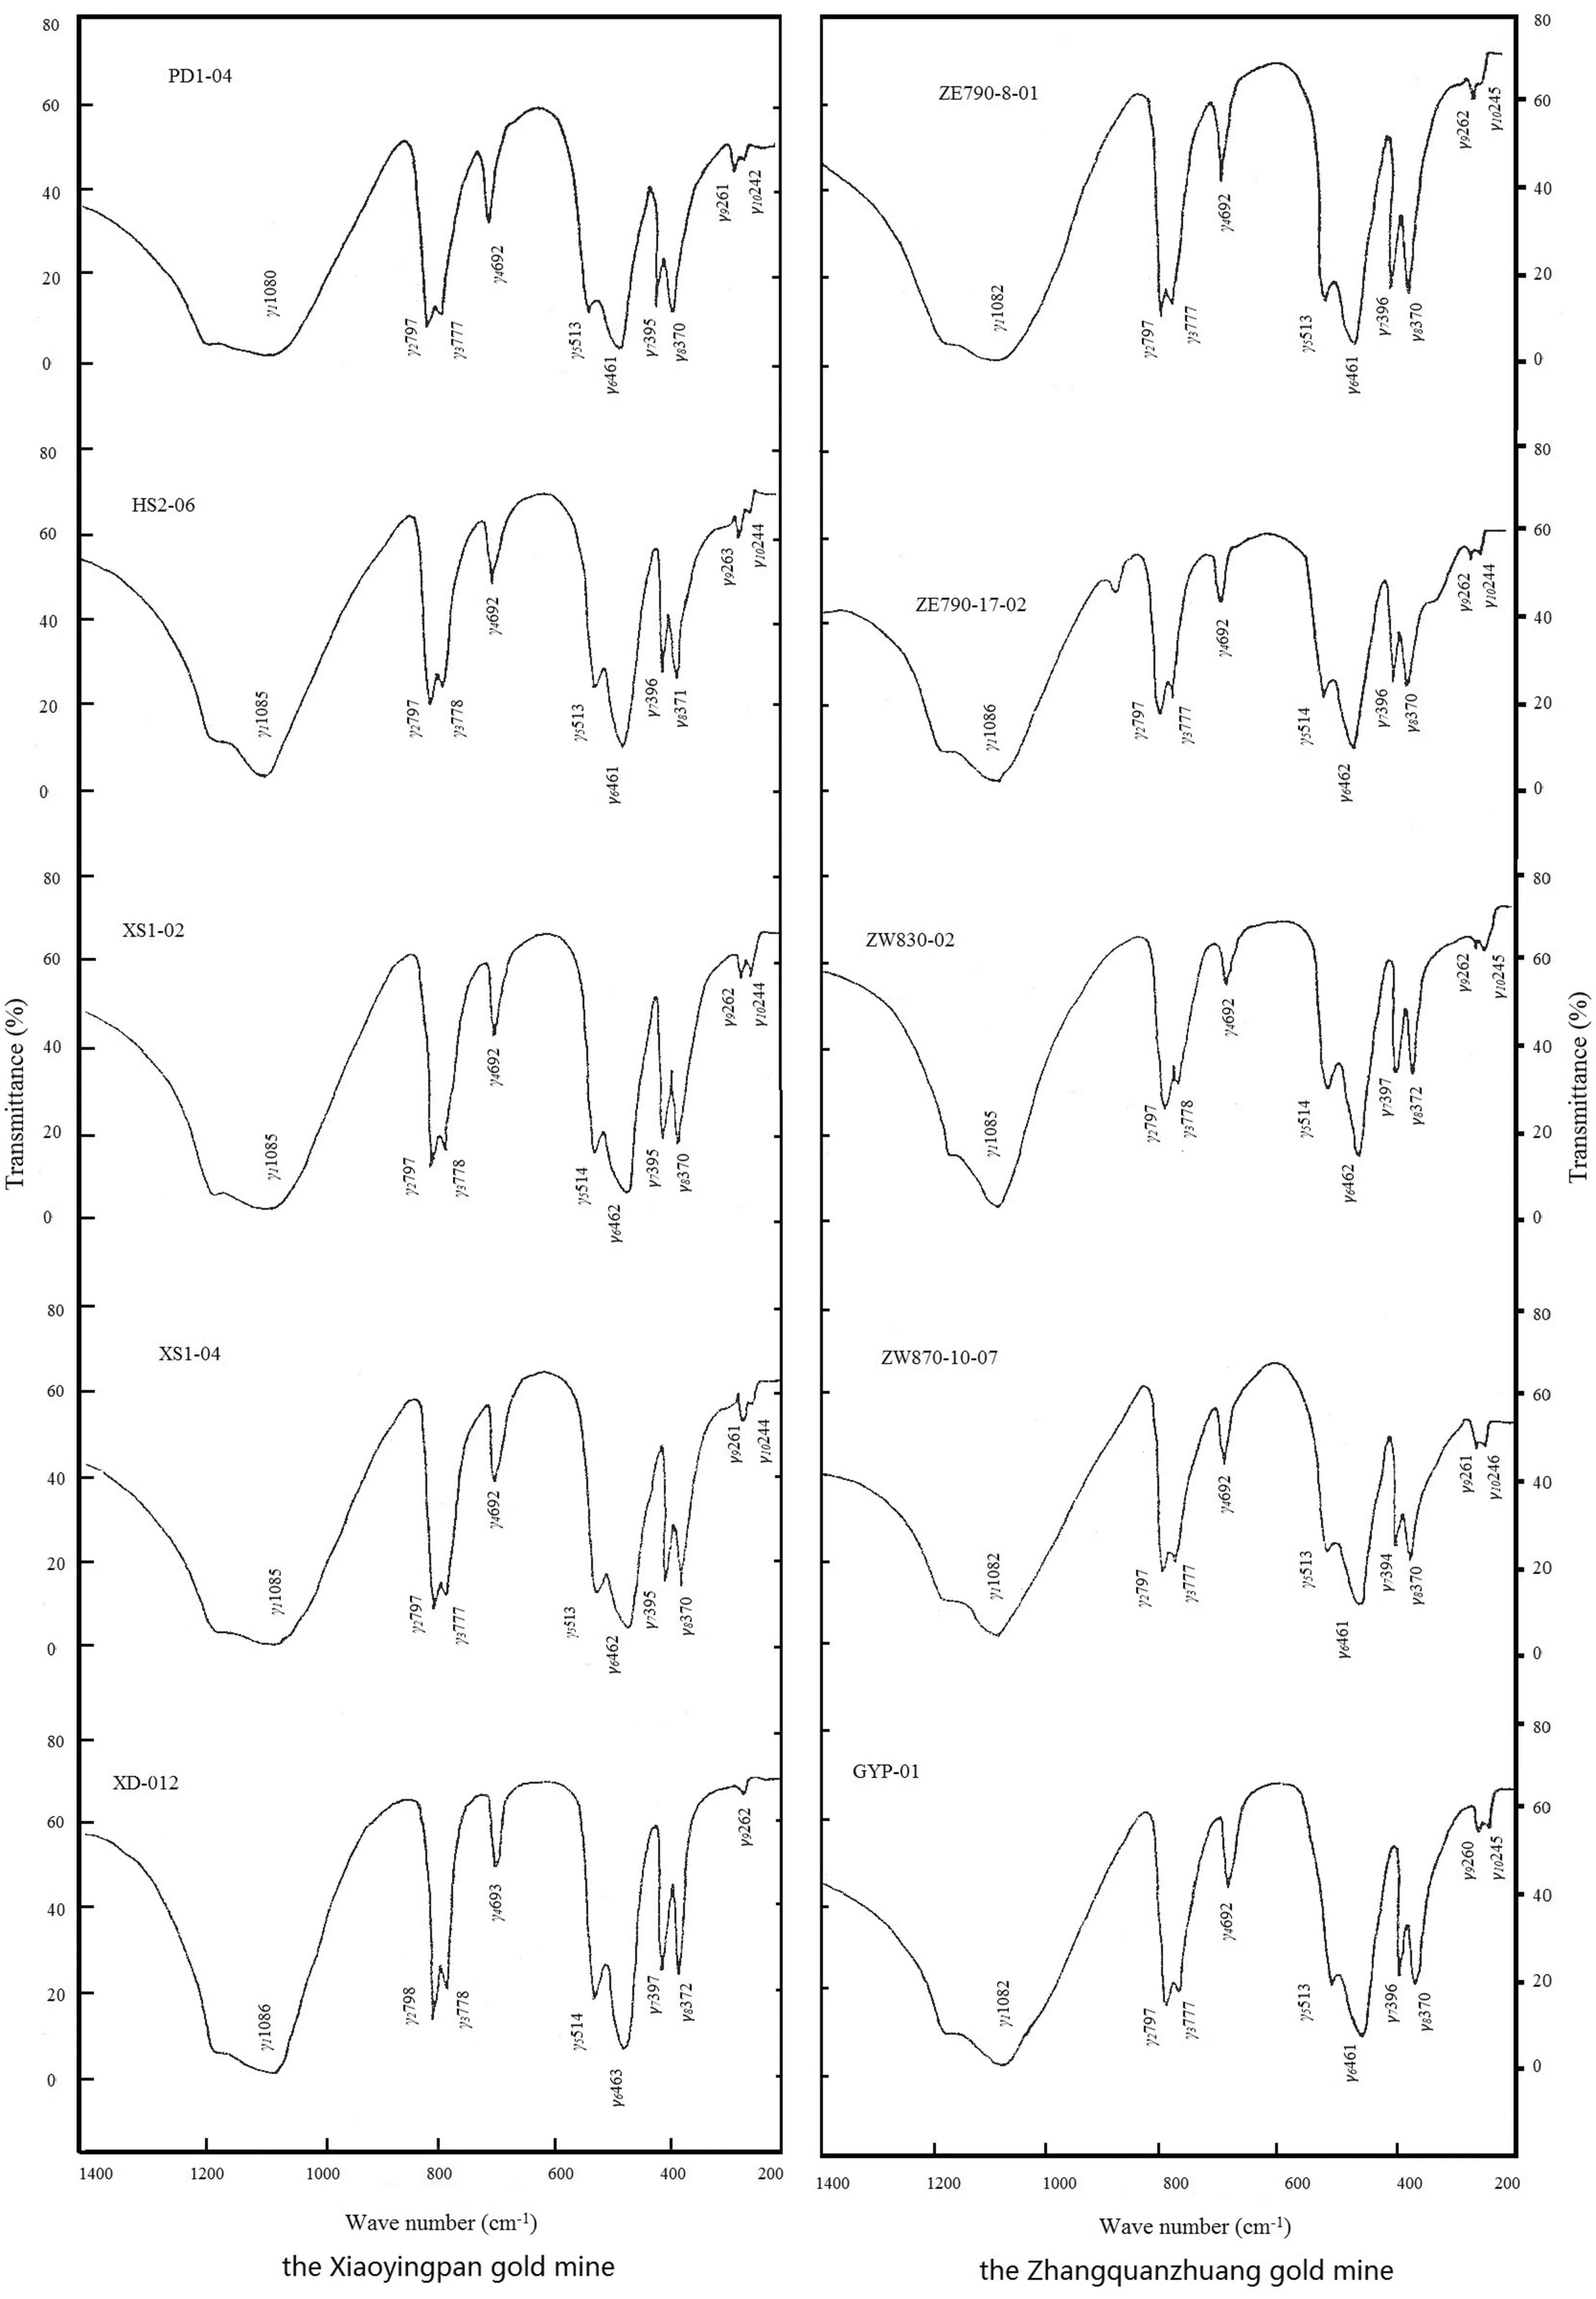
Fig. 7 Infrared absorption spectra of the quartz from the representative gold deposits
• Both auriferous quartz and gold-free quartz produce the following 10 absorption peaks: 1,080, 796, 777, 698,513, 462, 393, 345, 260, and 240 cm-1, of which 1,080,796, and 462 cm-1are the stronger ones.
• Comparing to that of quartz without gold, all absorption peaks of auriferous quartz shift a little bit. With increasing gold content in quartz, absorption peaks tend to shift to higher wavenumbers.
• On the infrared spectrum of quartz, the intensity of the characteristic absorption peaks of auriferous quartz is weaker than that of the corresponding bands/lines of the quartz without gold.
• Relative absorbance of the characteristic absorption peaks of auriferous quartz is smaller than that of the corresponding bands/lines of the quartz without gold.Meanwhile, the relative absorbance of the quartz has a negative correlation with its gold content. The purpose of the concept of relative absorbance is to eliminate the potential change of absolute absorbance resulting from slight differences in sample mass.
Previous researchers divided the infrared spectrum of quartz into three parts (Jin and Li 1985; Chen 1987; Shao 1990): the 1,080–1,086 cm-1absorption bands within 1,100–1,250 cm-1are the valence vibration band of quartz crystal; the 777 and 796 cm-1absorption bands within 830–750 cm-1are the Si–O-Si symmetrical expansion vibration band of SiO4tetrahedron in quartz; finally, the 461 and 513 cm-1absorption bands within 460–530 cm-1are the deformation vibration bands of SiO4tetrahedron in quartz. All the other weaker absorption bands possibly result from foreign trace elements in quartz, of which the 692 cm-1absorption band has a close relationship with the abundances of foreign structural Al, Na, and K compensation ions in the quartz.
Owing to the abundant structural Al and other foreign elements including K, Na, Au, Ag, Cu, et al. in the area,absorption peaks of the auriferous quartz are relatively weak and the corresponding absorbance is low. This is likely why the gold content of quartz has a negative correlation with its relative absorbance.
10 Discussion
In summary, the Authors investigated the typomorphic characteristics of auriferous quartz from different types of gold mineralization. This paper establishes the relationship between gold and trace elements, unit cell parameters, EPR absorption, infrared spectrum absorption of quartz, and fluid composition. These relationships can be used to distinguish barren rocks from gold mineralization, which is useful for ore-forming process tracing and mineral exploration.
Quartz color can be used as a key indicator when gold prospecting in the North China Platform. Generally, both milky white quartz of the early paragenetic stage and smoky gray quartz of the middle stage has close relationships with gold mineralization, of which, the smoky grey quartz carries more gold than its white counterpart.
Factors contributing to smoky grey quartz include the existence of various fine-grained metallic sulfides, CO2-H2O gas–liquid inclusions, foreign ions, and carbons in quartz lattice and/or structure. According to Barry and Mason (1959), smoky quartz is sometimes referred to as cairngorm, a material with origins from Cairngorm in Scotland; radiation from radioactive materials often develops a smoky appearance in colorless quartz, which may explain the formation of smoky quartz.
Since unit cell parameters of quartz have a negative correlation with their ore-forming temperatures but have a positive correlation with their gold contents, it is possible to use these parameters to determine the relative oreforming temperature and grade control.
Similar to unit cell parameters of quartz, EPR can be used in ore grade control during mining, since the intensity of the EPR spectrum absorption peak has a statistically positive correlation with gold content in quartz.
Geochemically, Zn, As, Al, (Cu + Pb + Zn), and C in quartz can likely be used as the indicator trace elements when prospecting for gold in the region. More specifically,Ni, Pb, and C can be used for the Xiaoyingpan style of gold mineralization, whereas Zn, Co, and Sr are more applicable for the Zhangquanzhuang style.
11 Conclusions
Minerageny and prospecting mineralogy attempt to identify the macroscopic metallogenic mechanisms of various mineral deposits by studying their microscopic typomorphic characteristics. Of the gold-bearing minerals in this paper’s study area, including pyrite, smoky grey, and milky white quartz, the smoky grey quartz carries higher gold content than its milky white counterpart. Through a detailed study of the mineralogical characteristics of quartz from representative gold deposits in the study area, this paper concludes that:
Al and K contents in quartz increase when the wall rocks are granitoid rocks and decrease when the wall rocks are plagioclase amphibolite. Both (Cu + Pb + Zn) and carbon in quartz from the gold deposits increase respective to their Au and (Au + Ag) contents.
As for ore-forming media, that of Xiaoyingpan is of moderate salinity, weak acid-alkaline Na+-Ca2+-Cl--SO42-type, mesogene, and mesothermal, while that of Zhangquanzhuang is weak-moderate alkaline, Na+-Ca2+-Cl--SO42-type, mesogene, and mesothermal. Lastly,Dongping’s ore-forming media is weak acid-alkaline(pH = 6.14 –8.62), Na+-Ca2+-Cl--SO42-type, mesogene,and mesothermal.
Xiaoyingpan’s gold immigration is mainly in the form of Cl complex, while Zhangquanzhuang’s in the form of sulfur complex. Donging’s lies between the former two deposits, in the form similar to that of Xiaoyingpan in the early paragenetic stage and in the form similar to that of Zhangquanzhuang in the later stage.
Unit cell parameters of quartz hinge on wall rock type,paragenetic stage, and its contents include gold among other foreign elements. The average unit cell parameters of milky white quartz are smaller than that of smoky quartz from the same deposit. Unit cell parameters of quartz have a negative correlation with their ore-forming temperatures but have a positive correlation with their gold contents.
The gold content in quartz has a statistically positive correlation with the intensity of the EPR absorption peaks.The EPR absorption information results from the O--Al and/or O-centers. With decreasing temperatures, the density of these hole centers increases, and the EPR signal strengthens. The intensity of the EPR absorption peak has a positive correlation with gold content in quartz. Lattice gold exists in quartz from the gold deposits. In the form of Au+and/or Au3+, gold entering quartz and producing electron–hole centers, namely, the O--Au hole center,makes the center produce spin resonance absorption and results in the EPR absorption peak #I. The absorption peak#II of quartz possibly results from the existence of Fe3+.
All absorption peaks of auriferous quartz tend to shift to higher wavenumbers with increasing gold content in quartz, compared to that of quartz without gold. On the infrared spectrum of quartz, the intensity of the characteristic absorption peaks of auriferous quartz is weaker than that of the corresponding bands/lines of the quartz without gold. Relative absorbance of the characteristic absorption peaks of auriferous quartz is smaller than that of the corresponding bands/lines of the quartz without gold. Finally,the relative absorbance of the quartz has a negative correlation with its gold content.
AcknowledgementsSupport for this study was received from both the China National PhD Foundation and Bureau Veritas Commodities Canada Ltd. Additional support was provided respectively by Prof.Yusheng Zhai of the China University of Geosciences, also an Academician of the Chinese Academy of Sciences, Profs. Zhaolu Pan and Jianhong Zhang of the China University of Geosciences in Beijing,and by Prof. Yuan Zhang of the College of Earth Sciences, Jilin University in Changchun of China, all of whom provided insightful discussions and critical reviews of this manuscript. The authors very much appreciate the time invested respectively by Dr. Tao Sun,Associate Professor of College of Resources and Environmental Engineering, Jiangxi University of Science and Technology, who helped with several figures in the paper, by Sean Daly, P.Geo of APEGBC, Canada, and by David Yin, BSc of USA, for their review and editorial work on this contribution.
Declarations
Conflict of interestOn behalf of all authors, the corresponding author states that there is no conflict of interest.
杂志排行
Acta Geochimica的其它文章
- Interception, degradation and contributions of terrestrial organic carbon obtained from lignin analysis in Wujiang River, southwest China
- Mineralogy and geochemistry of fine-grained Dahab stream sediments,Southeastern Sinai,Egypt:emphasis on the intergrowths of Fe–Ti oxides
- Response of silicate chemical composition variation on thermal metamorphism of ordinary chondrites and classification of petrologic types: the case of L chondrites from Grove Mountains, Antarctica
- Hydrogeochemical characteristics and its role in controlling arsenic mobilization in a shallow aquifer
- Constraints on unconsolidated pyroclastic flow sediments related REE enrichments originated from potassic-alkaline Go¨lcu¨k stratovolcano: Darıdere-Direkli-Yakao¨ren (DDY) table 4deposits,southwestern Anatolia of Turkey
- Fluoride ions in groundwater of the Turkana County, Kenya, East Africa