Mineralogy and geochemistry of fine-grained Dahab stream sediments,Southeastern Sinai,Egypt:emphasis on the intergrowths of Fe–Ti oxides
2021-11-04AdelSurourAhmedElKammarEbtisamArafaHalaKorany
Adel A.Surour •Ahmed.M.A.El-Kammar•Ebtisam H.Arafa•Hala M.Korany
Abstract Mineralogical and geochemical characteristics of stream sediments collected from 30 stations in the Dahab-Wadi Kid area(southeastern Sinai,Egypt)are presented.The studied sediments contain considerable amounts of heavy minerals,including abundant Fe–Ti oxides,with up to 25.94% index figure that measures the relative abundance of heavy minerals to light minerals.Immaturity of the sediments and nature of Fe–Ti oxide intergrowths,in addition to some non-opaque heavy minerals,indicate multiple provenances with contributions from a variety of Neoproterozoic mafic to felsic intrusions.Appreciable amounts of heavy minerals are derived from schists that belong to the so-called Wadi Kid volcanosedimentary group.Owing to the considerable contribution of the felsic intrusions represented by within-plate granites,the sediments are enriched in REE-bearing minerals(e.g.,monazite,cerianite,La-cerianite and allanite),V-bearing thorite,zircon,and a ZrO2 phase.The majority of Fe–Ti oxides are derived from the mafic intrusions,and they show evidence of pre-,syn-and post-depositional phases of alteration and formation of intergrowths.As to the geochemical signature of the bulk silt fraction,there is remarkable enrichment of LREEs with distinct negative Eu anomaly,and this supports dominance of a provenance dominated by felsic intrusions(i.e.,the A-type within-plate granite and associated pegmatites).Also,the felsic provenance is responsible for slight abnormality ofΣU+Th content(up to~37 ppm)and few anomalous samples bear uraniferous zircon and Ce-type monazite.The present paper sheds light on the fertility of the Dahab stream sediments in some economic minerals for possible future exploitation,not for gold only,but for potential REEbearing minerals that are needed for a wide spectrum of modern technological industries.
Keywords Dahab stream sediments∙Silt fraction∙Fe–Ti oxides∙Textural variations∙Rees enrichment
1 Introduction
Because of easy and profitable exploitation,the exploration of economic stream sediments attracted the attention of some authors in Egypt and the neighboring countries.The importance of stream sediments on the regional scale became noticeable during the last three decades because several mineral resources were consumed and alternative sources of versatile minerals are demanded by the industry.In the Middle East,most regions belong to the arid region in which sedimentation and concentration of heavy minerals are peculiar and give information about the evolution of sediments.On this regional scale,stream sediments can tell about the influence of lithological variations on the stream sediments,their quality,and economic potentiality.In Egypt,stream sediments in Egypt are studied for sedimentological,economic,and environmental aspects either in the Eastern Desert(El-Dougdoug 1991;Harraz et al.2012;Darwish 2017;Elhebiry et al.2018;Ebyan et al.2020; El-Kammar et al. 2020 or in Sinai, e.g. Ayalon et al.1981, Surour et al. 2003; Al-Sharkawy et al. 2012; Hassan et al. 2015; Said et al. 2018). For example, placer gold represents one of the three-fold classifications of gold in Egypt, namely stratabound deposits, non-stratabound deposits, and placer gold deposits (Botros 2004, 2015).Heavy minerals of economic importance in Egypt are categorized into beach and stream placers. The Egyptian black sand deposits represent the majority of beach placers especially on the Mediterranean coast in which rutile, zircon, monazite, lecucoxene, and some gold are found (e.g.Dabbour 1995; Moustafa et al. 2000; Kaiser et al. 2014;Abdel-Karim et al. 2016; Abdel-Karim and Barakat 2017).In northern Sinai, the beach sediments including crests of beach dunes, contain considerable amounts of Fe–Ti oxides in addition to some outcrops with occasional enrichment of heavy minerals with environmental hazards, e.g. zircon,thorite, and monazite (Misak and Attia 1983; Morsy et al.1989; Dabbous et al. 1992; El-Banna 1999).
The present work aims to show the importance of heavy minerals, including the Fe–Ti oxides, in the evolution of stream sediments in an arid region. Issues concerning the provenance and nature of bedrock sources are presented to understand the connection between lithologies in the hinterlands and the resultant stream sediments. In this respect,the authors use Fe–Ti oxides and their intergrowths in the silt fraction extracted from the Dahab stream sediments to characterize and trace provenance(s). Also, the authors utilize the mineralogical and geochemical data statistically to show the variations in mineral composition, distribution,textures, and bulk chemistry of two size fractions. The data materialized in the present work present an account of the economic potentiality of non-metallic and metallic minerals in the Dahab stream sediments as a continuation of an earlier contribution by the present authors (Surour et al.2003).
2 Geology of the Dahab-Wadi Kid area
The southern part of the Sinai Peninsula is dominated by mountainous Neoproterozoic basement rocks whereas the northern part is more or less flat with some plateau and occupied by a Phanerozoic sedimentary cover. The area of study is located in the environ of the Dahab tourist resort city and the area is dominated by rugged mountains of basement rocks (migmatized gneisses- arc volcano-sedimentary successions- arc gabbros- within-plate granitic rocks), in addition to frequent mafic to felsic dykes that are related to the Oligo-Miocene rift of the Red Sea. Lithified sediments are represented by unmappable Phanerozoic sandstone whereas the Quaternary to Recent alluvium occupies the course of dry valleys (wadis in Arabic) in the form of stream sediments. The Dahab area lies on the western side of the Gulf of Aqaba between longitudes 34°18′42′′E–34°31′33′′E and latitudes 28°23′36′′E–28°34′48′′N (Fig. 1). Omran et al. (2012) used the advanced space-borne Thermal Emission and Reflection Radiometer (ASTER) for lithologic mapping of the Dahab area, particularly the so-called Dahab basin (including the alluvial wadi deposits or stream sediments), and this represents the northern extremity of the present study’s area.Quaternary alluvium deposits represent one of three main aquifers in the Dahab watershed (Eissa 2018). In the entire Sinai Peninsula, pre-Quaternary sedimentary formations are represented by (a) lacustrine and fluvial deposits in addition to possible glaciations beds (e.g. El-Sherbini 1992; Issawi and Zaghloul 1996), (b) alluvial fans including the very prominent fans of Dahab area, nearby Khashm El-Fakh, Wadi Watir and small fan of Wadi El-Merakha(e.g. El-Refeai 1992; Issawi et al. 1998), and (c) limited sand dunes and sand sheets that cover the foot-slope of the Egma plateaux and El-Hazim cliffs (e.g. Issawi et al.1998).
Several studies have been carried out in the area of Dahab-Wadi Kid (Fig. 1), which is the area of the present study, and most of them concerned with the Precambrian basement complex or the Neoproterzoic rocks. The Geological Survey of Egypt compiled a detailed geologic map of the South-eastern Sinai Peninsula (EGSMA 1994) based on previous works during the period 1906–1992. The explanatory note of this map, as well as the work of Issawi et al. (1998), show that the area is dominated by a variety Neoproterozoic rocks comprising metamorphic rocks(gneisses, schist, and amphibolites), a thick succession of volcano-sedimentary island arc succession particularly at the environ of Wadi Kid, arc-related fresh gabbros and finally a series of independent calc-alkaline and alkaline granitic rocks. NE-SW mafic, intermediate and felsic dykes are traversing the basement complex and most works agree they are related to the rift of the Gulf of Aqaba, as a part of the Oligo-Miocene Red Sea major rift. Omran et al. (2012)were able to discriminate all rock units and varieties using different remote sensing techniques. El-Bialy (2010, 2013),are distinguished from the oldest to youngest as follows:gneisses, metasediments, metavolcanics (basalt and andesite), metagabbro-diorite complex, older granitoids (tonalite and quartz diorite), Dokhan volcanics (rhyolite and dacite), and younger granites (monzo- and syenogranite).Particularly at the Wadi Melhag, the Dokhan volcanic are common whereas a peculiar pluton at Wadi-Um Zeriq junction represents the younger granites. In his review on the geology of South-eastern Sinai, El-Bialy (2020) stated that the Wadi Kid area might represent a Neoproterozoic core complex that displays at least three stages of deformation. As to the Phanerozoic cover, it comprises mostly limited exposures of Cambrian and younger clastics(sandstone and shale) as reported by Issaw et al. (1998);Elbasiouny and Elbehiry (2019).

Fig. 1 a Location of the study area on the map of Egypt, b geological map of the Dahab area (from Surour et al., 2003), and c locations of 30 stations surveyed for their stream sediments
3 Methodology
Sampling was carried out in pits and channels on 30 outcrops representing the surveyed stations (Fig. 2b). The samples were essentially taken from the deposits at the depth of 30 to 50 cm from the wadi floor. Each sample was split into two parts, about 2.5 kg for each one. The first part was processed by gravimetric methods to concentrate heavy minerals including gold whereas the second part was kept as a reserve for further separation and chemical analysis. Before splitting the samples, large pebbles (>5 cm, average dimension) and cobbles were removed by hand in the field. Meanwhile, small pebbles (>2 cm) were rejected by manual sieving.
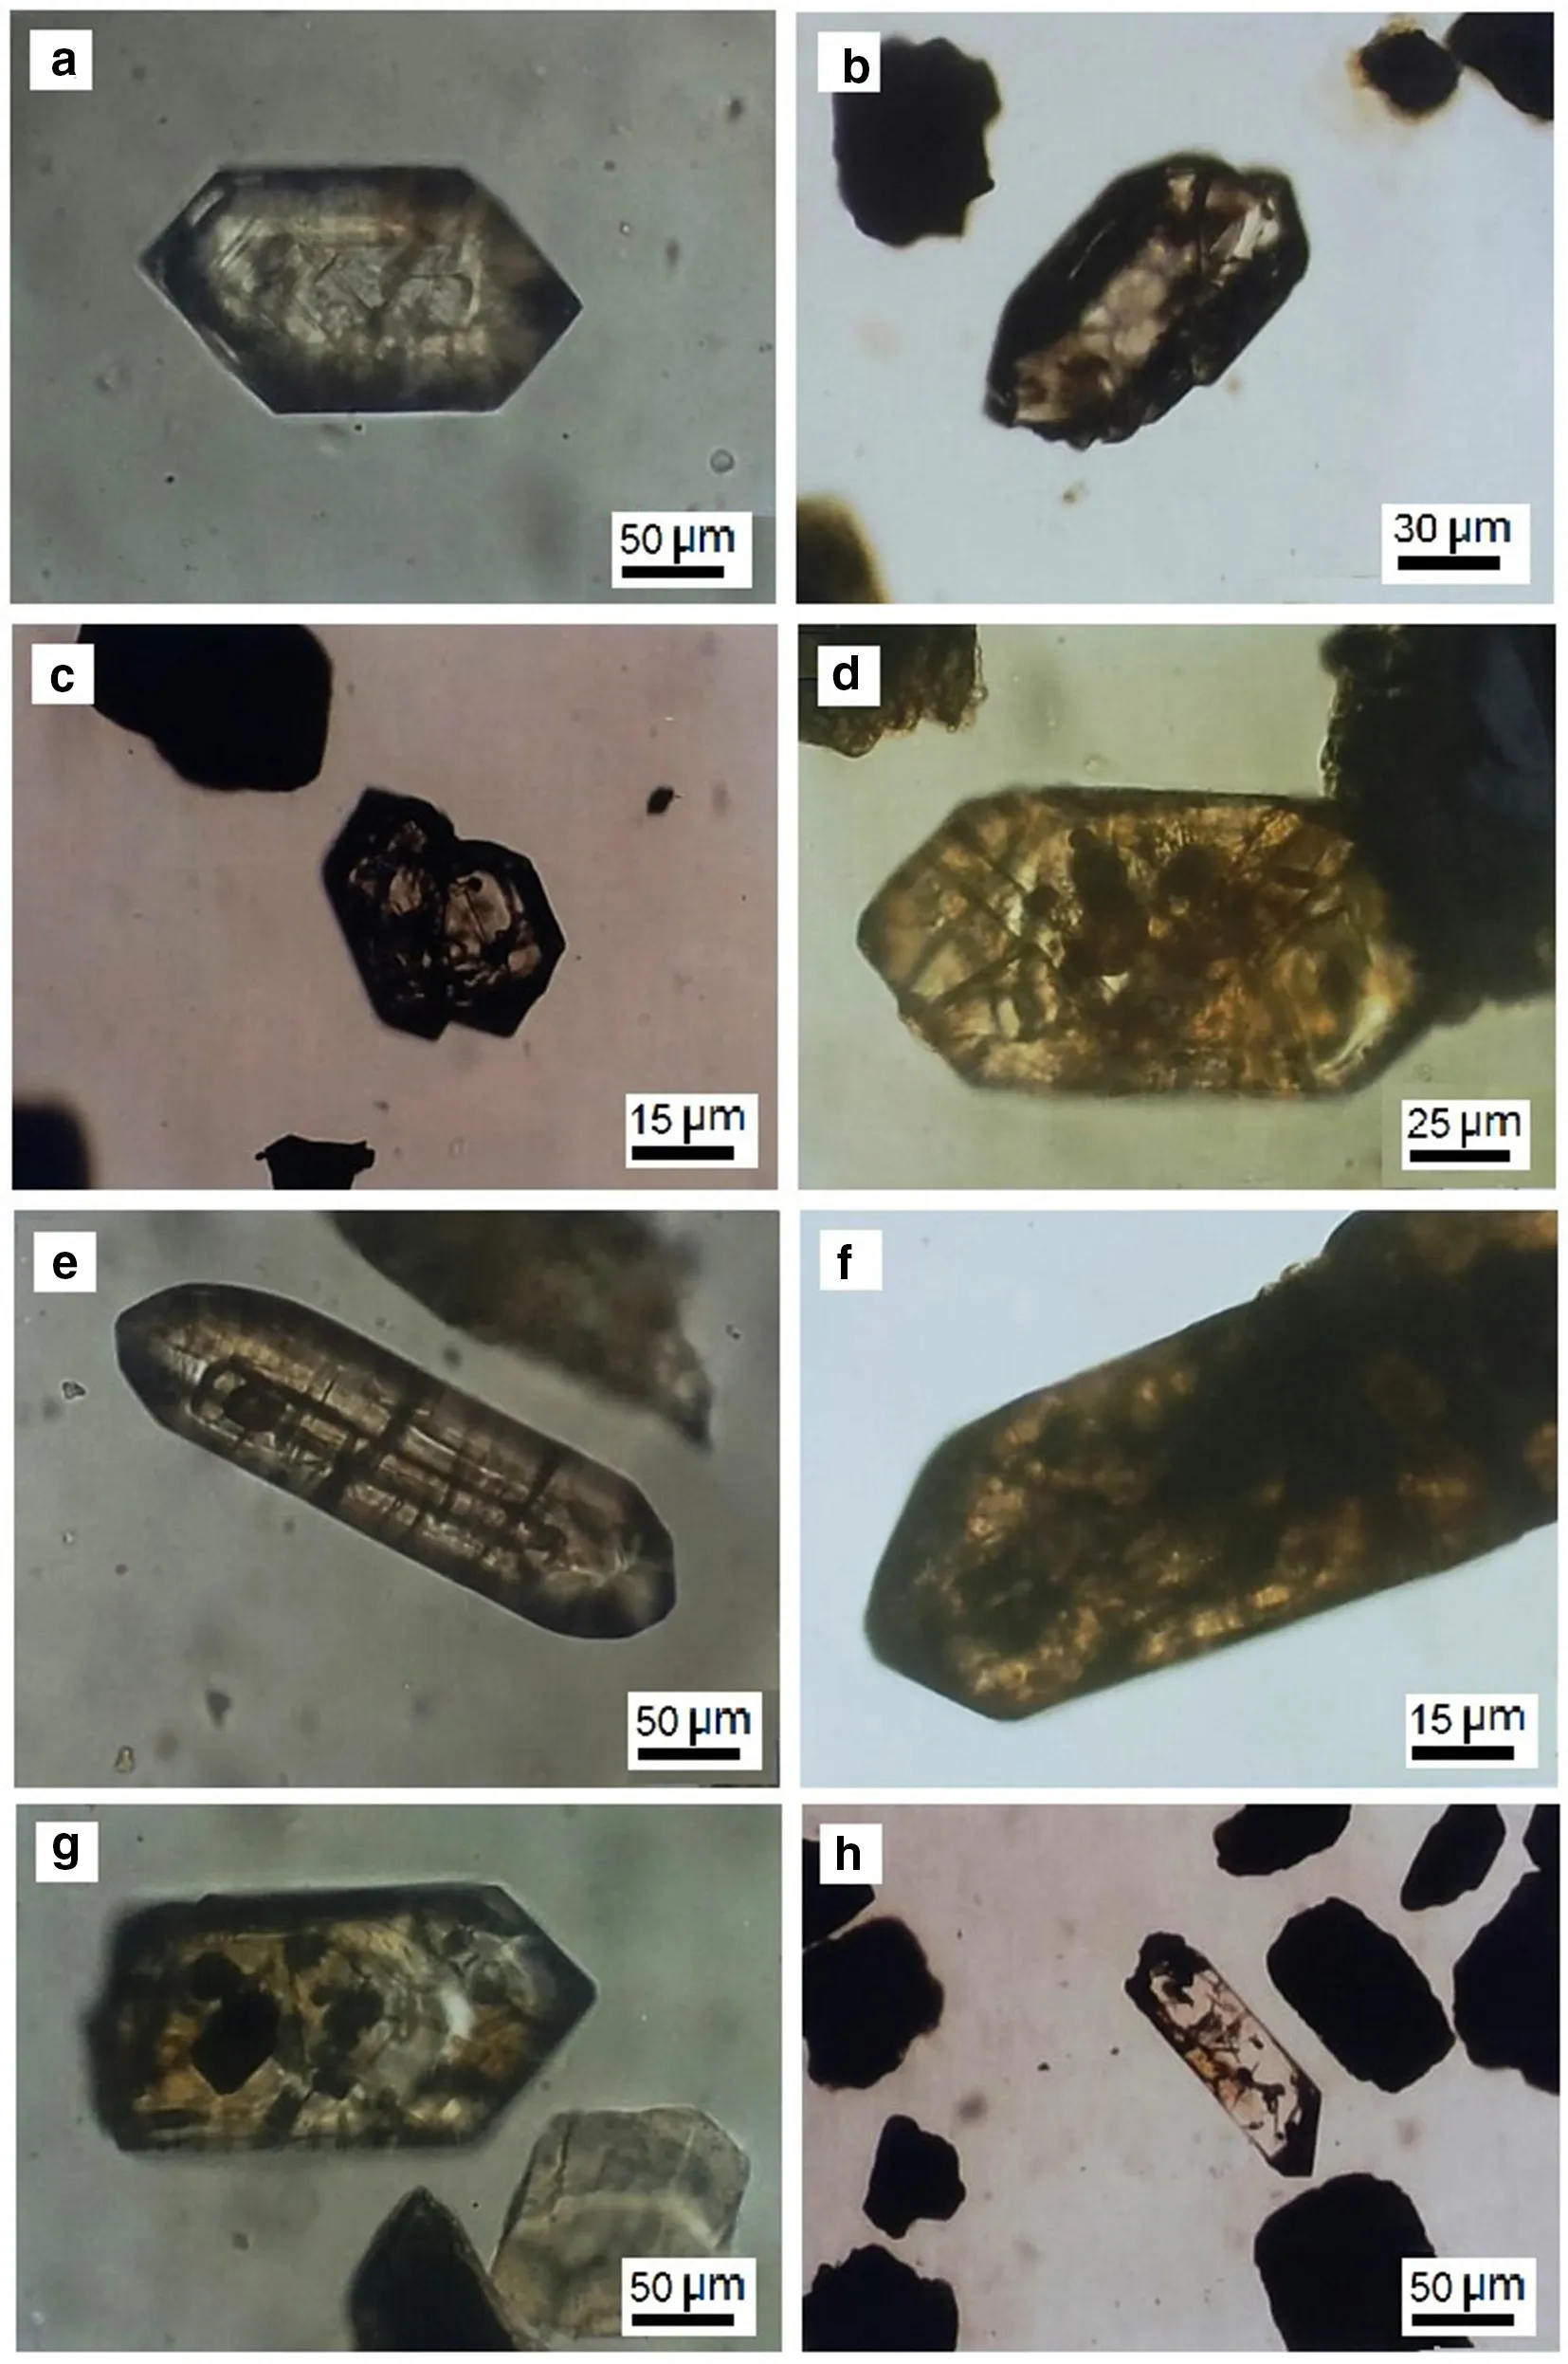
Fig. 2 Microphotographs of zircon, all are taken in P.P.L. a Short euhedral zircon, clear and showing zoning, b Dentate peripheries of short and dark zircon, c Short twinned zircon, d Slightly zoned zircon exhibiting different shades of yellow and occurrence of fine dark inclusions, e nearly euhedral zircon with another zircon as inclusion, f Turbid golden coloured zircon, g Terminated zircon showing zoning and inclusions of apatite and opaque, and h Dark staining of zircon especially at the two terminations
The analytical work was carried out at the Central laboratories of the Egyptian Authority for Mineral Resources and the Department of Geology at the Cairo University.Major oxides were measured by wet analysis. Both sodium and potassium oxides were determined by flame photometry whereas the rest of the oxides were determined volumetrically. Each sample of the studied stream sediments, as well as the standards, was digested with HCl and HClO4(1:1) in Teflon bombs until incipient dryness. After digestion, the final residue was then dissolved in 2 N HCl and diluted gravimetrically with distilled water to 100 ml.Analysis of trace elements was done by ICP-MS technique on a Philips spectrometer Model PW 8210 that works at 50 MHz. A series of standard samples (sandstones and granites) were used for the quantitative determination of trace elements. Digestion of samples for the measurements of rare-earth elements was done using hydrofluouric acid. The detection limit for the analysed elements amounts less than 1 μg/g for trace elements and less than 10 μg/g for rareearth elements, depending on the amount of material available. Accuracy is 1%–3% relative for quantitative analysis within a factor 2 for survey analysis. Laser wavelength lies in the range of 193–266 nm, and a wide range of lateral resolution (10–350 μm). A series of REE multi-element standard solutions containing 0.4 ppb to 21 ppb of each REE were used for calibration. Statistical treatment of data includes the calculation of rotating factor,correlation matrix, and descriptive statistics was done by the SPSS and Microsoft Excel programs. As to the analytical precision/accuracy, coefficient of variation (c.v.) for the major oxides is: 0.03–0.07 (SiO2, Al2O3, Fe2O3, CaO and P2O5), 0.32–0.35 (TiO2and K2O), 0.16 (MgO), 0.62(Na2O) and 1.011 (MnO). The precision for trace elements is<3% relative standard deviation (δ) of five repeated data acquisitions. The REE parameters such as Ce-anomaly(ΔCe), Eu-anomaly (ΔEu), and LREEs: HREEs are calculated according to the following equations: ΔCe = Ce/(La + Nd)/5 and ΔEu = Eu/(Sm + Gd)/5. The relative partitioning of LREEs relative to HREEs is estimated as LREE/ HREE, where LREEs = (La + Ce + Nd + Sm +Eu)/5 and HREEs = (Gd + Tb +Dy + Yb + Lu)/5. Five LREEs (La, Ce, Nd, Sm, and Eu) and five HREEs (Gd, Tb,Er, Yb and Lu) are considered in the fractions extracted from the Dahab stream sediments. SEM-EDX microanalyses and microphotographs of some specific minerals were conducted on a Philips XL30 scanning electron microscope with energy dispersive X-ray attachment working at 30 kV acceleration voltage.
Owing to the diversity of Neoproterozoic source rocks,particularly their granularity, mineralogical and geochemical compositions, there is a need to classify the grain size of the collected samples of stream sediments. Therefore,two fractions of heavy minerals in the grain size ranges of 126–250 μm (coarse fraction or size ‘‘A’’) and 62–125 μm(fine fraction or size ‘‘B’’) were mechanically separated from each investigated sample. Separation by bromoform and Clerici’s solution (specific gravities of 2.87 and 3.7 g/cm3, respectively) enables the calculation of the percentage of heavy minerals (opaque and non-opaque) in the bulk fraction of every grain size. This is expressed as an‘‘index figure’’ that is an indicator of heavy minerals enrichment. For detailed mineralogical investigation, the obtained heavy fractions were subjected to magnetic separation using a Frantz isodynamic separator.
4 Grain size analysis and its statistical results
Grain size analysis is done for 90 samples (3 samples for each surveyed station). About 600 gm of each sample is quartered and subjected to screening on a phi set of standard sieves attached to a rotating shaker for about 20 minutes. Statistical grain size parameters for the 90 samples are determined according to the formulae given by Folk and Ward (1957). They are the mean grain size (MZ),inclusive graphic standard deviation (σi), inclusive graphic skewness (SKi), and inclusive graphic kurtosis KGas shown in Table 1. The table shows a wide range of grain sizes. The lowest value is –2.17 at station No. 30, whereas the highest value 2.1 is recorded at station No. 5 with an average mean size of 0.03. Mean grain size is distinctly variable, being represented by fine pebbles, granules, and different categories of sands (very coarse, coarse, medium,and fine). Very coarse sand is the most frequent fraction(43.3%) whereas the least frequent fraction is represented by equal values of fine pebbles and granules (3.3%). The inclusive graphic standard deviation values of the studied Dahab stream sediments range from poorly sorted (1.0) at station No. 29 to very poorly sorted (2.3) at station No. 1 averaging poorly sorted (1.65). Statistically, 83.3% of the total studied samples are poorly sorted while 16.67% of samples in 15 stations are very poorly sorted. It is shown that about 67% of the studied samples range from nearly symmetrical to fine skewed whereas about 20% of them are strongly fine skewed and about 13% are coarse skewed.Hence, it is evident that the majority of the investigated samples are nearly symmetrical to very fine skewed which is attributed to the addition of finer grains or silting. About 50% of samples are represented by the mesokurtic class and the lowest value is represented by the very leptokurtic class (3.33%). The average grain size distribution of the Dahab stream sediments is graphically presented by histograms and cumulative curves (Supplementary File 1).Histograms of the 90 samples from the 30 stations display three types: unimodal, bimodal, and polymodal. The most frequent distribution is presented by the unimodal type where about 43% of the population is recorded in one bar(equivalent to one Wentworth grade according to Wentworth (1922). The polymodal distribution represents about 40% of the grain size population, in more than two bars.The bimodal distribution represents about 17% of the grain population, being displayed by two bars.
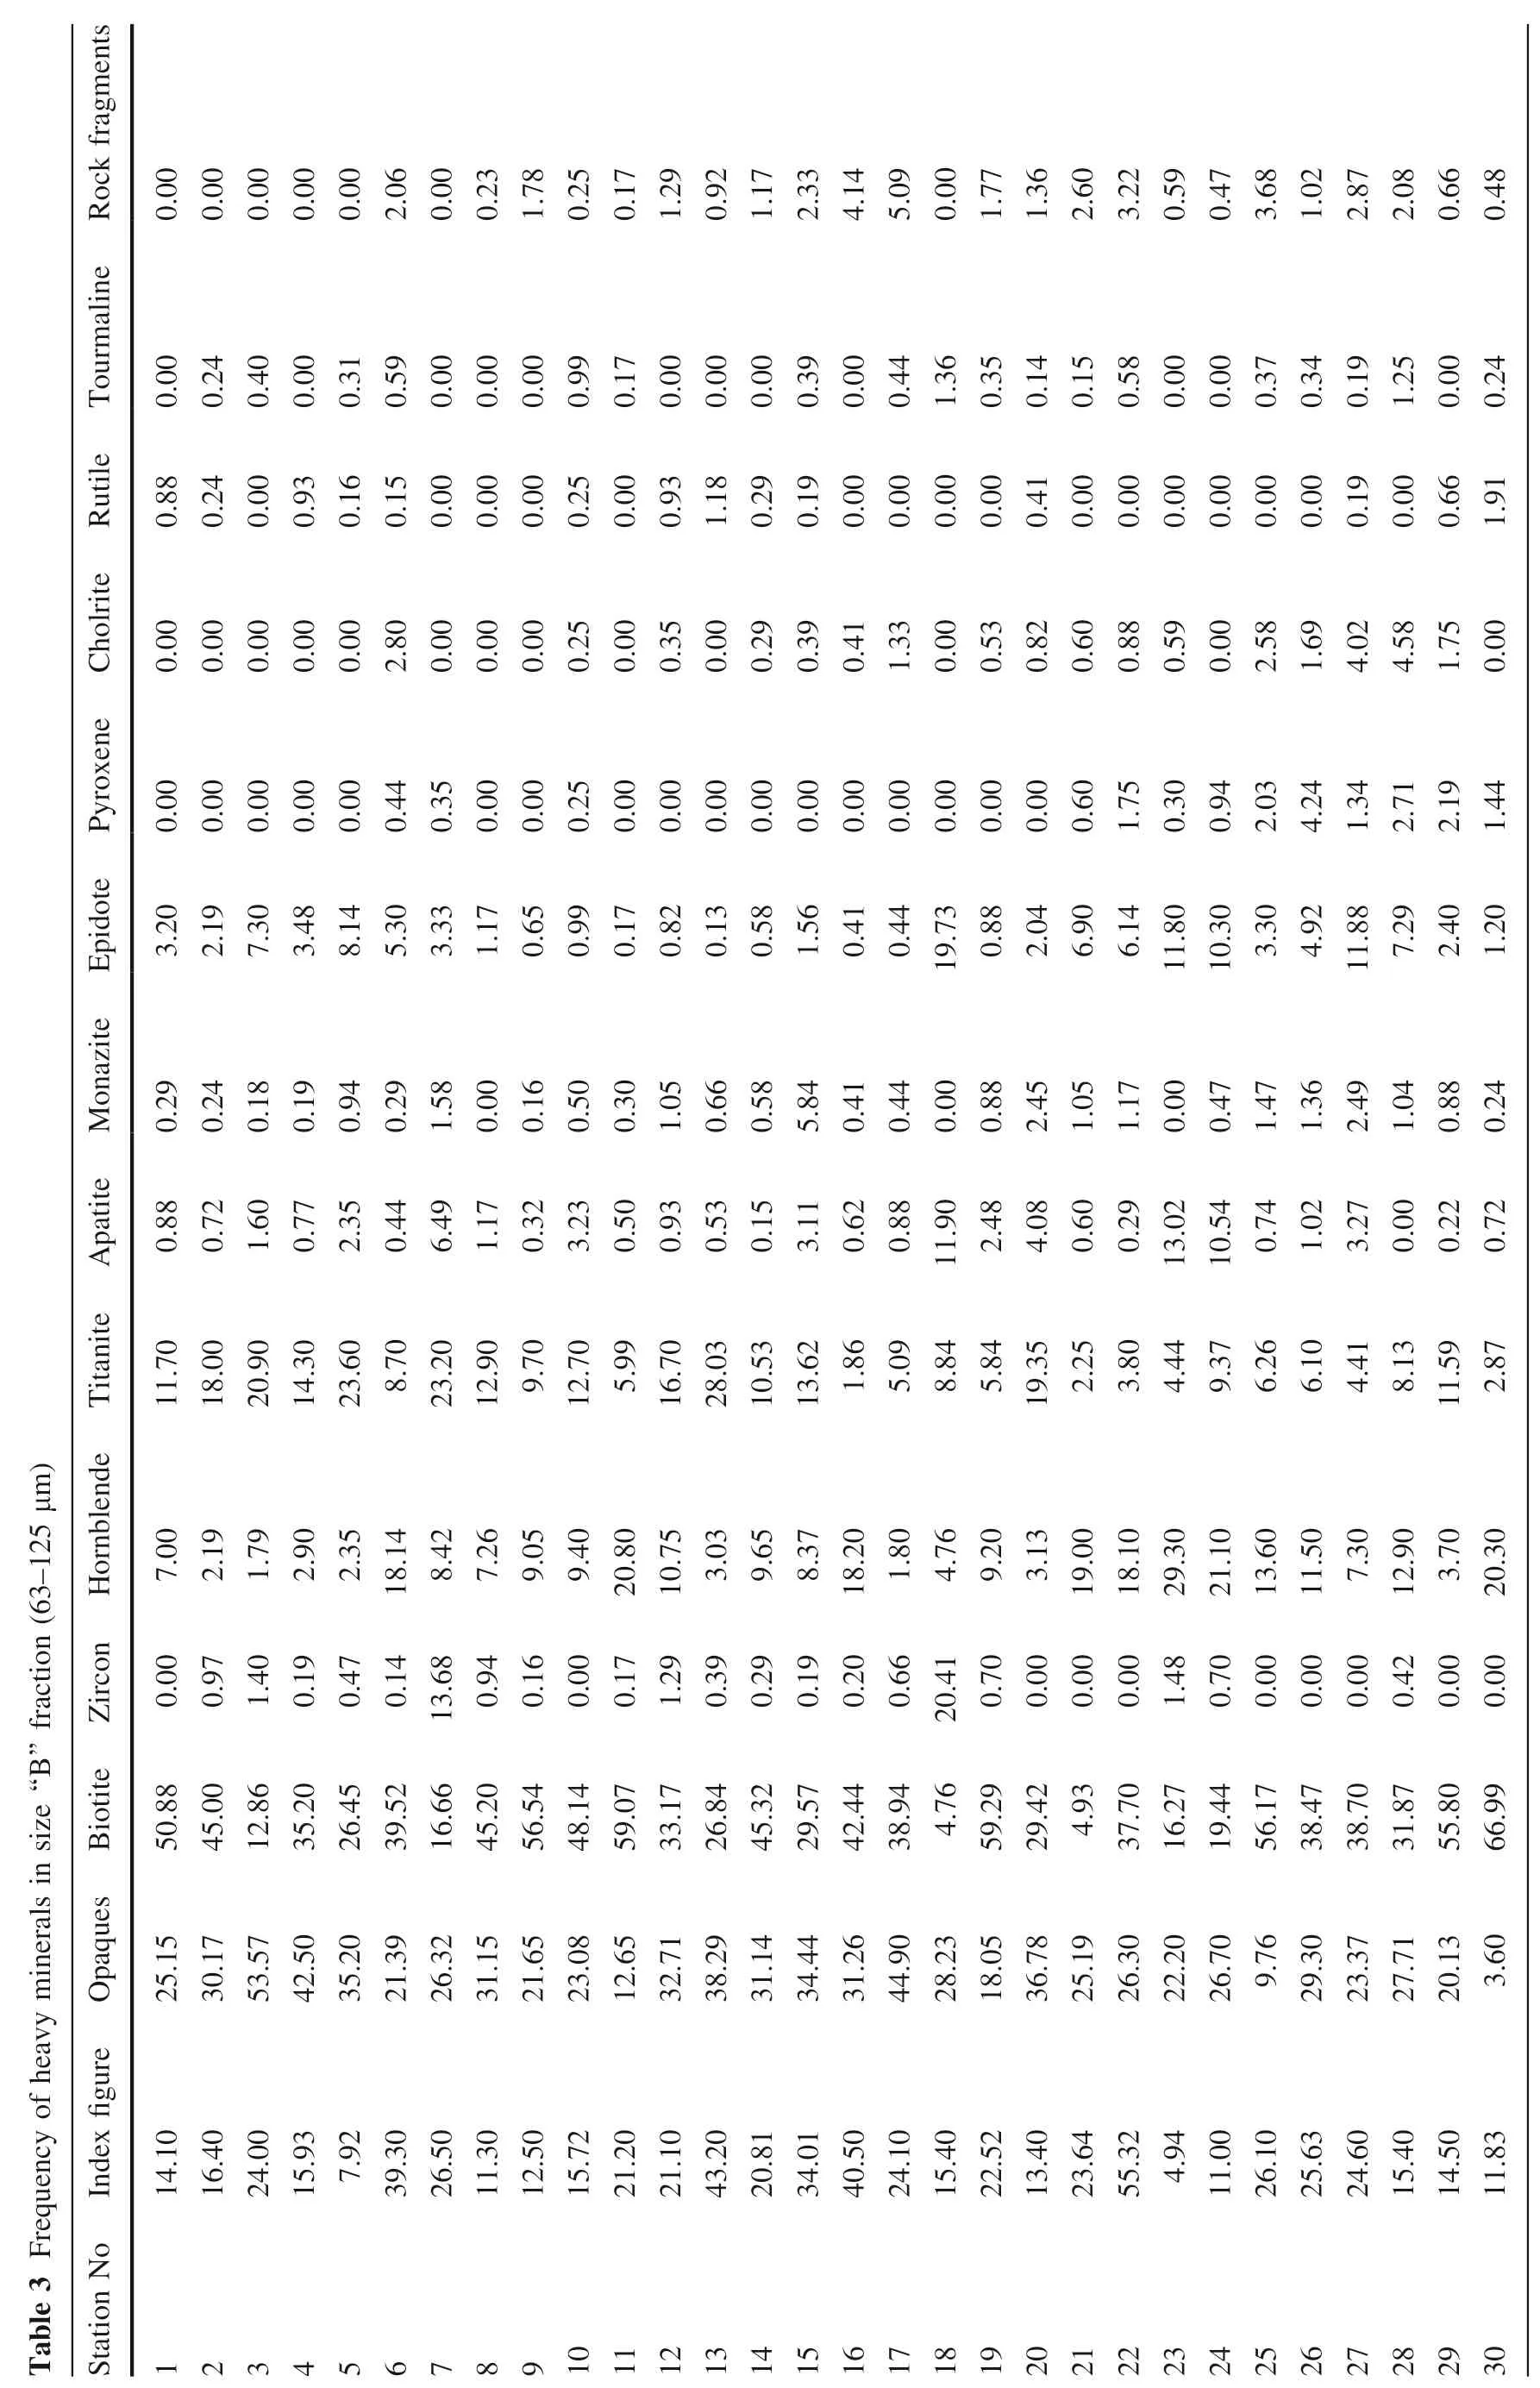
Tables 2 and 3 show that the studied Dahab stream sediments are enriched in heavy minerals as indicated by their high index figure averaging 21.37% in the coarse size fraction (126–250 μm) whereas it averages 25.94% in the fine size range (63–125 μm). Most of the investigated fractions were counted using both transmitted and reflected light after mounting in resin and polishing. The recorded non-opaque heavy minerals are arranged in decreasing order as follows: biotite-magnetite aggregates, monazite,apatite, titanite, zircon, zoisite, chlorite, amphiboles,pyroxenes, rutile, and tourmaline. Previously, the present workers gave details about the range and average frequency of heavy minerals in the ‘‘A’’ and ‘‘B’’ size fractions (Surour et al. 2003). It should be noted that rock fragments are recorded in the heavy fraction of size ‘‘B’’only. Regardless of the size of the heavy fraction, both opaques and biotite are the major constituents. Considerable amounts of zircon (up to 23.9%) are recorded in size‘‘A’’.

Table 1 Average grain size parameters of the Dahab stream sediments
To investigate the relationship between light fraction and index figure, graphic presentation of the light fraction percentage concerning the index figure that shows different configurations is given in Supplementary File 2. Index figure always represents the heavy mineral percentage of a sample. In the coarse size fraction (125–250 μm), the percentage of the light fraction percent occupies a wide area in all figures of pie circles except for stations No. 18 and 22 where the value of the index figure reaches about 55%. Index figures of stations 17, 8 and 23 are represented by narrow areas on the figures, as the value sometimes goes down to 1.8%. In the fine size fraction (63–125 μm), the index figure of station 23 is noticeably represented by a narrow area corresponding to about 5%. On the other hand,the index figure of station No. 22 is represented by the widest area where the value reaches about 55%. Hence it is clear that station No. 23 illustrates the lowest value of index figure display either in the coarse or fine-sized fractions. Station No. 22 represents the highest value of the index figure, also in both size fractions.

ne l i ma Tour e i l Rut 00 0.00 0.16 0.00 0.00 0.30 0.00 0.00 0.00 0.00 0.00 0.65 0.00 0.00 0.00 0.00 0.00 0.48 0.00 0.00 0.00 0.00 0.46 0.00 0.45 0.22 0.00 0.43 0.43 0.11 0.00 0.12 0.00 0.00 0.50 0.00 0.86 0.90 2.17 2.04 1.23 0.32 0.70 3.00 0.20 0.10 0.00 0.00 0.00 0.00 0.25 0.00 0.12 0.00 0.00 0.00 0.00 0.00 0.00 0.00 0.te r i Chol ne oxe Pyr e dot Epi 00 0.34 1.16 0.00 0.20 1.50 1.86 0.00 0.00 0.10 0.64 2.00 0.00 0.00 0.36 0.60 0.80 0.90 2.00 0.00 0.00 0.36 0.92 0.00 0.00 0.00 0.54 0.29 0.29 0.00 0.50 0.24 0.28 1.15 0.20 0.00 0.00 0.00 0.00 0.00 0.00 0.00 0.00 0.00 0.00 0.00 0.00 0.48 0.00 0.00 0.00 0.13 2.70 0.80 3.00 3.68 2.90 0.58 0.58 0.00 0.90 0.20 6..52 16.00.20 86 47 17 70.60 32 90 95 80 05 90 77 43.56 06 80.30.10.30.86.47.49.49.95 12 9.24 14 0.2.2.9.12 0.0.0.3.3.9.5.3.10 5.7.16 10 12 10 11 16 16 11 te z i Mona te t i Apa te ni ta T i 00 0.34 1.57 2.44 0.42 3.30 2.43 0.10 4.87 0.90 1.80 0.00 0.80 3.00 0.36 9.60 6.26 1.00 0.87 1.13 0.01 1.42 1.50 1.00 0.30 0.34 1.33 2.43 0.43 0.57 0.50 0..81 47 02 10.10 60.20 30.20.34 58.10 47.20.80 10 44.79.94.93 77.10 00 14 17.98 95 95.04 10 9.1.9.11 0.12 1.12 20 2.11 0.17 17 9.1.28 18 24 1.14 9.5.8.13 6.6.11 19 8..40.20.66.80 60.96.40.00.00.33.26.50 98 36 35 70 25 72.32 60 13 66 90 50 70 30 55 55 67 16 12 16 14 3.22 15 10 15 13 12 18 8.0.1.7.6.5.23 7.2.5.4.3.4.4.9.9.9.)μm(125–250 on t i a c f r’A’‘‘ende nbl Hor on rc Z i e i t ot B i.36 75 82.82 80.70.90.20 86.80 56.90.90 36.77.20 40 29 32 90.92.89.93.00 50 84 91 09 55 67 10 8.4.10 6.15 10 11 5.14 3.12 12 2.14 11 8.5.8.0.13 25 12 11 8.7.5.7.9.9.20 0..58.99 46 40 10 43.90 70.98 70 97.00 18.15.80 80 73 59 92 20 00 40 70 90 45 00 63 63 53 14 21 1.5.3.0.23 0.16 5.0.13 1.13 14 8.6.7.9.6.0.2.1.0.1.5.4.4.3..55.93.43.10.60.00.97.90.00.20.20.13.70.41.20.80.99.54.26 18.40.10.30.60.90.75.13.26.26.15 69 19 10 29 14 39 31 12 53 12 15 36 21 36 26 28 18 11 25 6.30 29 20 28 39 25 16 20 20 30 z e s i in ls ra ne m i avy he of y nc eque 2 Fr e Tabl s que Opa e figur x Inde.no ion a t St 73 9..68.40.70.90 20.90.90.90.00.50.87.40.65.60.60.05.13.00.03.60.40.60.70.00.95.43.29.29.59 19 24 30 19 9.30 14 23 16 25 33 14 49 14 15 35 59 19 30 10 29 24 29 26 36 39 33 33 25.62.80.60.63.42.70 00 80.40 94 90.10.20.81.22.50 80.90.10 90.70.32 94.00.10.20.60.30.30 93 10 12 16 15 13 29 9.4.15 7.7.21 43 20 38 20 1.60 17 5.25 55 4.11 34 13 11 20 13 6.12 34 56 78 910 11 12 13 14 15 16 17 18 19 20 21 22 23 24 25 26 27 28 29 30
s nt agme f r k Roc 00 0.00 0.00 0.00 0.00 0.06 2.00 0.23 0.78 1.25 0.17 0.29 1.92 0.17 1.33 2.14 4.09 5.00 0.77 1.36 1.60 2.22 3.59 0.47 0.68 3.02 1.87 2.08 2.66 0.48 0.ne l i ma Tour e i l Rut 00 0.24 0.40 0.00 0.31 0.59 0.00 0.00 0.00 0.99 0.17 0.00 0.00 0.00 0.39 0.00 0.44 0.36 1.35 0.14 0.15 0.58 0.00 0.00 0.37 0.34 0.19 0.25 1.00 0.24 0.88 0.24 0.00 0.93 0.16 0.15 0.00 0.00 0.00 0.25 0.00 0.93 0.18 1.29 0.19 0.00 0.00 0.00 0.00 0.41 0.00 0.00 0.00 0.00 0.00 0.00 0.19 0.00 0.66 0.91 1.te r i Chol ne oxe Pyr e dot Epi 00 0.00 0.00 0.00 0.00 0.80 2.00 0.00 0.00 0.25 0.00 0.35 0.00 0.29 0.39 0.41 0.33 1.00 0.53 0.82 0.60 0.88 0.59 0.00 0.58 2.69 1.02 4.58 4.75 1.00 0.00 0.00 0.00 0.00 0.00 0.44 0.35 0.00 0.00 0.25 0.00 0.00 0.00 0.00 0.00 0.00 0.00 0.00 0.00 0.00 0.60 0.75 1.30 0.94 0.03 2.24 4.34 1.71 2.19 2.44 1.20 3.19 2.30 7.48 3.14 8.30 5.33 3.17 1.65 0.99 0.17 0.82 0.13 0.58 0.56 1.41 0.44 0..73 88 04 90 14.80.30 30 92.88 29 40 20 19 0.2.6.6.11 10 3.4.11 7.2.1.te z i Mona 29 0.24 0.18 0.19 0.94 0.29 0.58 1.00 0.16 0.50 0.30 0.05 1.66 0.58 0.84 5.41 0.44 0.00 0.88 0.45 2.05 1.17 1.00 0.47 0.47 1.36 1.49 2.04 1.88 0.24 0.te t i Apa 88 0.72 0.60 1.77 0.35 2.44 0.49 6.17 1.32 0.23 3.50 0.93 0.53 0.15 0.11 3.62 0.88 0..90 48 08 60 29.02.54 74 02 27 00 22 72 11 2.4.0.0.13 10 0.1.3.0.0.0.te ni ta T i.70.00.90.30.60 70.20.90 70.70 99.70.03.53.62 86 09 84 84.35 25 80 44 37 26 10 41 13.59 87 11 18 20 14 23 8.23 12 9.12 5.16 28 10 13 1.5.8.5.19 2.3.4.9.6.6.4.8.11 2.)μm(63–125 on t i ac f r’B’‘‘z e s i ende nbl Hor on rc Z i e i t ot B i 00 7.19 2.79 1.90 2.35 2..14 42 26 05 40.80.75 03 65 37.20 80 76 20 13.00.10.30.10.60.50 30.90 70.30 18 8.7.9.9.20 10 3.9.8.18 1.4.9.3.19 18 29 21 13 11 7.12 3.20 00 0.97 0.40 1.19 0.47 0.14 0..68 94 16 00 17 29 39 29 19 20 66.41 70 00 00 00 48 70 00 00 00 42 00 00 13 0.0.0.0.1.0.0.0.0.0.20 0.0.0.0.1.0.0.0.0.0.0.0..88.00.86.20.45.52.66.20.54.14.07.17.84.32.57.44.94 76.29.42 93.70.27.44.17.47.70.87.80.99 50 45 12 35 26 39 16 45 56 48 59 33 26 45 29 42 38 4.59 29 4.37 16 19 56 38 38 31 55 66 in ls ra ne m i s que Opa .15.17.57.50.20.39.32.15.65.08.65.71.29.14.44.26.90.23.05.78.19.30.20.70 76.30.37.71.13 60 25 30 53 42 35 21 26 31 21 23 12 32 38 31 34 31 44 28 18 36 25 26 22 26 9.29 23 27 20 3.avy he of e figur y nc eque 3 Fr e Tabl x Inde No ion a t St.10.40.00.93 92.30.50.30.50.72.20.10.20.81.01.50.10.40.52.40.64.32 94.00.10.63.60.40.50.83 14 16 24 15 7.39 26 11 12 15 21 21 43 20 34 40 24 15 22 13 23 55 4.11 26 25 24 15 14 11 12 34 56 78 910 11 12 13 14 15 16 17 18 19 20 21 22 23 24 25 26 27 28 29 30
5 Mineralogy of the heavy fractions (non-opaque minerals)
Non-opaque minerals in the heavy fractions are represented by biotite, titanite, hornblende, epidote, pyroxene, tourmaline, rutile, chlorite, zircon, monazite, cerianite, and allanite. Biotite, mostly a brown variety, is detected in all samples but its highest value is reported at stations No. 1 and 30 in the coarse fraction or size A (125–250 μm) and fine fraction or size B (63–125 μm), respectively. Numerous apatite, zircon, and minerals opaque inclusions are encountered in biotite. Biotite looks to be derived from the wide-speared granitic rocks in the hinterlands and to a lesser extent from the pelitic schists and ortho-gneisses.Titanite ranks second in abundance and its high content in size ‘‘A’’ is recorded at station No. 7 (22.96%) (Table 2).At station No.13, the highest abundance of titanite in size‘‘B’’ is reported where it reaches up to 28.03%. The minimum abundance of titanite (0.36%) is reported at station No. 15 in size ‘‘A’’. Apatite occurs either as independent crystals or incorporated as inclusions in other minerals. In size ‘‘A’’, the highest content of apatite is 28.79% at station No.19, which greatly exceeds its value (13.02%) in size‘‘B’’ reported at station No. 7. Only one sample in size ‘‘B’’does not contain apatite. The lowest abundance in size ‘‘A’’amounts to 0.5 % at station No. 1. Fragmented granite or the irregular quartzo-feldspathic pieces contain apatite of variable size. Hornblende is the only detected amphibole mineral in the Dahab stream sediments. The highest abundance of hornblende is 25.89% at station No. 22 (Size‘‘A’’) whereas its highest value in size ‘‘B’’ amounts to 29.3% at station No. 23. The lowest abundance of hornblende goes around one. It amounts to 0.9 % (station No.20) and 1.79 (station No. 17) in sizes ‘‘A’’ and ‘‘B’’,respectively. Brown hornblende (Ti-bearing oxyhornblende) is common and it is most probably derived from the non-ophiolitic or younger gabbros of the Dahab area and other parts in southeastern Sinai (e.g. Abdel-Karim 2009). On the other hand, green hornblende is less abundant and is most probably derived from the calc-alkaline granitoids or metamorphic rocks. Epidote-group minerals are abundant and they are represented by pistachite and zoisite. Maximum abundance of epidote is recorded at station No. 5 (24%) in size ‘‘A’’ whereas its maximum abundance is 11.88% at station 27 in size ‘‘B’’ (Tables 2,3). It is difficult to predict the source of epidote because it could be derived from both felsic and mafic rocks in the hinterlands. Pyroxene is recorded in about 46.67% of the investigated stations and its maximum abundance (3.8%) is reported at station No. 24, with an average of 0.49% in size‘‘A’’. The highest abundance in size ‘‘B’’ is 4.24% at station No. 26, with an average of 0.58%. It seems that they are concentrated at the latter station as the hinterland is dominated by igneous rocks of a gabbroic composition.Pyroxene is represented by hypersthene and augite. Rutile is concentrated at the middle stations (from No. 7 to 13)attaining a maximum abundance of 3.7% at station No. 13 in size ‘‘A’’. The highest modal percentage of rutile in size‘‘B’’ is 1.91% at station No. 30. Chlorite represents the partial or complete alteration of biotite and hornblende. Its maximum abundance (2.64%) is recorded at station No. 11 with an average of 0.49% in the coarse fraction or size‘‘A’’. It is more concentrated at the southern stations, No.23 to 30, in the area under investigation. At station No. 23,an abundance of tourmaline reaches its maximum (0.46%)in the coarse fraction.
Zircon is an ultrastable mineral and it is present in all samples that belong to size ‘‘A’’ (except for No. 22) and about 66.67% in size ‘‘B’’ samples. The highest abundance of zircon in the coarse fraction reaches up to 23.9% at station No. 8 whereas it amounts up to 20.41% in the fine fraction. Zircon grains mostly occur either as short or long prismatic crystals that display bipyrmidal terminations,euhedrality, slight zoning, and twinning (Fig. 2a, b, and c).In some instances, zoned zircon contains fine dark inclusions (Fig. 2d) or another smaller generation of zircon(Fig. 2e). Some zircon grains show variable degrees of staining by iron (Fig. 2h). Some SEM images of zircon are given (Fig. 3a, b). Monazite is detected in most samples and its highest value (9.36%) is reported at station No. 15(size ‘‘A’’), with an average of 1.64%. In size ‘‘B’’, the highest value (5.84%) is also reported at station No. 15 with an average of 0.89%. Euhedral grains of monazite are colorless and pitted. The possible source rocks are felsic rocks (e.g. granite and pegmatites) that are common in the Dahab-Taba district. In addition to monazite, Surour et al.(2003) documented other minerals contain REE (cerianite,La-cerianite, and allanite) and thorite. They (op. cit.)documented the occurrence of thorite and they gave some spot chemical analyses of the mineral. Also, an extremely fine inclusion of the ZrO2phase, possibly zirconolite, is observed in ilmenite (Fig. 3c). It is worth mentioning that the concentrations of Ti, Fe, V, and Mn in the given spot analysis are attributed to their concentrations in the background (ilmenite host) and the tiny size of ZrO2as well.

Fig. 3 Back-scattered electron (BSE) image of subhedral zircon with biotite (Bt), b BSE image of cross-sectional zircon (Zr) rimmed by vermicular titanite (Tnt), and c SEM–EDX microanalysis and BSE image of Zr oxide inclusion phase in ilmenite
6 Detailed mineralogy of Fe–Ti oxides and other opaque minerals
6.1 Distribution of magnetite, ilmenite,and sulphides
About sixty samples were examined for their opaque minerals in reflected light after mounting in resin and polishing. Generally, opaque minerals of the Dahab stream sediments are represented by Fe–Ti oxides and minor sulphides, in addition to some precious metals. Fe–Ti oxide minerals (magnetite, ilmenite and their alterations) exhibit a variety of textures such as exsolution, alteration, and replacement textures. Characterization of detrital Fe–Ti oxide minerals is very helpful for the understanding of genesis especially when it comes to provenance or source rock (e.g. Blatt et al. 1980; Folk 1980; Tucker 1981; Pettijohn et al. 1987). Some trials have been made to investigate the role of heavy minerals in the study of provenance, e.g the black sand in north Egypt (e.g. Kaiser et al. 2014; Abdel-Karim and Barakat 2017) and the stream sediments in the Eastern Desert (e.g. El-Kammar et al.2020) but few similar studies had been performed in Saudi Arabia (e.g. Moufti 2014) or elsewhere in the Arabian arid region. The distribution of opaque minerals in the Dahab stream sediments is presented and discussed based on resources available from mineral counting and speciation using a universal stage. The microscopic description of the opaque minerals stresses on mutual relationships of minerals vs. microfabrics and textures.
Magnetite occurs as homogeneous, exsolved, and altered grains. The amount of magnetite ranges from 48.57% to 78.11% of the total opaques with an average of 64.98% in size ‘‘A’’ and from 60.03% to 75.22% with an average of 66.78% in size ‘‘B’’. Thus, magnetite displays a wide range in the coarse fraction in comparison with the fine fraction. Tables 4, 5 shows thathomogeneous magnetite(commonly martitized) is recorded in all of the studied samples. It ranges from 47.3% to 72.64% with an average of 60.27% in size ‘‘A’’ and it ranges from 47.04%to 64.9% with an average of 56.38% in size ‘‘B’’. It seems that heat martitization is higher in size ‘‘A’’ where it ranges from 1.27% to 9.84 % with an average of 4.71% and it ranges from 6.15% to 13.85% with an average of 10.7% in size ‘‘B’’. In terms of frequency,exsolved magnetiteis lesser than homogeneous magnetite. The former ranges from 5.4% to 12.97% with an average of 9.86% in size‘‘A’’, while it ranges from 2.52% to 11.69% with an average of 9.56% in size ‘‘B’’. The counted types of exsolved magnetite include banded, coarse trellis, sandwich, composite, internal, and external granules.Altered magnetiteis represented either by the replacement by titanite or the rutile-hematite intergrowth. Both types of alteration can be traced in almost all samples (Tables 4, 5).Supplementary File 3a gives the graphical presentation of the relationship between homogeneous and exsolved magnetite.
In the studied sediments, ilmenite is less abundant than magnetite, and the former is widely distributed in the majority of samples and it occurs in the form of either homogeneous or exsolved grains that show different and variable degrees of alteration. The highest value ofhomogeneous ilmeniteis detected in station No. 8 both the coarse and fine size fractions with the values of 22.56% and 24.43%, respectively (Tables 6, 7). From this table, one can notice that the lowest contents (2.97% and 4.34%) are recorded in station No. 21Exsolved ilmenite(as hemoilmenite intergrowth) is detected in some samples up to 1.9% in size ‘‘A’’ at station No. 17.Altered ilmeniteis detected in all samples, and the most common types of alteration are represented by titanite, rutile-hematite, and to a lesser extent by goethite. Replacement by titanite reaches up to 12.7% at station No. 27 in size ‘‘A’’. Alteration to rutile-hematite intergrowth is common and its highest value can be seen at station No. 4 where it amounts to 6.41% and 3.03% in sizes ‘‘A’’ and ‘‘B’’, respectively. The highest values (10.48% and 3.85%) of goethite alteration for ilmenite are recorded at station No. 27 in sizes ‘‘A’’ and‘‘B’’, respectively. The numerical relationship between homogeneous and exsolved ilmenite is presented by pie circles (Supplementary File 3b).
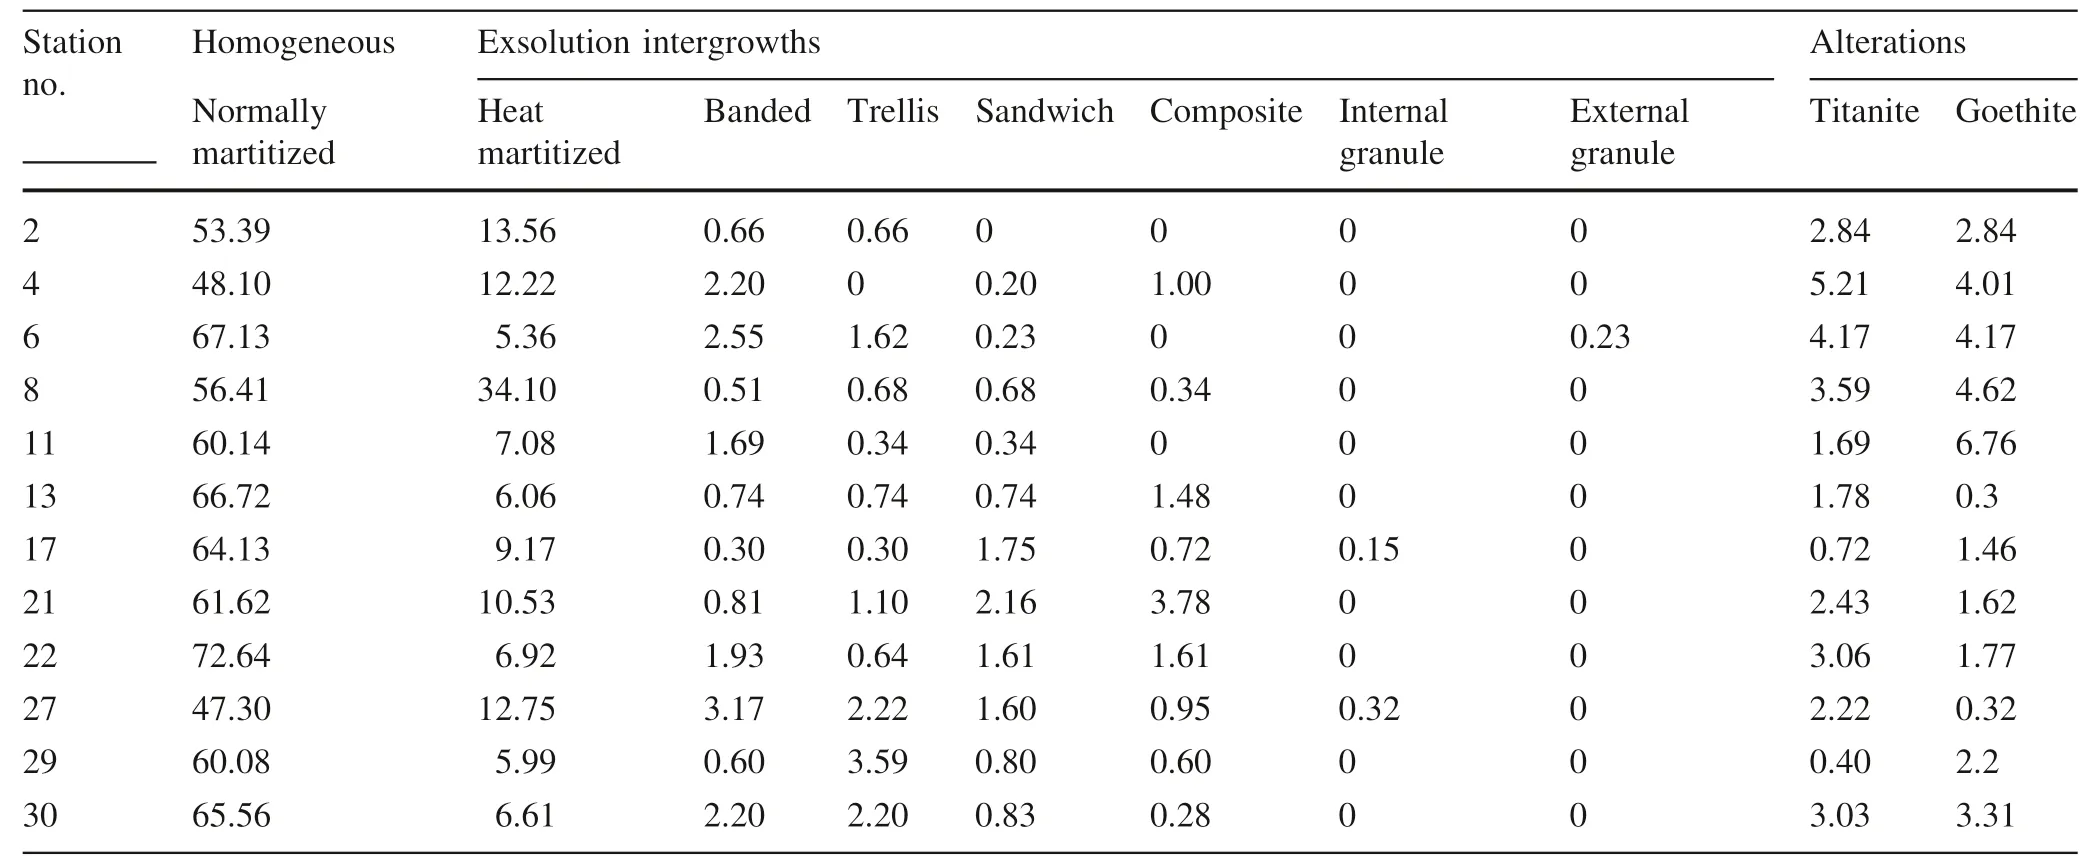
Table 4 Frequency distribution of magnetite (size fraction ‘‘A’’ 125–250 μm)

Table 5 Frequency distribution of magnetite (size fraction ‘‘B’’ 63–125 μm)

Table 6 Average frequencies of ilmenite and its alterations(size fraction ‘‘A’’ 125–250 μm)

Table 7 Average frequencies of ilmenite and its alterations(size fraction ‘‘B’’ 63–125 μm)
The highest content of sulphides (4.83%) is recorded at station No. 22 in size ‘‘A’’ and 4.34% at station No. 21 in size ‘‘B’’. The content in size ‘‘A’’ ranges from 0.63% to 4.83% with an average of 2.39% whereas it ranges from 1.24% to 4.34% in size ‘‘B’’ with an average of 2.17%.
6.1.1 Intergrowths of Fe–Ti oxides: primary vs. secondary textures
Our mineralogical investigation distinguishes homogeneous magnetite from the intergrown one. Intergrowths in magnetite (and in ilmenite as well) are either primary as exsolution from solid solution during crystallization of bedrock in the provenance or alteration intergrowths that results from an alteration in the provenance and during transportation. In the Dahab stream sediments, homogeneous magnetite is common and some grains are fresh and anhedral indicating that they are not derived for long distances. Exsolved magnetite contains intergrown ilmenite and other oxides in a variety of microfabrics. Different types of ilmenite-magnetite intergrowths are common in the Dahab stream sediments. In the coarse-trellis intergrowth, ilmenite lamellae are well-defined and oriented along the octahedral (111) planes of their magnetite host(Fig. 4a). Occasionally, the ilmenite lamellae are fine so it becomes fine-trellis intergrowth. Along octahedral planes of the magnetite host, closely-spaced thin lamellae of ilmenite are present forming fine network exsolution intergrowth. In most of these grains, the magnetite host shows variable degrees of alteration to martite. Banded and sandwich ilmenite-magnetite intergrowths are also present.In the former, magnetite contains more than two broad parallel bands of exsolved ilmenite (Fig. 4b). Sandwich intergrowth is the least common in which an ilmenite band is present along with one set of the octahedral planes of the martitized magnetite host (Fig. 4c). The majority of Dahab stream samples contain additional types of ilmenite-magnetite intergrowths, e.g. composite and granule. In the composite intergrowth, contact between ilmenite and magnetite is either straight (Fig. 4d) or curvilinear. When ilmenite alters, it is replaced by a sub-graphic mixture of rutile-hematite. Alteration and replacement textures of magnetite include pre- and post-depositional varieties, in which the latter is much more common. The pre-depositional textures of magnetite are normal and heating martitization, titanite, rutile-hematite, and pseudobrookitehematite intergrowth. The post-depositional alterations and replacement are dominated by the formation of goethite and ‘‘limonite’’. Martitization represents the oxidation of magnetite to secondary hematite or ‘‘martite’’. The term‘‘heat martitization’’ is used sometimes to indicate extensive oxidation of magnetite that propagates either along peripheries or cracks (Fig. 4e).
6.1.2 Ilmenite and its intergrowths
Detailed ore microscopic investigation shows that ilmenite is abundant in the Dahab stream sediments but no doubt it is less frequent than magnetite. A similar conclusion was reached by El-Kammar et al. (2007) for the beach sediments in western and southern Sinai. Ilmenite grains in the studied samples can be distinguished into three main categories, namely homogeneous, exsolved, and altered ilmenites. The examined homogeneous ilmenite occurs in the form of a single grain (Fig. 5a) and clusters or groups,particularly in the volcanic rock fragments. Some ferromagnesian minerals have fine needle-like inclusions of homogeneous ilmenite along their cleavage planes. In some instances, extremely fine specks of silicates and sulphides are observed as inclusions in coarse homogeneous ilmenite.Exsolved ilmenite is common in the majority of samples from the Dahab area and this is represented by two exsolution intergrowths, namely hemo-ilmenite and ilmenohematite (Figs. 5b, c, respectively). But in rare cases, the internal granule of magnetite is seen inside the ilmenite host forming magneto-ilmenite grain. Hemo-ilmenite exhibits a very distinct titanite reaction rim (Fig. 5b). Also,hemo-ilmenite displays a variety of alteration intergrowths,e.g. to sub-graphic rutile-hematite (Fig. 5d), or rutile only(Fig. 5e). Extensive replacement of homogeneous ilmenite to titanite is also observed (Fig. 5f). This type of alteration is sometimes extensive and only a few ilmenite relics survive.
7 Geochemistry of silt fraction
The geochemical investigation of the present work is based on data of the silt fraction that is noticeably enriched in heavy minerals and the Rare-earth elements (REE)-bearing minerals. The data include the majority of major oxides and a sizeable group of trace elements in twenty samples(Supplementary File 5). The volume of silt fractions from the rest 10 stations was inadequate for chemical analysis.
7.1 Rare-earth elements (REEs)
REEs configuration of the analyzed silt-sized fraction can tell about the signature(s) of the source rocks as well as the influence of the prevailing weathering conditions. The absolute magnitude of the abundance of these LREE follows the following order: Ce >La >Nd >Sm >Eu. The mutual distribution of these lanthanides is assumed to be influenced by the geological environment and crystal structure of their minerals as well as alteration and transportation. REEs are normalized to chondrite as well as to the primitive mantle (Taylor and McLennan 1985) to show the degree of fractionation (Fig. 6a). Supplementary File 5 shows that the samples contain considerable amounts of REE (345–391 ppm) with a relative enrichment of LREE to HREE. The LREE/HREE ratio ranges from 9.4 to 12.5.Generally, enrichment in the LREE reflects the incorporation of incompatible components. Figure 6b shows that Ce and La are the most abundant elements and the figure indicates a very steady distribution of Gd in all stations.Without reference to chondrite, the concentrations of less abundant REEs are shown in Fig. 6c in which some erratic distribution of Sm, Yb, and Er can be seen. The latter figure also indicates similar behavior of Sm and Er that is opposite to that of Yb. The highest peak of Er at station No.18 and Sm at station No. 19 is a reflection of sediment derivation from the mafic lithologies of the Kid volcanic group in the hinterland similar to elsewhere in the world(e.g. Kirkwood et al. 2016). All samples display a strong negative Eu anomaly (Fig. 6a). Pronounced depletion in Eu and enrichment in LREE together suggest the influence of highly evolved granitic provenance (El-Kammar et al.2001). Also, the Ce anomaly can be seen and the element ranges from 0.39 to 0.46. Figure 7 provides spot analyses of some REE-bearing minerals.

Fig. 4 Microphotographs of magnetite and its intergrowths, all are taken in polarized reflected light. a Fine- to coarse-trellis magnetite(Mg)-ilmenite (Ilm) exsolution texture, b Banded ilmenite (Ilm)-titanomagnetitd (Mg) exsolution texture in which magnetite is partially replaced by titanite (grey), c Sandwich-type ilmenite (Ilm)-magnetite (Mg) intergrowth, d Composite ilmenite (Ilm)-magnetite (Mg) showing linear contact and freshness, e Heat martitization of magnetite (Mg) and formation of vast domains of martite (Mt), and f Homogeneous titanomagnetite (Mg)extensively altered to titanite (Tnt)
7.2 High-field strength elements (HFSEs)
Yttrium in the studied samples ranges from 61 to 77 ppm with an average of 66 ppm (Supplementary File 5).Uranium and thorium contents lie in the ranges of 12–29 ppm and 24–37 ppm, respectively. In the studied samples,the U/Th ratio ranges from 0.49 to 0.96 (Supplementary File 5). This is supported by the positive correlation of silica and U+Th (Fig. 8a) and another positive correlation of U and Th (Fig. 8b). Zr has mainly concentrated in detrital fine grains of zircon as well as zircon inclusions hosted by biotite and hornblende. Zr content ranges from 240 to 298 ppm (Supplementary File 5).
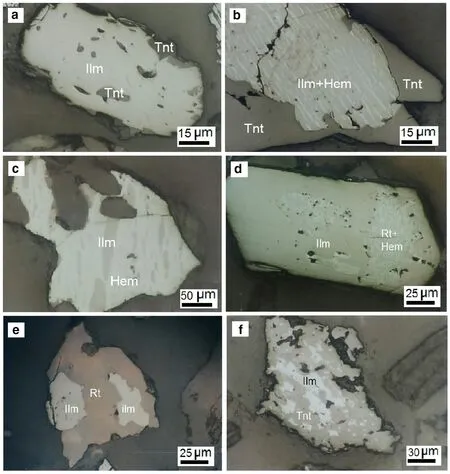
Fig. 5 Microphotographs of ilmenite and its intergrowths, all are taken in polarized reflected light. a Homogeneous ilmenite (Ilm) with partial replacement by titanite (Tnt), b Fine hemo-ilmenite exsolution (Hem + Ilm) with broad titanite (Tnt) reaction rim, c Spindle-shaped exsolved ilmenite (Ilm) in hematite (hem) forming ilmeno-hematite exsolution intergrowth, d Homogeneous ilmenite (Ilm) showing euhedrality and partial alteration to rutile-hematite (Rt + Hem), e homogeneous ilmenite (Ilm) altered to rutile (Rt), and f Extensive replacement of ilmenite(Ilm) by titanite (Tnt)
7.3 Large-ion lithophile elements (LILEs)
LILEs are large cations of low charge as compatible elements. In the silt fraction, Rb shows a high concentration magnitude (156–220 ppm) with an average of 183 ppm(Supplementary File 5). Such a considerable Rb content is related to the abundance of biotite and K-feldspars in the hinterlands, mostly as essential constituents of younger granitic rocks. Despite the relatively low regression value of the trend line, Rb shows a positive correlation with LREE especially La (R2=0.332, Fig. 8c) as well as with some base metals such as Zn (R2=0.392, Fig. 8d). This indicates a considerable fractionation degree of the felsic melt that produced the granitic source rocks. Zn ranges from 24 to 51 ppm and its abundance is correlated to the amount of biotite in the silt fraction.
7.4 Transition elements
These include mobile (e.g. Mn and Cu) and immobile (e.g.Co, Ni, V, and Cr) elements. Cu is low (3–6 ppm) except for the two adjacent stations 26 and 27 near the mouth of Wadi Kid where polymetallic sulphides are present(Khalifa et al. 2011). A distinct feature of the studied silt fraction is the sum content of Cr, Co, and Ni that never exceeds 10 ppm. EDX analyses of some mineral grains show that not only magnetite contains V but also incorporated in thorite with up to 8.26 wt% V2O5such as thorite.For example, the thorite grain shown in Fig. 9 has 3.23 wt% V2O5content (Fig. 9).

Fig. 6 a Spider diagram showing the chondrite normalized REEs pattern in the silt fractions from 20 stations out of 30. Mean, minimum and maximum values are shown, b Distribution of high abundance REEs elements, and c Distribution of low abundance REEs

Fig. 7 a SEM–EDX microanalyses and BSE images of REE-bearing minerals, a Lacerianite, and b Ce-type monazite
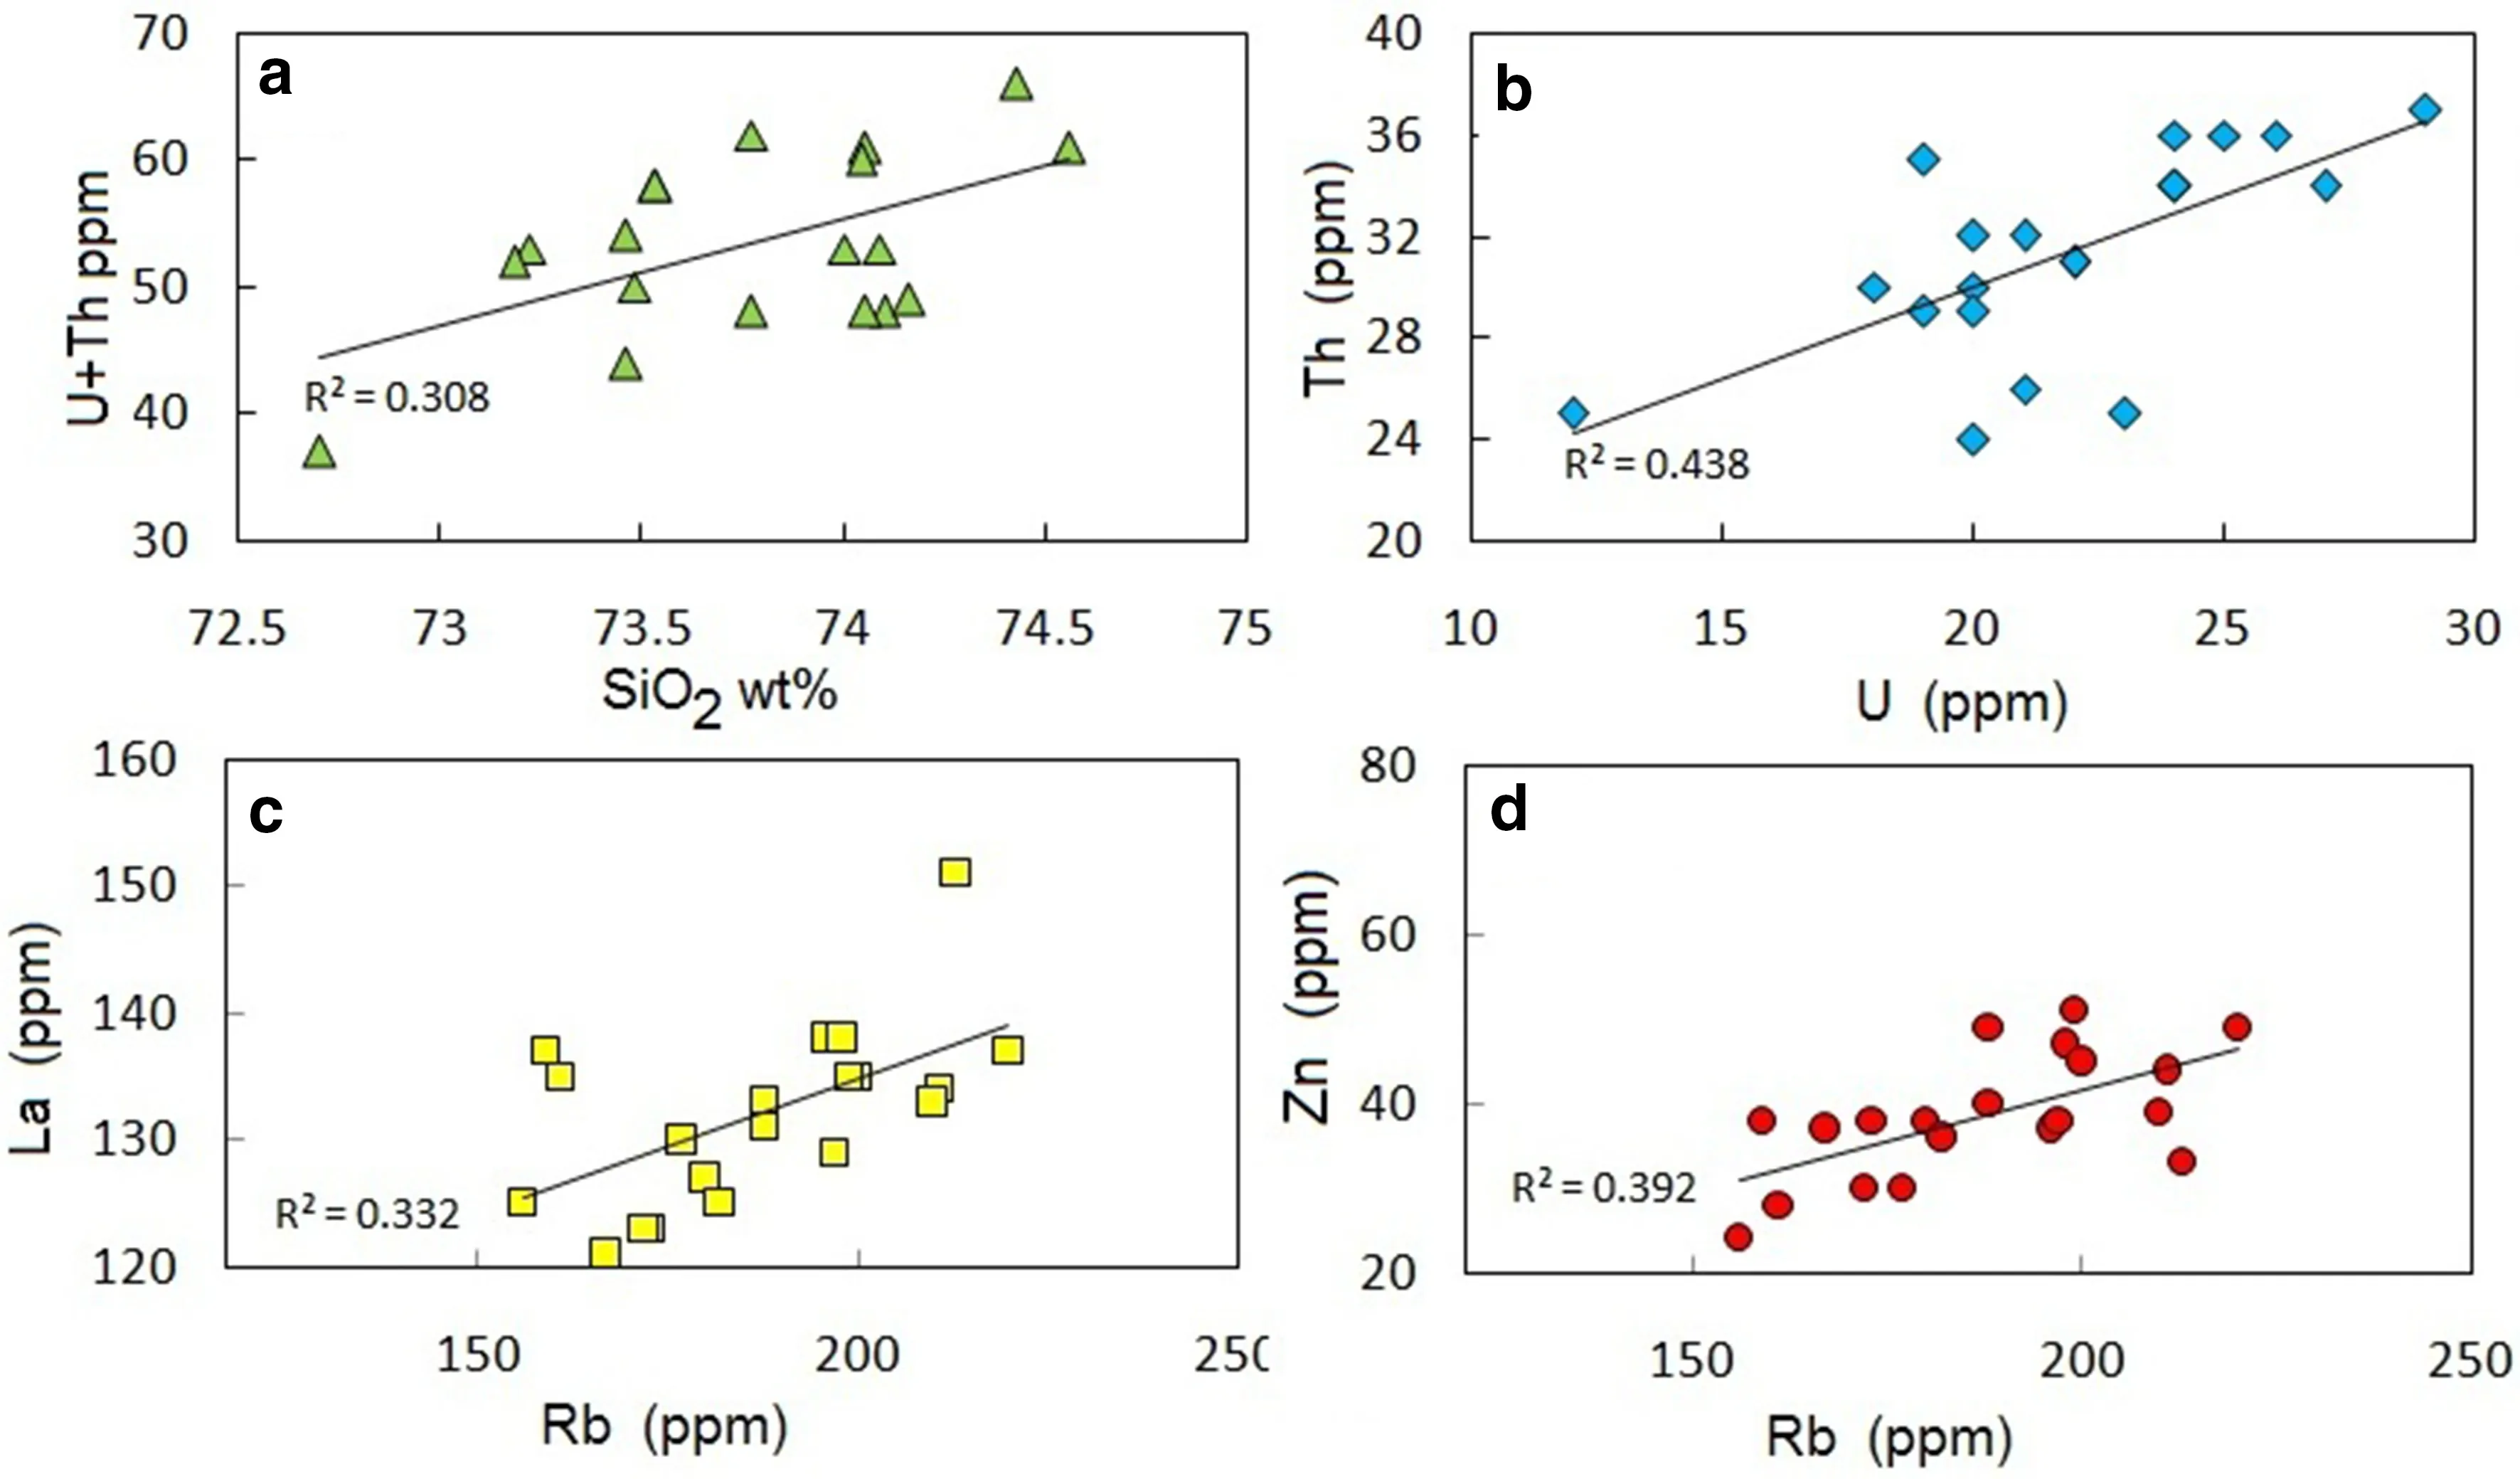
Fig. 8 Binary relationships of some chemical components in the studied silt fractions from 20 stations showing different degrees of positive correlation. The value of the regression trend line (R2) is given for each

Fig. 9 SEM–EDX microanalysis and BSE images of V-bearing thorite
8 Discussion
8.1 Speciation and textural evolution of Fe–Ti oxide minerals
Ore microscopic investigation indicates that magnetite is mostly titaniferous due to its pinkish appearance and common replacement by titanite. The pinkish tint of magnetite increases with increasing the Ti4+in the lattice structure (Buddington 1956; Buddington and Lindsley 1964). Usually, exsolved magnetite is very informative about the source rocks. Darby and Tsang (1987); Basu and Molinaroli (1989, 1991); Haggerty (1991) reported that exsolution intergrowth textures of Fe–Ti oxides significantly improved their usefulness as provenance discriminators. Basu and Molinaroli (1989, 1991) concluded that Fe–Ti oxides from plutonic igneous sources display more common exsolution intergrowth textures in comparison to those from a metamorphic source.
These types of exsolution intergrowth are common in mafic rocks (particularly gabbros) and Fe–Ti ores in the source area (e.g. Grigsby 1990; Haggerty 1991; El Nashar and Niazy 1997; Surour et al. 2017). Abdel-Karim (2009)and Surour et al. (2017) concluded that ilmenite trellis lamellae in magnetite and titanomagnetite indicate an exclusive magmatic oxidation process, and they believed in the influence of excess oxygen contained in titanomagnetite in addition to trapped oxidizing agents and an external oxidizing agent(s). Hubaux (1960) attributed the sandwich intergrowth to contemporaneous crystallization of magnetite and ilmenite but Buddington and Lindsley(1964); Haggerty (1991) suggested that all the types of ilmenite-magnetite intergrowths are formed by oxidation of magnetite-ulvo¨spinel solid solution. The term composite intergrowth was defined by Haggerty (1976) for intergrowths in which euhedral to anhedral inclusions of
ilmenite are frequently present in titanomagnetite and these inclusions display sharp contacts against their host. In external and internal granule intergrowths, spherical or oval-shaped granules of ilmenite occur inside or just outside the magnetite host. This type of intergrowth is infrequent in the studied samples. Buddington and Lindsley(1964) recommended the term ‘‘composite’’ rather than‘‘granule’’ for both because most probably ilmenite is formed as a primary phase or as products of oxidation exsolution in magma condition. Possible sources of ilmenite-magnetite exsolution intergrowth and titanomagnetite are the intra-plate or younger granitic rocks in southeastern Sinai (Saad 2005) and to a lesser extent the arc-related or older granitoids (Surour and Kabesh 1997).
Heat martitization may indicate magnetite derived from extrusive magma such as mafic lava flows (Wassif et al.2012). Low-temperature oxidation of titanomagnetite into martite results in decreases in iron and increases in oxygen and titanium (Furuta et al. 1985). The Dahab stream sediments contain some other intergrowths (rutile-hematite and pseudobrookite-hematite) that indicate pre-depositional high-temperature alteration of Ti-magnetite. Replacement of magnetite by titanite is common at peripheries of Timagnetite, continuous or discontinuous reaction rims of titanite is developed (Fig. 4f). Also, titanite replacement for magnetite can be observed along cleavage planes and cracks. Surour et al. (2017) documented that the replacement of titanite needs metamorphic conditions so the source rock of the detrital sediments is metamorphosed gabbro (metagabbro) in the hinterlands. The degree of replacement varies from moderate to extensive according to the grade of metamorphism and availability of Ca2+from the collapse of the calcic plagioclase structure. The younger or arc-related gabbros in the Sinai Peninsula are the most probable sources of hemo-ilmenite and ilmenohematite exsolution intergrowths (El Makky 1990; Takla et al. 2001; Saad 2005).
Alteration of ilmenite in detrital sediments is attributed to post-depositional actions that include weathering and erosion (Jensen 1966). Nevertheless, the present authors document here some pre-depositional alterations of ilmenite in the original igneous and/or metamorphic source rocks in the provenance before decomposition and transformation into detritus. Here we document rutile-hematite intergrowth, replacement by titanite, and pseudobrookitehematite intergrowth as pre-depositional alterations of ilmenite. Rutile-hematite intergrowth is present either in homogeneous or exsolved ilmenite. In case pseudorookite is not a replacement for ilmenite, arc volcanic for example have pseudobrookite + titanomagnetite assemblage in a magmatic symplectite intergrowth around ilmenite (Mullen and Mccallum 2013). Experimentally, pseudobrookite replaces ilmenite when the oxidation temperature reaches 900 °C (Xiao et al. 2013). Rutile-hematite intergrowth results from the oxidation of ilmenite during metamorphism rather than during magma crystallization (Ramdohr 1980). According to Xiao et al. (2013), ilmenite is altered to rutile-hematite intergrowth by oxidation when temperature amounts to 700–800 °C, i.e. it is a pre-depositional intergrowth. The replacement of ilmenite by titanite is common in igneous rocks as the result of autometasomatism or as a product of hydrothermal alteration (Jensen 1966). Pseudobrookite-hematite intergrowth after ilmenite is rare in our samples and it occurs in a sub-graphic form in which some relict of ilmenite is still seen. Finally, postdepositional alterations of ilmenite in the studied stream sediments are represented by partial and complete replacement of ilmenite by a mixture of goethite and‘‘limonite’’ in the form of irregular aggregates or occasional concentric bands. Hydrous Fe-oxides are sometimes interlocked with anatase as a leucoxene mixture. Frost et al.(1983); Hugo and Cornell (1991) explained the process of leucoxinization in terms of silica and alumina impurities during post-depositional alteration of ilmenite. Mu¨cke and Chaudhuri (1991) believed that alteration of ilmenite to leucoxene passes by a transitional phase of pseudorutile.
8.2 Sulphides and placer metals (gold and silver)
Sulphides are highly susceptible to alteration by hydration in a stream condition. Nevertheless, some sulphides are still preserved because they are protected as inclusions in Fe–Ti oxide minerals, mostly magnetite. In the heavy fractions, sulphides are represented by pyrite, chalcopyrite,sphalerite, and pyrrhotite. The size, form, and habit of these sulphides are variable, and when not fresh they are replaced by goethite and covellite. Some stations in the southern part of the study area (e.g. Nos. 29 and 30, Fig. 1)are possibly derived from the sulphide-rich Heib Formation of the Kid metamorphic complex (Soliman et al. 1996;Khalifa et al. 2011) whereas they are derived from sulphide-rich younger gabbros in the northern part (Takla et al. 1981, 2001; Abdel-Karim 2009). Details of gold occurrence (up to ~15 g/t in the heavy fraction of size‘‘B’’) are given by Surour et al. (2003). Similar to gold, the microscopic investigation suggests the occurrence of few silver grains. Some preliminary ICP-MS results of the silt fraction indicate Ag content in the range of 0.22–0.7 ppb.Ag content of some analyzed grains reaches up to 96.73 wt%. Few silver grains are usually present in gold-rich samples and this is attributed to differential transportation(Vavelidis et al. 1997). There is still a need for more exploration programs and detailed mineralogical studies to assess the potentiality of fossilized and recent placers for noble metals in the Sinai Peninsula (east and west).Recently, Alshami (2019) documented the occurrence of paleo- or fossilized placer gold in the Infra-Cambrian sandstone in southwestern Sinai. Some Phanerozoic strata in eastern Sinai witness the presence of paleo-placer gold(e.g. Hassan et al. 2013).
8.3 Geochemical signature of the silt fraction
Ce anomaly can result from the difference in migration coefficient of Ce4+and REE3+that is a function of oxygen potentiality of the melt from which source rock was formed. The separation of ore-forming hydrothermal fluids is associated with a considerable decrease in oxygen potentiality of the alkaline melt (Condie and Snansieng 1971). Strong support for this hypothesis is the fact that A-type magmas are reduced in most (Anderson 1980;Collins et al. 1982; Wones 1989; King et al. 1997).Information about the preferential partitioning of Ce upon oxidation is confirmed by the SEM-EDX examination that reveals the common occurrence of cerianite and monazite grains (Fig. 7). Monazite grains from the Dahab stream silt fraction are enriched in LREEs especially Ce, La, and Nd similar to detrital monazite from Egypt and Iraq (Abdel-Karim et al. 2016; Kettanah and Ismail 2016). Thus, the mineral is classified as monazite-(Ce) type (Linthout 2007).
HFSEs are highly charged cations and their incompatibility can be attributed to the fractionation of feldspars and magnetite (Currie et al., 1986 and Zhao et al., 1995). The HFSE cations include Th, U, Pb, Zr, Hf, Ti, Nb, and Ta besides Sc and Y that are obtained by ICP-MS analysis.These values are comparable to phase III granite of southeastern Sinai (e.g. Mashaal et al. 1999). Lambert and Holland (1974) stated that a wide range of Y is connected persistently to Ca-bearing minerals so Y is kept in the structure of accessory minerals, e.g. apatite, of the granitic source. The comparison between the two radionuclides indicates that Th always dominates over U which was also noted by Abdel-Karim et al. (2016) in the beach sediments.Under the prevailing surface conditions, U is much more mobile upon its oxidation to its soluble form (U+6) whereas Th is relatively immobile. Surour et al. (2003) concluded that the Dahab stream sediments contain radioactive Hfbearing zircon, monazite, and thorite as excellent sources of both U and Th in the silt fraction. The Th/U ratio is slightly higher than unity suggesting relative leaching of U during weathering and transportation. The ratio is used to discriminate igneous rocks as it commonly increases from 0.3 in mafic rocks and up to 6 in more differentiated and evolved felsic igneous rocks. The contents of U and Th in the studied samples indicate that they are derived from igneous rocks, which are dominated by a relatively fertile felsic source. The latter is evidence of direct concentration of radio-elements as a ‘‘fingerprint’’ of the felsic igneous source. Recently, Hassan et al. (2019) and El-Kammar et al. (2020) noticed that enrichment of U and Th in the stream sediments from the Egyptian Eastern Desert is a function of granite occurrences as a source rock. The high values of Zr can be explained by its inheritance in zircon derived from the granitic hinterlands (Watson and Harrison 1983; Wickham 1987; Kabesh 1993). Nb content (16–34 ppm, Supplementary File 5) is another support of granitic source rock. This Supplementary File indicates that there is no clear correlation between Nb and its heavier isovalent Ta, and this can be seen in the correlation matrix calculations (Supplementary File 4).
Because Zn tends to replace ferrous ions in the mineral structure, it is enriched in the ferromagnesian minerals such as biotite, magnetite, and ilmenite (Rankama and Sahama 1968). The high content of Zn in the studied samples is similar to Zn content in younger granite of Egypt (e.g. Abu El-Leil et al. 1995). Ba content ranges from 420 to 500 ppm with an average of 460 ppm (Supplementary File 5).Similar values are assigned to phase II younger granite in southeast Sinai (Mashaal et al. 1999). Bishady et al. (1999)attributed the enrichment in Ba to the fractionation of plagioclase in the mother rocks. The range of Sr content is 98–158 ppm, and the lowest content is attributed to its quick leaching from Ca-bearing minerals such as apatite during weathering and transportation.
El-Boghdady (1992) suggested that any decrease in the contents of Cr, Co, and Ni concentration is connected to decreasing ferromagnesian minerals, i.e. a less contribution of mafic rocks in the provenance. Content of V is appreciably high and it lies in the range of 10–25 ppm (Supplementary File 5). The high values of vanadium can be attributed to its accommodation in the magnetite lattice as it replaces some iron along the course of magmatic crystallization (Mason 1966; Mashaal et al. 1999). Content of major oxides does not show irregularities like trace or rare elements do. As can be noted in Supplementary File 5,major oxides sometimes resemble a granitic composition due to the predominance of the felsic materials derived from the input. This is supported by the correlation matrix(Supplementary File 4) in which one can observe the nearly homogeneous distribution of Silica, alumina, and alkalis.No remarkable correlation is found between silica and alkalis suggesting no influence by mica or clay minerals.Supplementary File 5 shows very distinct variation in the FeO/MgO ratio where the highest values (15.58, 15.7, and 22.7) are encountered in stations No. 30, 14, and 17,respectively. The lowest values (3.14 and 4.24) characterize stations No. 26 and 16, respectively. It seems that the FeO/MgO ratio is controlled by the index figure bearing in mind that the two oxides are accommodated in structures of Fe–Ti oxide minerals as well as the ferromagnesians. The relative abundance of magnetite over ilmenite also controls the FeO/Mg ratio.
Concerning the high field strength elements (HFSE), the Zr/Y ratio is relatively narrow (3.12 at station No. 9—4.83 at station No. 18). The Zr, Hf, Ti, U, and Th, are significantly enriched in the studied Dahab other incompatible large ion lithophiles such as Sr and Ba are not enriched indicating relative solubility despite the immaturity of the weathering processes. There is reflected in the even distribution of zircon in the majority of samples. Also, the appreciable amounts of Y-bearing minerals such as monazite, and to lesser extent garnet, also play a role. The Th/U ratio runs around unity (1.1–1.3) in stations No. 17, 20, 23,and 26 but it is doubled in station No. 14 (2.1) owing to anomalous thorite content in the heavy fractions. This is a strong indication of a highly differentiated source, i.e. a felsic source supported by the negative Eu anomaly. Based on the geochemistry of basement rocks from literature,there is a similarity of the REE pattern with felsic source rocks and this indicates that the studied stream sediments,which are badly sorted before extraction of the heavy fractions (silt-sized) resulted from mechanically crushed rocks. These rocks show negligible mineral separation particularly in fractions coarser than silt.
9 Conclusions
1. The presented geostatistical data indicate the immaturity of the Dahab stream sediments. They are derived from almostin-situPrecambrian basement rocks.Index figures reach up to 21.37% and 25.94%, in coarse and fine fractions, respectively.
2. From the economic point of view, contents of gold,zircon, V-bearing thorite, and Fe–Ti oxides are appreciable with some occasional enrichments or REEbearing minerals such as Ce-type monazite, allanite,and La-cerianite.
3. Mineralogically, the non-opaque and opaque heavy fractions suggest multiple source rocks at the provenance and that is dominated by within-plate alkaline granites, mostly A-type granite, and pegmatite. Contributions from additional sources such as arc gabbro and the volcano-sedimentary schists of the Kid group should be also considered.
4. Magnetite dominates over ilmenite in the heavy fraction and the amount up to 78.11% and 24.43%,respectively. They display a variety of intergrowth textures that can talk about source rock, e.g. the predepositional textures in the form of exsolution textures that result from solid solution in proper high-temperature magmatic condition. Also, intergrowths that result from oxidation either during low-temperature oxidation of late-stage magma (i.e. pre-depositional) or during transportation and deposition (i.e. postdepositional).
5. The relative abundance of magnetite over ilmenite also controls the FeO/Mg ratio. It is also controlled by the index figure and content of ferromagnesian minerals.
6. The geochemical composition of the silt fraction again supports derivation from a provenance rich in felsic igneous rocks. This fraction is characterized by appreciable content of REEs (345–391 ppm) and LREE/HREE ration in the range of 9.4–12.5.
7. In the majority of stations, the negative Eu anomaly and the values of the Th/U ratio are strong support for highly differentiated felsic sources represented by the A-type granites and pegmatites.
8. The highly evolved felsic source rocks can be obtained from the enrichment in LREE and strong negative Eu anomaly. There is evidence of preferential portioning of Ce during late-stage oxidation of the felsic melt.
9. Enrichment in U and Th (up to 37 ppm) is relative or even limited and does not suggest any abnormalities of radionuclides. This should be considered seriously in the context of radioactive hazard mitigation is recommended for any future construction activities in the Dahab area that represents a spot of touristic attraction and urban growth.
AcknowledgementsThe authors are indebted to Dr. Ahmed Abdel-Halim for his sincere help during the field trips. Laboratory technicians at the Department of Geology at the Cairo University are very thanked for their efforts for the grain size analysis and during heavy liquid separation as well. Finally, thanks to our colleagues at the Central Laboratories of the Egyptian Mineral Resources Authority(EMRA) for their patience during SEM-EDX backscatter imaging and microanalysis. The authors are thankful to the managing editor(Dr. Binbin Wang) and two anonymous reviewers for their constructive comments and recommendations that helped to increase the scientific merit of the submitted work.
FundingNo funding received.
Availability of data and materialAny additional data are available on request. Data materialized in the manuscript are original.
Code availabilityNone.
Declarations
Conflict of interestThe authors declare that they do not have any known competing financial interests or personal relationships that could have appeared to influence the work reported in this paper.
杂志排行
Acta Geochimica的其它文章
- Interception, degradation and contributions of terrestrial organic carbon obtained from lignin analysis in Wujiang River, southwest China
- Response of silicate chemical composition variation on thermal metamorphism of ordinary chondrites and classification of petrologic types: the case of L chondrites from Grove Mountains, Antarctica
- Hydrogeochemical characteristics and its role in controlling arsenic mobilization in a shallow aquifer
- Constraints on unconsolidated pyroclastic flow sediments related REE enrichments originated from potassic-alkaline Go¨lcu¨k stratovolcano: Darıdere-Direkli-Yakao¨ren (DDY) table 4deposits,southwestern Anatolia of Turkey
- Fluoride ions in groundwater of the Turkana County, Kenya, East Africa
- Distribution of functional microorganisms and its significance for iron, sulphur, and nitrogen cycles in reservoir sediments