Fluoride ions in groundwater of the Turkana County, Kenya, East Africa
2021-11-04PiotrRusiniakKlaudiaSekuOndraSracekPiotrStopa
Piotr Rusiniak • Klaudia Sekuła • Ondra Sracek • Piotr Stopa
Abstract Groundwater samples were evaluated throughout Turkana County (Kenya, East Africa) while looking for drinking water sources. Some samples showed high concentrations of fluoride with values in the range of 0.15–5.87 mg/L. Almost 50% of the samples exceeded the WHO and Kenyan potable water standard guideline value of 1.5 mg/L for drinking water quality. The hydrogeochemical studies revealed that the dominant cation in water is Na+ and the dominant anion is HCO3- resulting in Na-HCO3 type of groundwater, followed by Ca/Mg-HCO3 or Na-SO4 and Na-Cl in a few cases. Speciation modelling revealed that the groundwater is undersaturated with respect to gypsum and anhydrite, mostly undersaturated with respect to fluorite (6 samples are at equilibrium), and supersaturated or at equilibrium with respect to calcite(CaCO3). Precipitation of calcite favours the dissolution of F-rich minerals in the alkaline medium. Simultaneously,groundwater is enriched with sodium and bicarbonate,probably as a result of chemical weathering of Na-feldspar.Investigated groundwater can be presumably used for drinking purposes from 17 wells, but a detailed investigation of other trace element concentrations is necessary.
Keywords Africa ∙Kenya ∙Fluoride ∙Groundwater ∙Drinking water ∙Speciation calculation
1 Introduction
Fluorine (F) belongs to the halogen group (17th group in the periodic table), its prevalence in the Earth’s crust reaches 0.06%–0.09% and classifies it at the 13th place in terms of occurrence among other elements (Singh et al.2018). It is one of the important microelements for the human organism, thus its deficiency and also excess are adverse for human health. The range between desired(0.05–0.07 mg/kg body weight) and toxic dose (5 mg/kg body weight) for fluoride are quite narrow (Fordyce 2011;Ullah et al. 2017). The recommended concentration of fluoride ions in drinking water should not exceed 0.7 mg/L.The reported cases of fluoride poisoning mainly concerned toothpaste, mouth rinses, and supplements (Ullah et al.2017). In the case of fluorine deficiency, the tooth enamel may not be protected against the sugar acids what can lead to tooth decay (Hsu et al. 2018; Singh et al. 2018). Long exposure to the high concentration of fluorine, above the guideline value (GV = 1.5 mg/L) recommended by the World Health Organization (2017), can lead to the dental(0.9–1.2 mg/L of fluorides supplied with drinking water and dependent on other exposure sources) or skeletal fluorosis (3–6 mg/L of F-in drinking water). Fluoride ions in the human organism can co-precipitate with calcium ions as insoluble CaF2(fluorite) in the human body leading to hypocalcaemia (Pettifor et al. 1989; Fordyce 2011;Khairnar et al. 2015; Singh et al. 2018).
In water, it occurs predominantly as fluoride ion (F-),and its main source is minerals containing fluorine i.e.,fluorite (CaF2), cryolite (Na3AlF6), fluorapatite [Ca5(-PO4)3F], and rock phosphate. These minerals are widely used in the glass industry (Deng et al. 2018), as an ingredient of insecticides (Podder et al. 2012), as well as in the future they could be used in biomedicine as bioimaging agent (Milojkov et al. 2020). In the Earth’s crust under high-temperature conditions, fluorine is more mobile (Ali et al. 2018). The process controlling the presence of fluorine in the environment is chemical weathering of minerals containing this element (natural origin) and anthropogenic activities i.e., application of phosphate fertilizers, dust fall in phosphate industrial area, and fluorine released from coal-burning (Pauwels et al. 2015; Dehbandi et al. 2017;Hong et al. 2018; Singh et al. 2018; Fuge 2019; Wang et al.2019). In groundwater, the occurrence of fluorine is often linked to the volcanic rocks in crystalline basement aquifers (Ozsvath 2006). It can co-occur with arsenic (Alarco´n-Herrera 2013; Alarco´n-Herrera et al. 2020), and its concentration is controlled by alkalinity, and concentrations of calcium and bicarbonate (Saxena and Ahmed 2001; Ali et al. 2016, 2018). The main mineral source controlling aqueous fluoride geochemistry is the solubility of fluorite(Apambire et al. 1997; Edmunds and Smedley 2004).Moreover, much research indicated a negative correlation between Ca and F ions concentration. Furthermore, in waters with a low concentration of calcium ions, there is a strong positive correlation between sodium and fluorine ions. The high concentration of sodium ions increases the solubility of fluorite through the base exchange (Apambire et al. 1997).
The concentration of fluoride can be also sometimes connected with the depth of the borehole. In research published by Nair et al. (1984), a general tendency shows the positive trend between F-concentration and depth in Kenya—the deeper the fluoride concentrations increase and are in the range of 1–5 mg/L. Guo et al. (2012) presented that the depth of the wells (up to 30 m) has no impact on the fluoride amount (0.3–2.57 mg/L) found in the Shahai (Inner Mongolia) groundwater. As well, Ali et al. (2018, 2019b) showed that the variability in fluoride concentration in Western Haryana (up to 19 mg/L), Sindh,and Punjab in Pakistan (0.1–3.9 mg/L) can be explained itself in the depth of the well with a negative correlation of - 0.2. On the other hand, Abdurahman and Zewdie(2018) presented the inversed relationship between Fconcentration (0.65–4.10 mg/L) and borehole depth(25–250 m).
Fluorine is one of the causes of natural groundwater pollution around the world i.e. in Sweden (Berger et al.2016a, b), Brazil (Martins et al. 2018), India (Reddy et al.2010; Mondal et al. 2014; Pauwels et al. 2015; Kumar et al.2017, 2018; Raju 2017; Raj and Shaji 2017; Ali et al.2018, 2019a; Gupta and Misra 2018; Laxmankumar et al.2019; Kanagaraj and Elango 2019; Yadav et al. 2019a, b),Ghana (Craig et al. 2018; Zango et al. 2019), China (Hu et al. 2013; Zhang et al. 2017; Wu et al. 2018; Su et al.2019), Pakistan (Rafique et al. 2015; Rashid et al. 2018; Ali et al. 2019b), Iran (Dehbandi et al. 2018; Enalou et al.2018; Naderi et al. 2020), South Korea (Chae et al. 2007).In poor and developing countries, where there is a hardship with access to pure drinking water and the problem of fluorine groundwater pollution has also been encountered,e.g., in Nigeria (Emenike et al. 2018), Namibia (Sracek et al. 2015; Abiye et al. 2018;), Kenya (Gaciri and Davies 1993; Zevenbergen et al. 1996; Olaka et al. 2016), Ethiopia(Tekle-Haimanot et al. 2006; Rango et al.2010, 2012, 2014, 2017; Kravchenko et al. 2014; Colombani et al. 2018), and Malawi (Msonda et al. 2007). To summarise, the general mechanism controlling the high concentration of F-ions in groundwater has geogenic sources that are: long residence-time favouring water–rock interaction processes, evaporation, hydrogeochemical type changes during water flow (from Ca-HCO3to Na-HCO3),weathering or dissolution of F-bearing minerals, geological setting i.e., presence of crystalline basement rocks within the wells or salt-rich geological formations, sorption and ion-exchange processes. The chemical composition of groundwater especially characterised by high concentrations of HCO3-and Na+and alkaline pH play the most primary role for fluoride releasement to the groundwater.Other factors, usually negligible, that affect the fluoride concentrations are anthropogenic i.e., agricultural activities(groundwater is enriched in F-ions due to the leaching from fertilizers) or mining activity.
This work is focused on the prevalence of fluoride in groundwater from Turkana County, Kenya. In the case of the Kenyan groundwater, the major considerable source of its F-enrichment is a geogenic source and the processes responsible for that phenomena are discussed in this paper.The research is based on the archive’s data obtained during looking for water that can serve as a source of drinking water for local communities. The objective is to identify wells with high fluoride concentrations and to determine processes responsible for the fluoride groundwater enrichment.
2 Local geology, material, and methods
2.1 Study area
Turkana is the largest county situated in the north-western part of Kenya. It covers 77,000 km2and constitutes about 43% of the total area of the Rift Valley Province in Kenya.This county includes the endorheic and alkaline (pH = 9.2)Turkana Lake (Fig. 1a) which forms a natural eastern boundary of this region. Turkana is split into 6 districts:Turkana North, Turkana West, Turkana Central, Loima,Turkana East and Turkana South. The study area has semiarid climate conditions based on Ko¨ppen classification(Fig. 1b, c). The average annual precipitation and temperature in the area are 210 mm and 29 °C, respectively. It is the poorest region in Kenya with frequent drought and famine problems. One of the major problems besides famines that people face out are droughts that occur every 2–4 years. It implies the water sources dry out, the number of sites with available water decreases, and the epidemics of water-borne diseases among people and animals break out (Oduor et al. 2012). In East Africa, during droughts, the recharge of the groundwater aquifers from the rainfall can be reduced even by 70% compared to the wet season, therefore the fluctuations in the groundwater table and changes in water quality are highly possible(Ferrer et al. 2019; Ochungo et al. 2020).
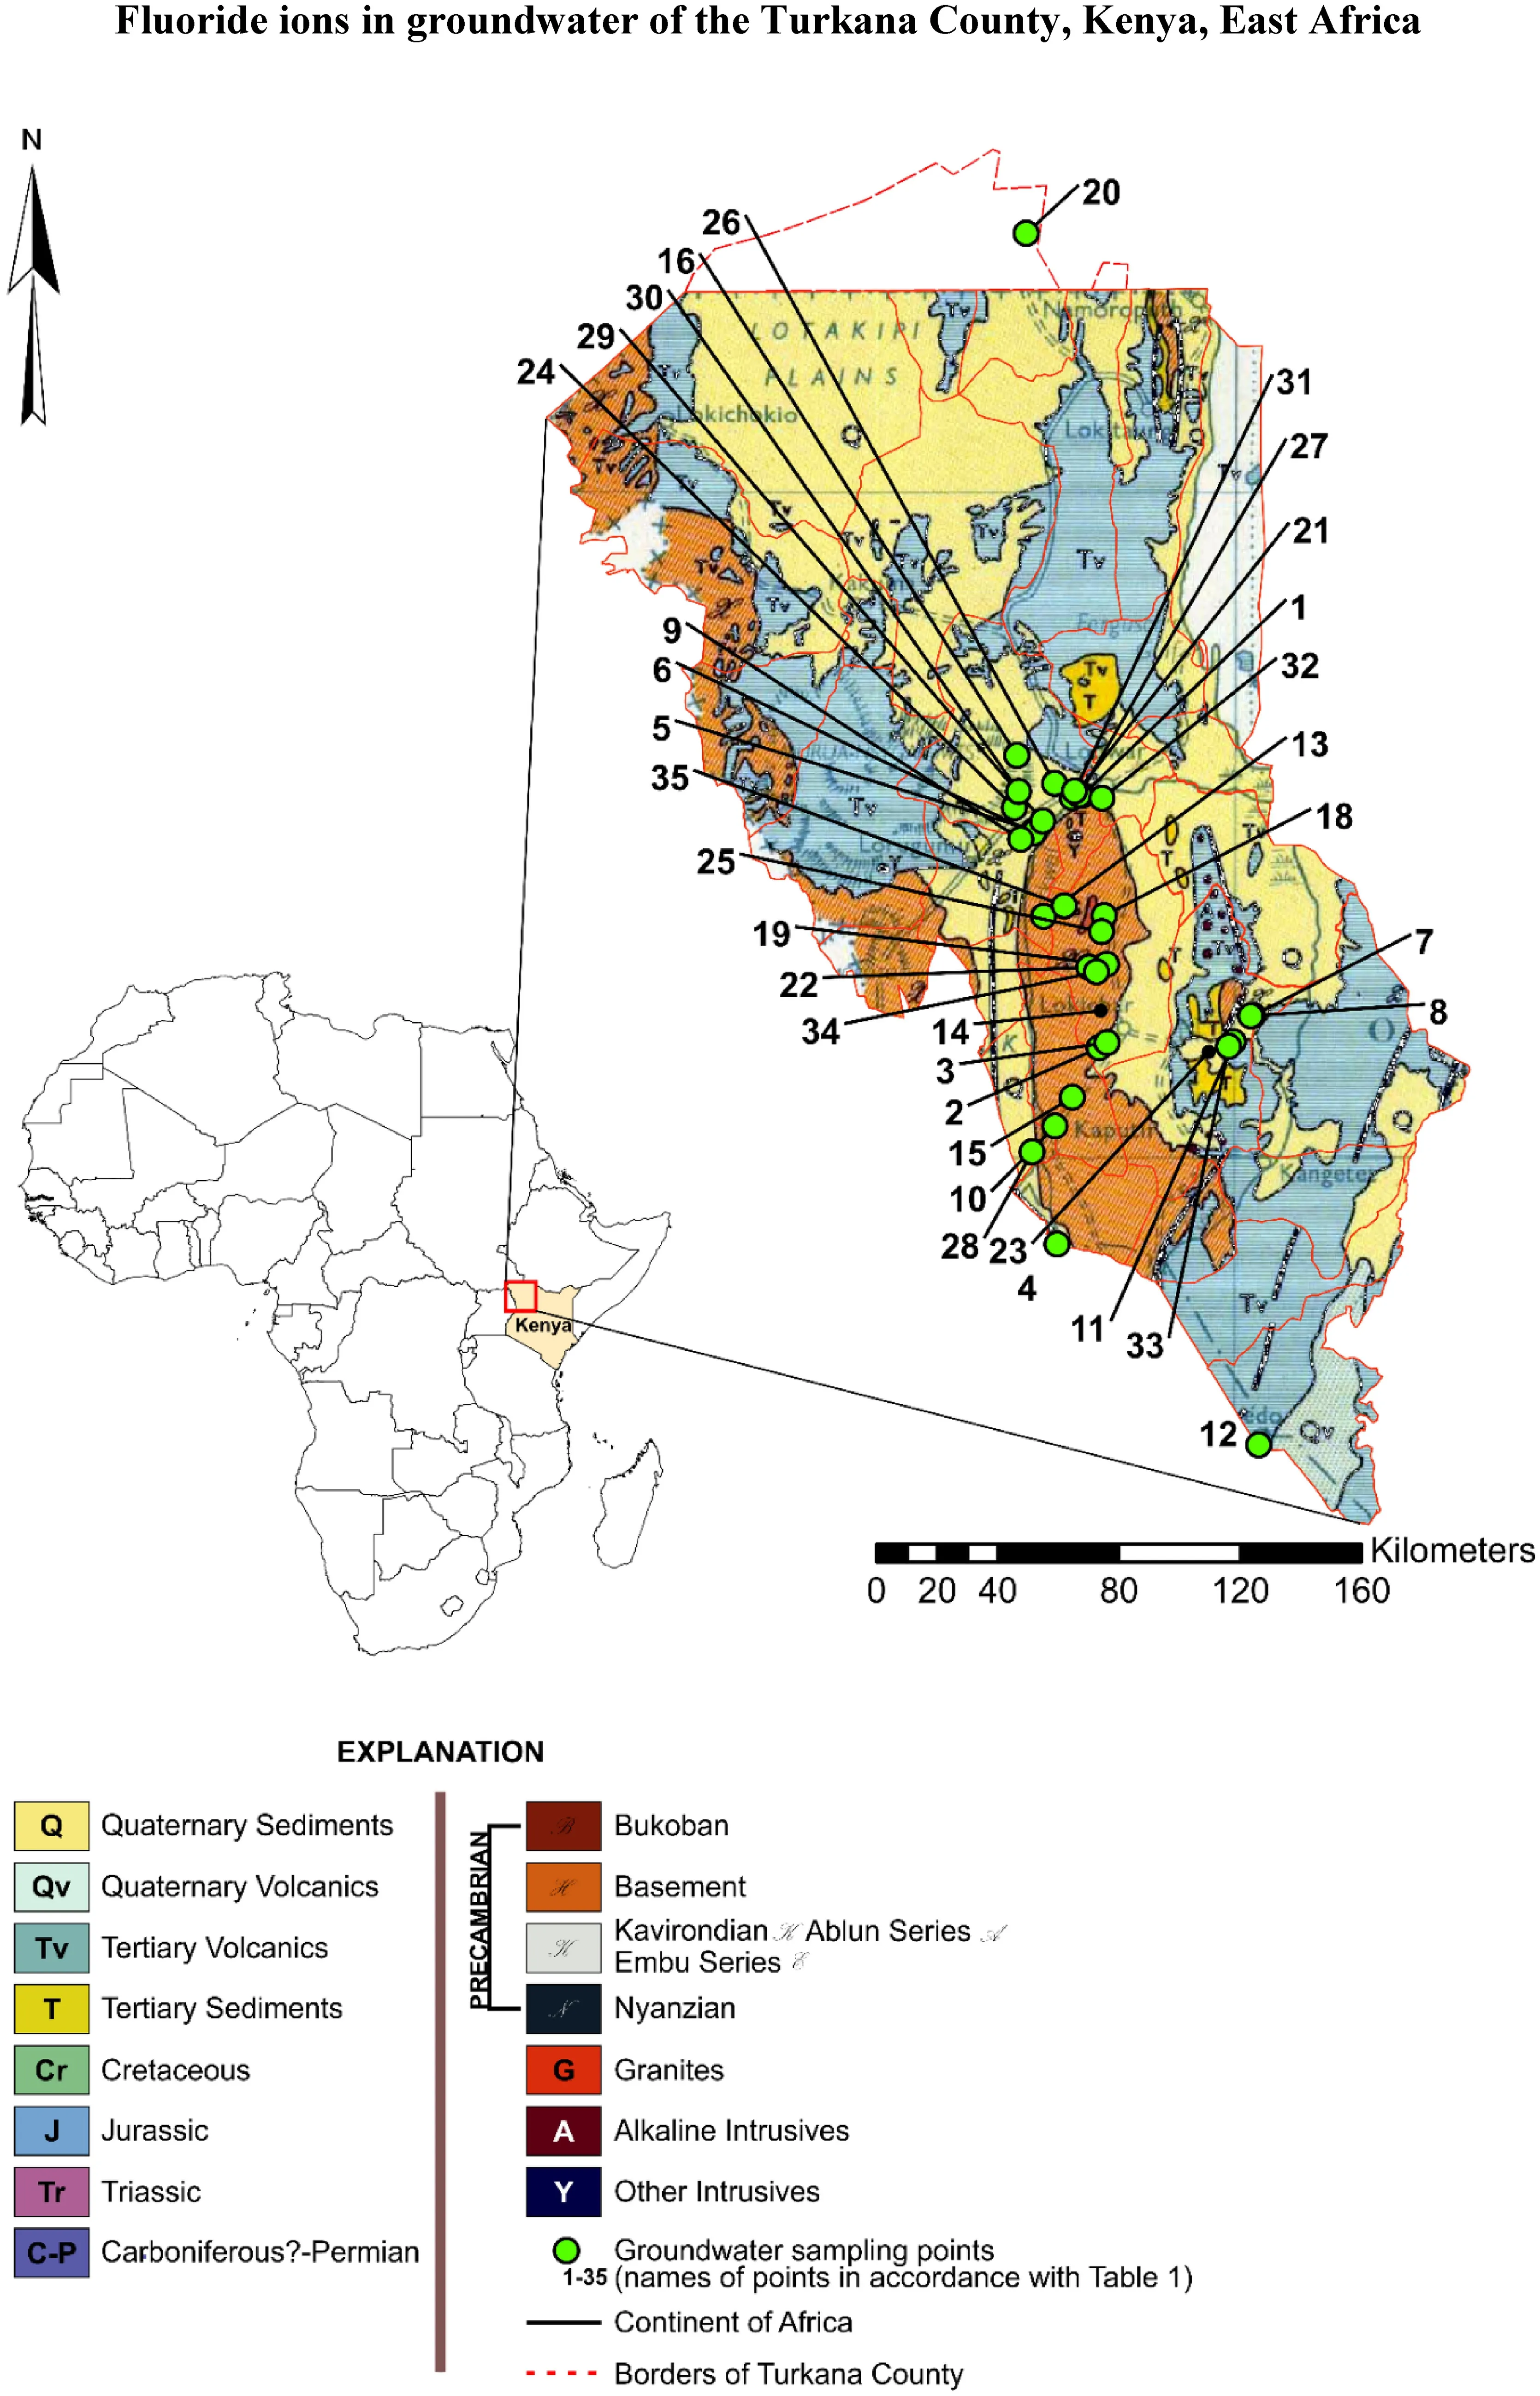
Fig. 1 Geology of Turkana County (Chief Geologist Mines and Geological Department 1962) and sampling points
2.2 Geology
The geological setting of the study area is lithologically and tectonically variable. The oldest formations that can be observed in this area are metamorphized rocks of the Precambrian crystalline basement (Walsh and Dodson 1969). After deposition and deformation of the crystalline basement rocks, there was a stratigraphic gap. Precambrian rocks are covered with unconformable Cretaceous calcareous sedimentary rocks the so-called Turkana Grits,Paleogene-Neogene sedimentary, volcanic sediments, as well as the Quaternary sediments.
It is believed that the crystalline basement was formed from the sequence of the metamorphized sediments, volcanic rocks, and mafic and ultramafic intrusions. These sediments during orogenesis undergone successive compression, regional metamorphism, and injection of granites.As a result, there are gneisses, granulites, migmatites,quartzites and, marbles (Walsh and Dodson 1969). The crystalline basement rocks are observed in most of the geological profiles of the wells studied in this work. There are represented by gneisses with different mineral composition.
The Turkana Grits were firstly dated to the Jurassic age,but subsequent studies suggested periods from Cretaceous to Miocene (Dodson 1971). In studies from the 1960s,including the geological map presented in this work(Fig. 2), Miocene dating was adopted (Chief Geologist Mines and Geological Department 1962). Nowadays, due to the discoveries of dinosaur fossils (Handford 1987), they are now recognized as the Upper Cretaceous deposits. In the vast majority of the study area, the Turkana Grits occur as the calcareous, granular sandstones. These sediments occur in the north–west from the Tertiary volcanites (Tv)—on a map marked as Tertiary sediments (T), (Fig. 1).
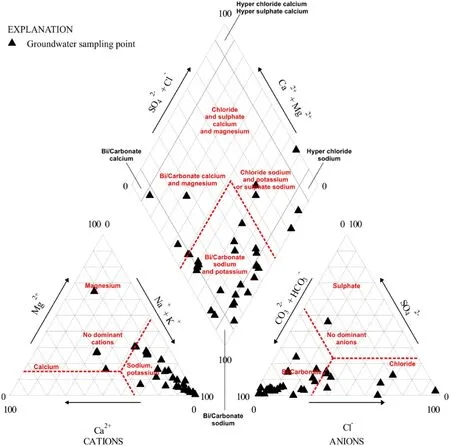
Fig. 2 Hydrogeochemical characteristics of groundwater using the Piper Diagram
The Tertiary series of volcanic rocks cover the upper Cretaceous sediments. They form the chain of hills running from the north to south in the eastern part of the study area and on the north from Lodwar city. They are represented by fine crystalline basalts.
The Tertiary sediments include sandstones and shales of fluvial and limnic origin and are dated from the Paleogene to the middle Miocene. They fill the Paleogene Lokichar Basin covering the central and south–eastern part of the area, of the N–S orientation, 60 km long and 30 km wide(Tiercelin et al. 2004).
2.3 Hydrogeology
From the hydrogeological point of view, five-rock formations are essential for water supply in the Turkana Lake area. In the well profiles, there are alluvial sediments,Turkana Grits, and crystalline basement rocks. Others rocks are olivine basalts and phonolites linked to the Tertiary volcanic activity.
Crystalline basement rocks are characterised by a simple weathering profile. Along with the depth, the degree of weathering profile decreases to unweathered and low permeability rock. Groundwater, if found, usually occurs in the weathering zone close to its base, in local fissure systems and sediments above the basement rock. A good indicator of the likely occurrence of groundwater is the presence of a deep weathering zone and low clay content(Turkana Drilling Consortium 2008).
Lava’s flow such as basalts and phonolites very rarely have significant primary porosity. Water usually can be found in the fissure zones, crevices and pyroclastic layers at the contact of different lava flows within the same lithology and so-called Old Land Surfaces. The thickness of such water-bearing horizons is generally limited to few metres(Turkana Drilling Consortium 2010).
The floodplains of the permanent and seasonal rivers are perspective areas for groundwater exploration. Often dried riverbeds are covered with water-bearing sandy alluvium.For Turkana nomads, shallow dug wells in the riverbeds are the most important, basic source of water. The Lokichar Basin located in the central and south–eastern part of the study area is often characterised as having a low potential for finding groundwater, especially with the growing distance from riverbeds (Turkana Drilling Consortium 2008).
3 Source of data
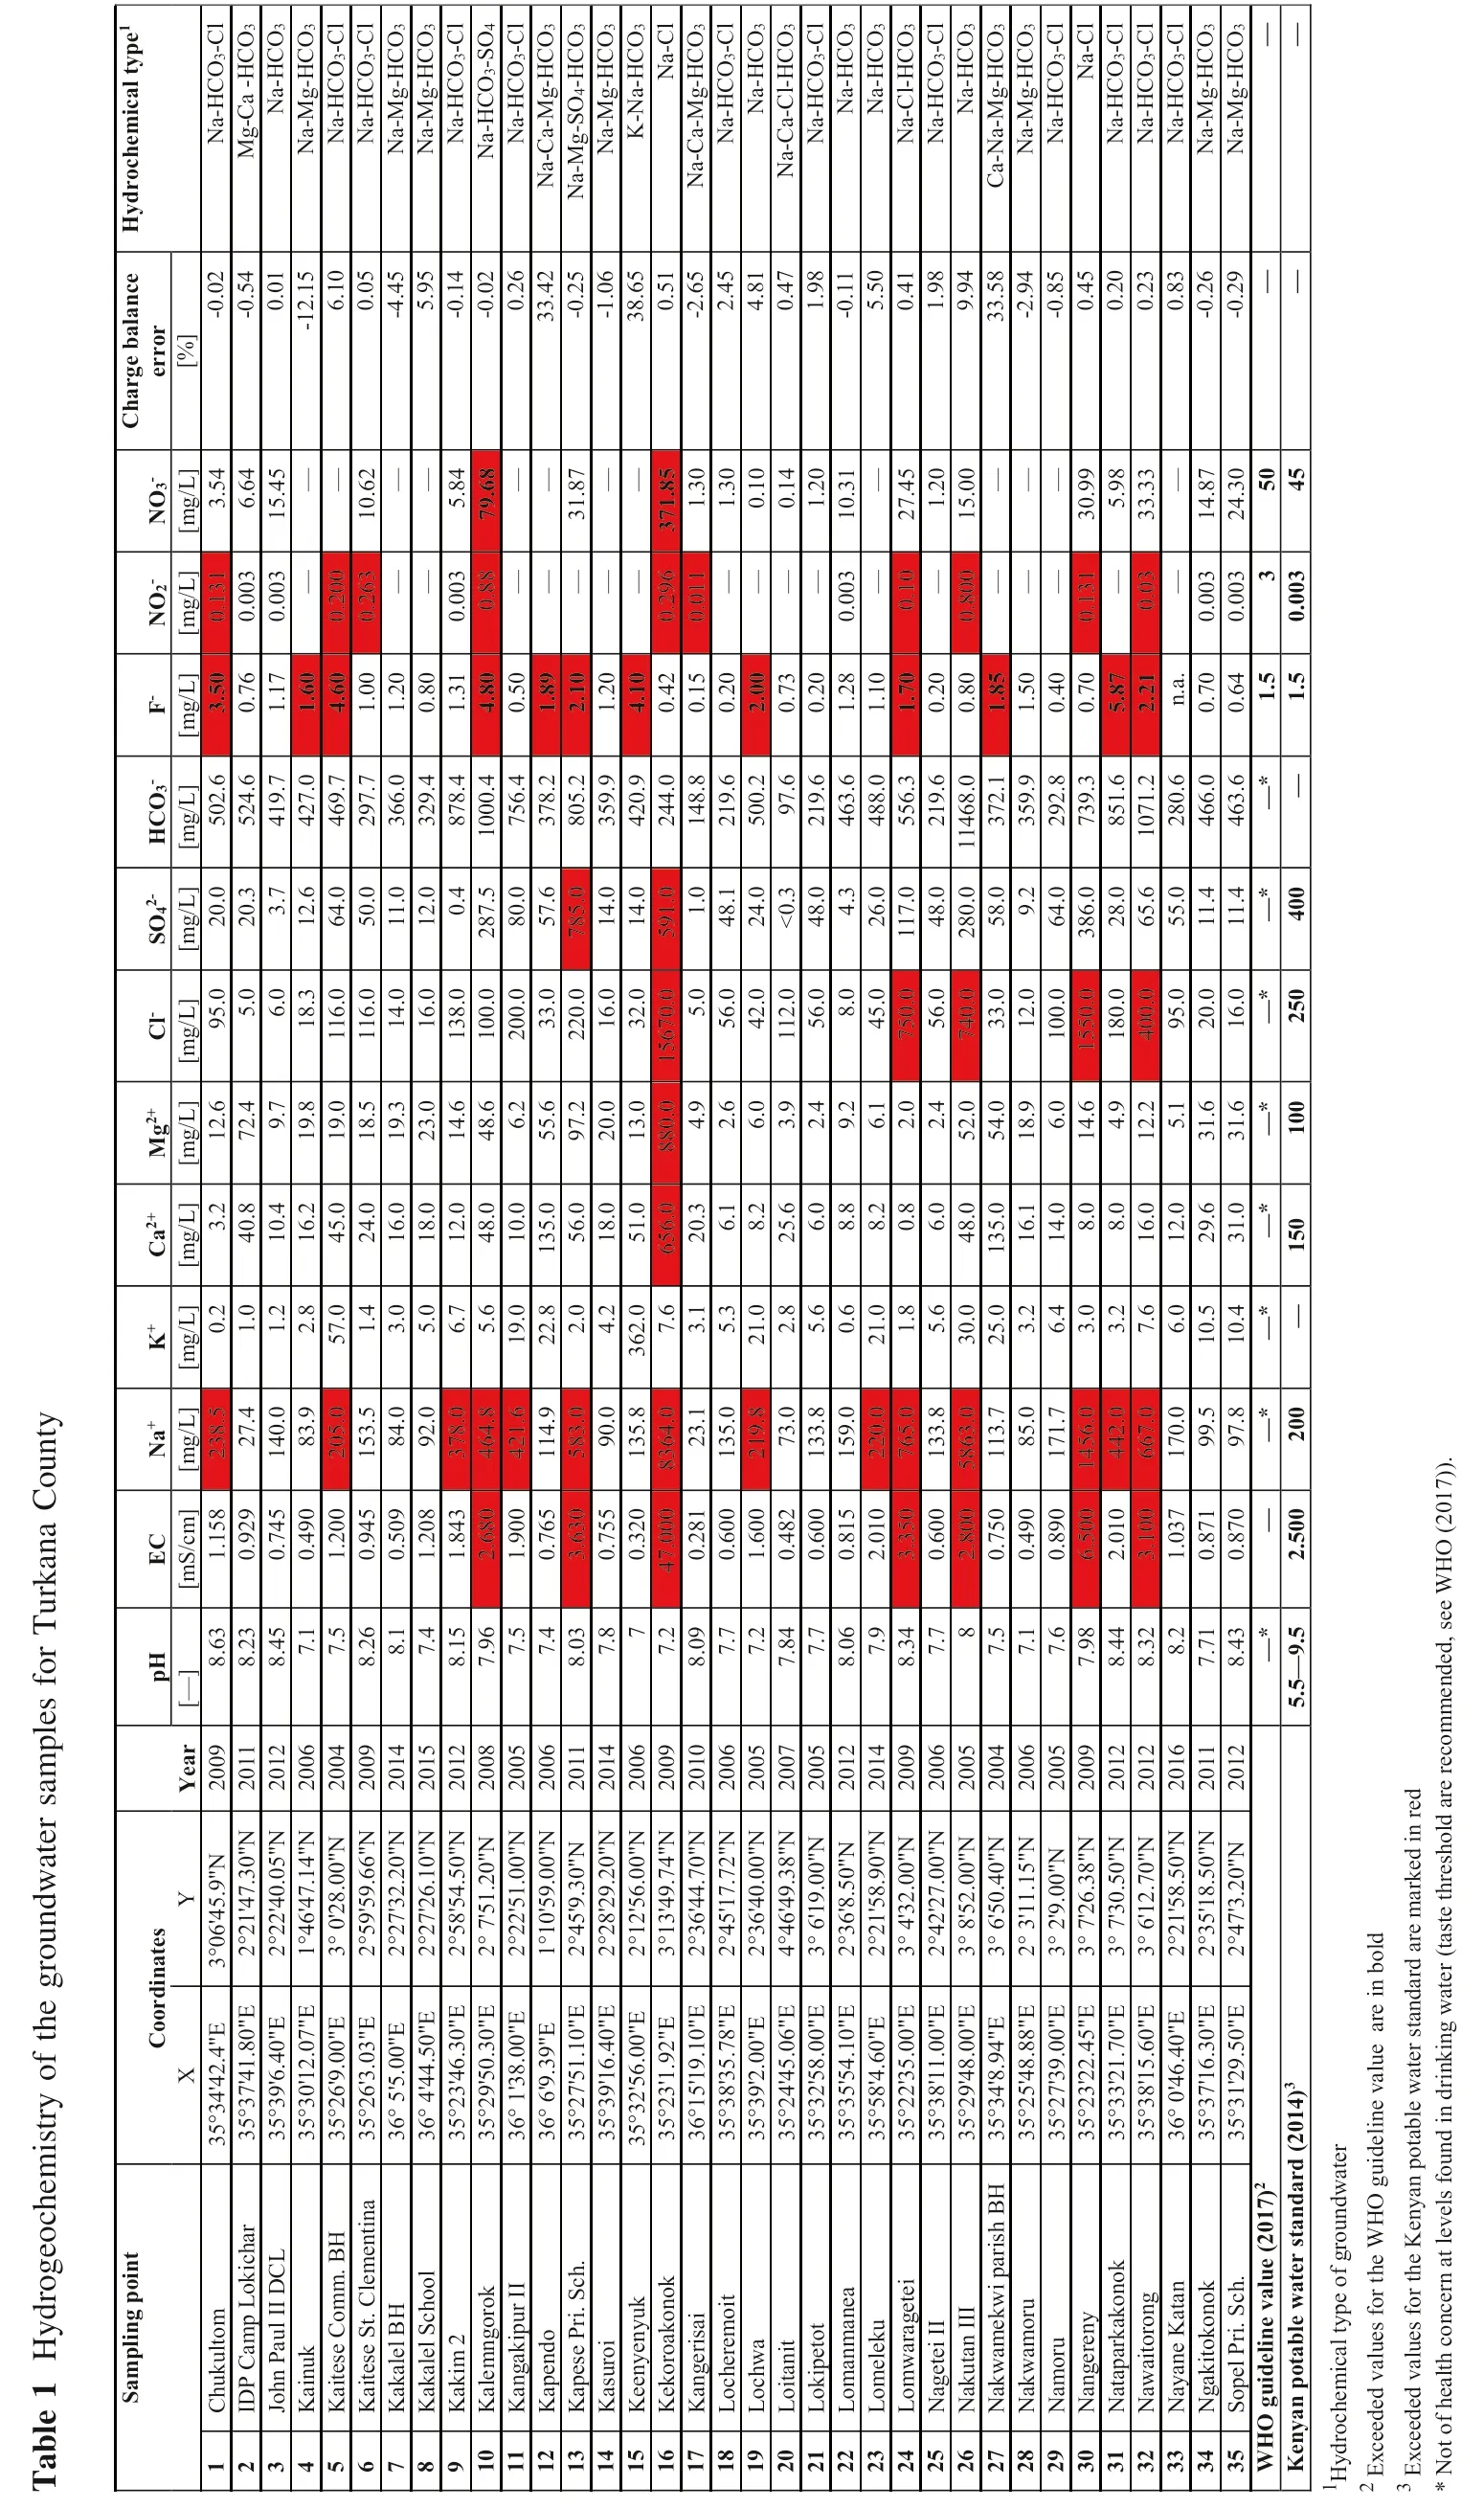
This study is based on the archival results of physicochemical analyses performed for 35 points scattered throughout Turkana County from which groundwater was collected in the years 2004–2016. The water-bearing rocks were variable and included volcanic, sedimentary, and metamorphic rocks. The depth of the wells was from 17 to 80 m below surface level and two water horizons were recognized. The data used for the research purposes are archived and they were accessed from the Government Chemist’s Department of the Republic of Kenya (https://www.govchemists.go.ke/). The reports of the chemical analyses did not include the methods of analysis therefore the results of chemical analyses were checked by calculation of the charge balance error. All information about wells including the name of the sampling point, coordinates, year, and the results of chemical analysis are given in Table 1.
4 Results
4.1 Water chemistry
4.1.1 Hydrogeochemical facies
The hydrogeochemical characteristics including chemical analyses, calculating the charge balance, the mineralization based on the major ions (Ca2+, Mg2+, Na+, K+, Cl-,HCO3- and SO42-) and denomination of the hydrochemical type of water.
y Count na ka Tur for e s mpl sa r te oundwa gr the of ry s t m i he oc oge 1 Hydr e Tabl pH E C Na+K+Ca2+Mg2+C l-SO4 2-HCO3-F-NO2-NO3-Ch a r g e b a la n c e error Hy d r o c h e m i c a l ty p e1[—][mS 1./c1 5 m][mg/L][mg /L][mg /L][mg1 2/L][mg /L][mg2 0/L][mg5 0/L][mg3./L][mg/L][mg3./L][%]8.6 3 8 9500 5983 0 0 5 0 50 2 32 70.8.5 0.2028 3.2.6 9 55..000.0 2.667077044 5 0 0.1 3 133 5 4-0.0 24 Na-HCO3-C l 8.2 3 0.9 2.40 1.4 0.8 7 29..47 2 03..37 5 2 4.0.7 6 0.0 0 6.6 45-00..50 1 Mg -Ca-HCO3 8.4 515 0.7 4 1 48 35.1.1 0.4 6.4 1 9.1.1 7 0.0 0 1 5.4 Na-HCO3 7.0.4 9.905 2.1 6.2 1 9.8 1 86..300 1 2.6 4 2 7.1.6 0———-1 2.1 5 Na-Mg-HCO3 7.1.2 0 2 0 5 71..040076 4 5.0 1 9.0 1 1 6 4.0 4 6 9.4.6 0 0.2 0 03 6.1 0 Na-HCO3-C l 8.2 614 0.9 4 1 58 4 3.2 4.0 1 8.5 1 11 4 6.5 0.0 2 9 7.1.0 0 0.2 6 1 0.6 2 0.0 55 Na-HCO3-C l 8.0.5 0.0 3.1 6.0 1 9.3.0 1 1.0 3 6 6.1.2 0————-45..49 542 Na-Mg-HCO3 7.1.2 0 9 2 8..00 8 5.1 8.0 2 3.0 1 68..0000 1 20..045 3 2 9.0.8 0 Na-Mg-HCO3 8.1 5 1.8 4 3 7 6.1 2.0 1 4.6 1 3 8 7 0 0 6.8.1.3 1 0.0 0 8 8 3 5.8 4 8-0.1 Na-HCO3-C l 7.9 654 2.6 8 4 6 4.5.4 8.0 4 86..62 1 0 0.2 88 0 7.1 07 5.4422990 8 62 4.8 0 0.7 9.6-00..02 62565 Na-HCO3-SO4 7.1.9 0 4 2 1.69 1 9.0 1 05..00 2 03 3 0.0..0 0.5 0———————Na-HCO3-C l 7.0.7 6 1 1 4.2 22..80 206 13 1 35 6 5 5.6.00 5 7 5..60 3 7 8.1.8 9 3 3.4 Na-Ca-Mg -HCO3 8.0 3872 3.6 3 5 89 05.3.0.0 9 7.2 2 21 6 7 81 4 8 0 5.2.1 0 3 1.8 7-0.2 Na -Mg-S O4-HCO3 7.0.7 5.08 4.1 8.0 2 0.0.0.0 3 5 9.1.2 0——-1.0 Na-Mg-HCO3 0.3 20 0 10 0 20500 0 0 000 0 00 710 1 36 4 3 6 2.5 16..00 1 30..00960942104 3 20..000 1 41..000 4 2 0.4.1 0 3 80..65 15 K-Na -HCO3 7.4 70..02 8 8 3.0 7.6 52 06.8 8 1 5 6 7 5 9 2 4 4.0.4 2 0.2 9 6 1 3 7 1.8 5 Na-C l 8.0 972 2 35..10 8 3..312 4.5.1.1 4 8.0.1 5 0.0 1 1.3 0-22..64 5 Na -Ca-Mg-HCO3 7.0.6 0 1 3 5.2.5 6.0 4 8.1 2 1 9.0.2 0————1.3 0 Na -HCO3-C l 7.1.6 0 2 17 33.9.2 12..0866 8.6.4 22..00 2 4.0 5 09 79.0.2.0 0 0.1 0 4.8 1 Na-HCO3 7.8 47 0.4 8.080 2 56..608280 3.1 15 68.<0.3.66603 6 0.7 3 0.1 4 0.4 7 Na -Ca-C l-HCO3 7.0.6 0 1 3 5.2..00 4 84..03 2 1 0.2 0 1.2 01 1.9 81 Na -HCO3-C l 8.0 69 0.8 1 1 5 9.0.8.9.4 6 3.1.2 8 0.0 0 3 1 0.3-05..15 0 Na-HCO3 7.2.0 1 2 2 0.0 0 2 11..086 8.6.4 50..00 2 67..00 4 8 8.1.1 0——Na-HCO3 8.3 478516 3.3 5 7 6 5.0.2.7 55 60.1 14 80.5 5 6.1.7 0 0.1 0 2 71..42 00 5 0.4 1 Na-C l-HCO3 7.0.6 0 1 3 6 33.3.8 5.6.2..00.00 2 1 9.0.2 0—1.9 8 Na -HCO3-C l 2.8 0 5 81 18 51..07 3 0.0 4 85..00 5 2.0 7 43 3 2 85 89.1 1 4 6 8.01 98 36 0.8 0 0.8 0 0 1 5.0 9.9 4845 Na-HCO3 7.0.7 5 2 53..0240260 1 31 6 5 4.0.0.02 3 7 2.1.8 5——————3 3.5 Ca -Na-Mg-HCO3 7.0.4 9.07.1 1 86..90 1 20..00 3 5 9.1.5 0-2.9 Na-Mg-HCO3 7.0.8 9 1 7 5 6 2.6.1 48..000 1 05 00.6 46..00 2 9 2.0.4 0-00..84 5 Na -HCO3-C l 7.9 8 6.5 0 1 44 4.00 0 3.1 44..69 1 51 8.000 3 82 8 7 3 9.0.7 0 0.1 3 1 3 05..99 83 9 Na -CC l l 8.4 4 2.0 1 3.8..0 8 57 1 0.1.5.8 7—0.2 0 Na-HCO3-8.3 22 3.1 0 6 6 7.7.1 6.0 1 25..21 4 09 5 0.6 5.6 1 02 8.2606 2.2 1a.0.0 3 3 3.3 0.2 3 Na-HCO3-C l 8.1.0 3 1 79 9 0.0 6.1 2.0.0 5 5.0 n.——0.8 369 Na-HCO3-C l 7.7 1 0.8 7.5 1 0.5 2 9.6 3 1.6 2 0.0 1 1.4 4 6 6.0.7 0 0.0 0 333 3 1 4.8 70-0.2 Na-Mg-HCO3 8.4 3 0.8 7 9 7.8 1 0.4 3 1.0 3 1.6 1 6.0 1 1.4 4 6 3.0.6 45 5 0.0 0 2 4.35 0-0.2 Na -Mg -HCO3—*5——*0—*—*—*0—*0—*0—*1.————5.5—9.2.5 0 0 2 0—1 5 0 1 0 2 5 4 0—1.0.0 0 4 5).7)0 1(2 e WHO s e,ed n d mme a r c o Ye 0 9 1 1 1 2 0 6 0 4 0 9 1 4 1 5 1 2 0 8 0 5 0 6 1 1 1 4 0 6 0 9 1 0 0 6 0 5 0 7 0 5 1 2 1 4 0 9 0 6 0 5 0 4 0 6 0 5 0 9 1 2 1 2 1 6 1 1 1 2 2 0 2 0 2 0 2 0 2 0 2 0 2 0 2 0 2 0 2 0 2 0 2 0 2 0 2 0 2 0 2 0 2 0 2 0 2 0 2 0 2 0 2 0 2 0 2 0 2 0 2 0 2 0 2 0 2 0 2 0 2 0 2 0 2 0 2 0 2 0 re e da r re d"N "N "N "N "N "N "N "N "N "N "N "N "N "N "N "N "N "N "N "N in o l N "N "N N "NN "N "N "N "N N "N "N "N N s h 9"3 0 0 5 1 4 0 06 6 2 0 1 0 5 0 2 00 0 0 0 0"2 0 0 0 7 4 7 0 7 2 0 0 3 8 0 00"9 0 0 00 0 0 0 4 0 1 5 0"3 8 5 0 7 05 0 5 0 0"e d 7.0.7.r e Y 5.9.2.6.4.1.1.9..3 9.6.9.4.7.0.9.9..5 8.2.7.2.8.0.8.1..0.2 6.'4'4'4 8.0.2.rk th'4'5'3'2'5'5'5'9'2'5'4'4'1'4'4'8'5'2'5'1'3 te s 2 2 4 60'2 5 9 2 7 2 7 5 87'5 2 2 1 0 4 5 2 8 1 2 1 3 3 6 4 5 3 6 4 66'1 3 6 2 14'3 4 28'5 6'5 3'1 2'9 7'2 7'3 6'1 2 1 3 5 4 7 e ma te 0 62 1 ld a r a s n a 3°2°2°1°3°2°2°2°2°2°2°1°2°2°2°3°2°2°2°4°3°2°2°3°2°3°3°2°3°3°3°3°2°2°2°b o (t rd r d i in te o r d a wa Co ea n E "E E "E EE "E "E "E"E "E "E"EE "E "E E "E "E "E E "E "E "E E "E "E "E "E "E"E "E "E a r s t 4"8 0 0"0 7 0"3"E E r 3 0 n g 1 0 4 0 2.1 0 7 8 0"1.0 6 0 0 1 0 0"0 0 0 0 0 0 4"8 8 0 0 4 5 7 0 6 0 5 0 e.0.4.0 0"5 03 0 0 0 9"0 02".9.0.6.9 4 03 0 te k i X 2..0 4.6.0.8..31.6.6.9.5.5.8.4.5.1.8.8.9.2.1.5.6.6.9.lu 4'4 7'4 9'6 0'1 6'9 6'3 5'5 4'4 3'4 9'5 1'3 6'9 7'5 9'1 2'5 3'1 5'1 8'3 9'2 4'4 2'5 5'5 8'4 2'3 8'1 9'4 4'8 5'4 7'3 3'2 3'2 8'1 0'4 7'1 1'2 in 3 v a wa d r°3°3°3°3°2°2°°°2°2°°°2°3°2°1°3°3°2°3°3°5°2°3°2°3°2°2°2°3°3°°3°3 4)ee 3 53 5 3 5 3 5 3 5 3 5 3 6 3 6 3 5 3 5 3 6 3 6 3 5 3 5°3 3 53 5 3 6 3 5 3 5 3 5 3 5 3 5 3 5 3 5 3 5 3 5 3 5 3 5 3 5 3 5 3 5 3 5 3 6 3 5 3 5 0 1 in b l in(2 d r e l ta rd te id u n p o g u 2 d a fo a n wa a ls 7)n d BH n y a r in n t s h a n 0 1 v e c h BH r i s t o u Ke le t (2 in g r k i DCL e WHO ea t.me h.p a er p o o k te th th Lo le o l i mm i I I lu S c o k o f n n rr o n g a I I ro e r k tao kh.wa i.Co m I h o o n n g n e te. C ru it a i S c p e kw fo fo mp o n u l ip e e 2g o n c S t oP r to u r u k n y I I ak I I emo ya k a np enma i.t t y l i is Kao nS cv a k ug e mmn e s ra in b l l P a e s Ca ee u l l l BH a k n d i to i n rko r co mp i t le u k le me se roy e r o e r e r mo le wa e s te ta r ue n e r it p a n eo k i t P r lu e l c a lu th ma i t S a me k a u k mwa in k a k i i t n g e s p e p e e n k o n g g e k u k wa kwa mo n g wa y a a k l ta le s u it ta id v a v a Ch IDPh n c h c h k i p e p o m i a l J o Ka Ka Ka Ka Ka Ka Ka Ka Ka Ka Ka Ke Ke Ka Lo Lo Lo Lo Lo Lo Lo Na Na Na Na Na Na Na Na Na Ng S og u a n h e e d e d he n y o c e d e d o f t 1234567891 0 1 1 1 2 1 3 1 4 1 5 1 6 1 7 1 8 1 9 2 0 2 1 2 2 2 3 2 4 2 5 2 6 2 7 2 8 2 9 3 0 3 1 3 2 3 3 3 4 3 5 WHO Ke d r ce ce 1Hy 2 Ex 3 Ex* No
The charge balance error was calculated for 35 points.For almost all samples charge balance error was acceptable (in range of ± 10%) except few ones (No. 4, 12, 15,and 27) possibly affected by the analytical methods used,physical parameters interfering with the measurements, and sampling method applied (Mika et al. 2018; Wa˛tor et al.2018, 2019; Rusiniak et al. 2020). Despite this, these samples were included in the statistical analysis and speciation modelling—a source of errors generated during sampling and laboratory instrumentation could not be verified based on the documentation and shortened chemical analysis reports gathered. Calculated mineralisation of the groundwater collected varies from 206.2 to 26,413 mg/L. The mineralization (M) is mainly controlled by the concentration of bicarbonates and sodium ions—there is a strong Pearson correlation between M and HCO3-(R = 0.994) and Na+(R = 0.998). Furthermore, there was observed a clear effect of Cl-and SO42-concentrations on the groundwater mineralization (R = 0.714 and R = 0.372,respectively). From these calculations, two sample outliers(saline water) which affected the calculations of correlation coefficient were excluded (No. 16 and 30). The analysed all water samples can be classified in a range from fresh,brackish to saline water based on mineralization parameter.As the Piper Diagram shows, groundwater types in Turkana County (Fig. 2) are mainly Na + K-HCO3, Ca-Mg-HCO3, Na + K-Cl, or Na-SO4.
4.1.2 Quality of the Turkana County groundwater from viewpoint of human consumption
To assess the suitability of groundwater collected across Turkana County for drinking purposes, current guidelines and legal regulations were used. The guidelines for drinking water quality published by the World Health Organization (2017) were adopted as the main reference.Additionally, the Kenyan Potable water standard (2014)was used in this assessment.
Among the chemical parameters included in this study,the guideline of WHO specify the maximum allowable concentration values only for fluoride, nitrite, and nitrate.The values specified for these indices are justified by proven real or potentially toxic effects on human health(WHO 2017). In the Kenyan Potable water standards and the EU regulations, there are already established maximum permissible levels for the following physicochemical parameters: magnesium, sodium, chlorides, sulphates, pH value, electrical conductivity, and also for calcium in the case of Kenyan regulations (Table 1).
Within the analysed parameters, groundwater samples from 17 wells met the requirements established in the guideline and regulations mentioned with the simultaneous absence of data for nitrite and nitrate concentration in 10 samples (NO2-) and 9 samples (NO3-). The concentration of the fluoride was in the range of 0.15–5.87 mg/L. In 12 samples the concentration of F-exceeded the WHO guideline value and the maximum permissible level contained in the Kenyan legislation of 1.5 mg/L. In 22 samples where the F-concentration was below or equal to 1.5 mg/L, the calculated mean and median concentration is 0.77 and 0.75 mg/L, respectively. For higher concentrations the statistical parameters are 3.02 mg/L (mean) and 2.16 mg/L(median). Considering the results for the whole region, the mean concentration of 1.56 mg/L exceeds the guideline value of 1.5 mg/L, while the median suggests that the water is suitable for drinking purposes (1.19 mg/L). For the Nayane Katan sample, the fluoride concentration was not available.
The regional distribution of the fluoride ion showed no dependence on the borehole depth like in the publication of Abdurahman and Zewdie (2018). Only when the data is divided into subgroups based on the water-bearing formations (sediments, basement, and volcanic rocks), fluoride tend to show a negative correlation with depth in sedimentary rocks (Table 2). For basement and volcanic rocks,there was not found a significant correlation between Fconcentration and the borehole depth.

Table 2 The correlation coefficient between F-and depth in aquifer formations
The fluoride constitutes the main problem in analysed groundwater due to its fairly high concentrations. Concentrations are often much higher than the guideline value led to skeletal fluorosis which is a problem met in Turkana County (Fig. 3).

Fig.3 Dental fluorosis in a child(photog.Piotr Stopa)
Analysing subsequent parameters and it can be stated that the groundwater from the Turkana County did not meet the Kenyan potable water standard requirements for electrical conductivity (EC) (7 samples), sodium (14 samples), calcium (1 sample), magnesium (1 sample),chloride (5 samples) and sulphate concentrations (2 samples). Nitrite concentrations did not fulfil the regulations for groundwater collected from 10 wells, as well as the nitrate concentrations, exceeded the WHO guideline value and KPWS maximum permissible levels in 2 cases. The presence of nitrogen species in the groundwater seems to be rather linked to anthropogenic and not to geogenic sources and can be caused by cattle breeding and insufficient latrine isolation. Especially relatively high concentration of NO3-found under oxidizing conditions may be a result of water recharge with anthropogenic contaminants.
4.2 Speciation calculations
The hydrogeochemical modelling based on thermodynamic calculations is a common method for evaluation of water–rock interactions and water treatment processes (Appelo and Postma 2005;Tomaszewska et al.2018)The results of chemical analyses were used for the calculation of speciation.Hydrogeochemical modelling was performed with PHREEQC 3.5 software(Parkhurst and Appelo 1999).Input data for initial solutions were pH,temperature,redox conditions(pe/ion pares),Na+,K+,Ca2+,Mg2+,HCO3-,SO42-,Cl-,NO2-,NO3-,F-.To evaluate the chemical equilibrium state between solid phases and aqueous solution the saturation indices were calculated for each mineral phase of interest(Parkhurst and Appelo 1999).Because chemical analyses and determination of temperature adjusted equilibrium constants KTare more or less biased with some error there is a widely adopted rule that the thermodynamic equilibrium between solution and concerned minerals phase is reached when the SI value is in the range of±5% lg KT(Dobrzyn´ski 2006;Tomaszewska et al.2017;Sekuła et al.2020).
The redox conditions play an important role in the formation of the chemical composition of groundwater(Appelo and Postma 2005;Dobrzyn´ski et al.2018;Wa˛tor et al.2020).Thus,due to the lack of information about redox potential value(EH),the nitrogen species were used to determine the redox conditions by the calculation of electron activity(pe)using the N(V)/N(III)redox couple.The groundwater samples exhibit very similar redox conditions—pe values are in the range of 7.16–8.27.In the case of the lack of data for NO2-and NO3-concentrations,the pe value for the rest of the samples was calculated as a mean from the pe values computed for available redox species(NO3-/NO2-)due to the normal distribution of this parameter.
Saturation indices(SI)were calculated and plotted for selected minerals such as fluorite(CaF2),anhydrite(CaSO4),gypsum(CaSO4∙2H2O),and calcite(CaCO3).Groundwater collected from all wells was undersaturated concerning anhydrite and gypsum despite a relatively high concentration of sulphate in several samples(Figs.4,5).
All samples showed very similar saturation indices for both phases.Groundwater undersaturated concerning sulphate minerals is capable to dissolve these phases assuming they are present in the rock matrix.Consequently,there can be precipitation of carbonates due to the common ion effect.It can be a reason for the relatively low concentration of HCO3-in samples with high SO42-(Karegi et al.2018).
Undersaturation with respect to calcite(Fig.6)is found in 11 samples with the simultaneous low concentration of calcium(mean concentration of calcium for these points is 11.54 mg/L,medium 10.0 mg/L,minimum 0.8,and maximum 25.60 mg/L).The concentration of bicarbonates was 361.7 mg/L with a minimum value of 97.6 and a maximum of 756.4 mg/L.Under equilibrium state,there are 17 samples where the concentration of Ca was in the range from 3.2 to 656 mg/L,mean value of 70.1 mg/L,and median 18.0 mg/L.Also,the mean bicarbonate concentration is 429.2 mg/L,with a minimum of 148.8 mg/L and a maximum of 878.4 mg/L.There are 7 samples supersaturated concerning calcite and they are characterised by significantly higher concentrations of bicarbonate(mean value of 2312 mg/L,medium 851.6 mg/L,minimum 463.6 mg/L,and maximum value of 11468 mg/L).
The principal mineral of interest is fluorite and 6 samples are at equilibrium with this phase.The mean concentration of fluoride ion for these samples is relatively high and equals 3.85 mg/L,median 4.35 mg/L.The minimum value of 1.85 mg/L exceeded the WHO and Kenyan maximum permissible level for drinking water.The maximum value is almost 4 times higher than the recommended MPL, reaching 5.87 mg/L. The rest of the samples is undersaturated, and they can be enriched in fluoride ions(Fig. 7).
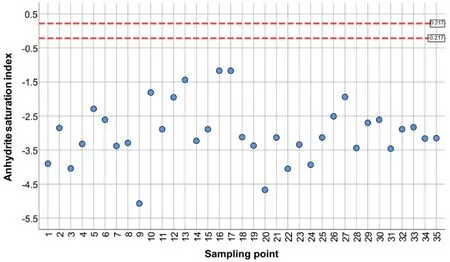
Fig. 4 Saturation index for CaSO4 legend: blue point—undersaturated solution number and names of sampling points consistently to Table 1
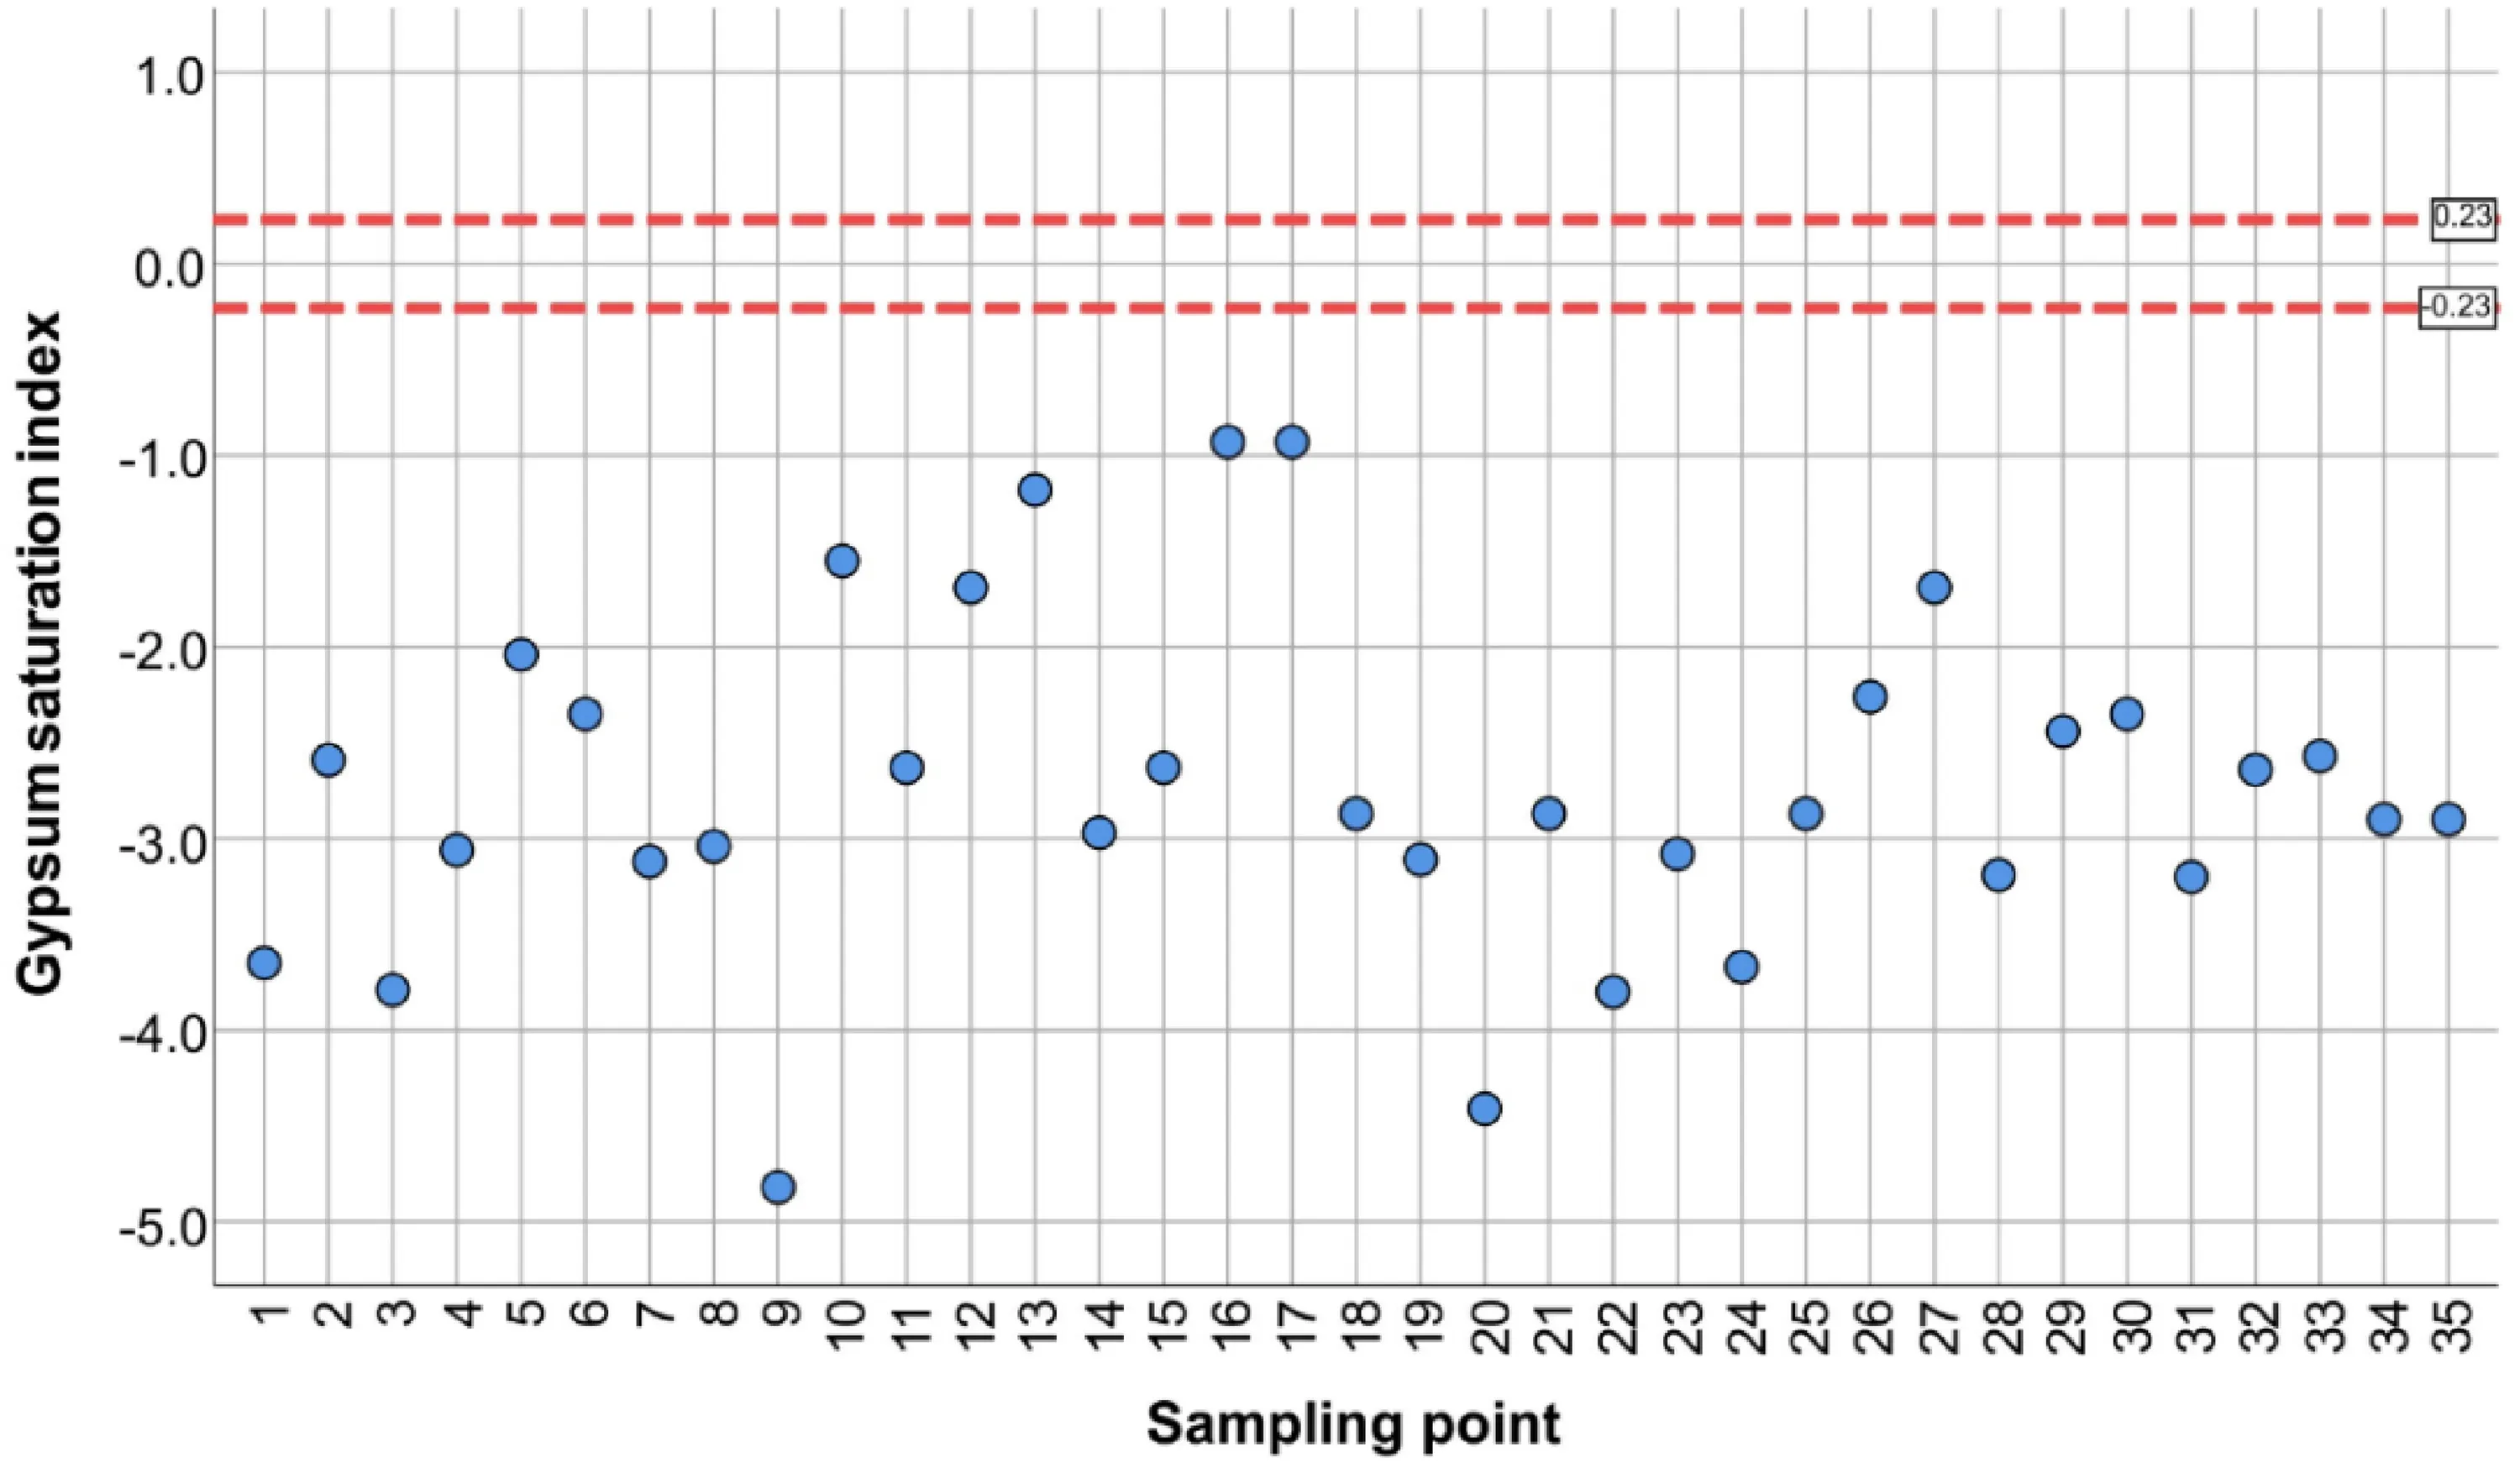
Fig. 5 Saturation index for CaSO4∙2H2O legend: blue pointu—ndersaturated solution
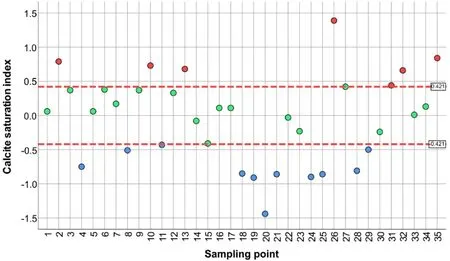
Fig. 6 Saturation index for CaCO3 legend: red point—supersaturated solution, green—thermodynamic equilibrium,blue—undersaturated solution
5 Discussion
5.1 Sources of high Na+ in groundwater
Most of the groundwater samples collected throughout Turkana County in Kenya are of the Na-HCO3hydrochemical type. Beyond Na+as a dominant cation and HCO3-as an anion, in several samples there are other prevailing ions (>20 % meq/L) such as Cl-(16 samples),Mg2+(10 samples), Ca2+(4 samples), SO42-(2 samples),and K+(1 sample). In one sample (No. 27) there are no dominant cations. The Na-HCO3type of water is less common compared to Ca-HCO3or Ca-Mg-HCO3types characteristic for freshwaters and resulting from the dissolution of the carbonate minerals such as calcite, aragonite, and dolomite. The process controlling the relatively high concentration of sodium in groundwater is chemical weathering of Na-feldspar (1) with the simultaneous release of sodium ions and bicarbonates (Toran and Saunders 1999; Dupalova´ et al. 2012; Kumar et al. 2017):

The production of Na+and HCO3-in groundwater may also be caused by cation exchange of Na+on exchange sites by Ca2+coupled with dissolution of carbonates(Sracek and Hirata 2002; Sracek et al. 2019):

where X denotes exchange sites. Both processes produce Na-HCO3type of groundwater with high pH values and mineralization.
5.2 Fluoride ions sources in groundwater
In groundwater, the occurrence of fluoride is often linked to the volcanic rocks and its concentration is controlled by alkalinity, the concentration of bicarbonates, and electrical conductivity (Ali et al. 2016, 2018; Alarco´n-Herera 2013;Alarco´n-Herrera et al. 2020; Saxena and Ahmed 2001).Groundwater enrichment in fluoride ions may have an origin in chemical weathering, magmatic processes,atmospheric dust, and industrial pollution. Precipitation of mineral-like CaCO3in solution with the slightly alkaline or alkaline pH value will favour decreasing of Ca ions concentration with simultaneous enrichment in F-ions through the dissolution of fluorite until the thermodynamic equilibrium with this phase is reached (Gizaw 1996;Kumar and Singh 2015; Rafique et al. 2015). Groundwater around the world containing a high concentration of fluoride exhibits often the Na-HCO3type with a low concentration of calcium and/or magnesium ions (Alarco´n-Herrera 2013; Sracek et al. 2015). Also, fluoride is present in groundwater as anion F-and is desorbed at high pH values above pHZPCjust like other anionic species of As,Mo, Se, and V (Appelo and Postma 2005). The link of high F-to Na-HCO3type of groundwater has been observed,e.g., at the Chaco-Pampean Plain in Argentina (Smedley et al. 2002; Bhattacharya et al. 2006), the Main Ethiopian Rift (Bretzler et al. 2011), and southeast and central Sri Lanka (Edmunds and Smedley 2004) with similar climatic and hydrogeological conditions as in the Turkana Lake region.
5.3 Correlation between F- and Ca2+ ions
In research studies presented, e.g., by Gizaw (1996),Rafique et al. (2015), and Kumar et al. (2017) there was found an inverse relationship between the concentration of F-and Ca2+in investigated natural waters. It is related to the solubility control by precipitation fluorite when supersaturation concerning the mineral phase is reached. In the saturation indices plot, only 6 samples stay in thermodynamic equilibrium with CaF2(Fig. 8). For these points,there was a check of the equilibrium state with CaCO3.Two points, i.e., Kalemngorok (No. 10), and Nataparkakonok (No. 31) show supersaturation with this mineral phase manifesting a tendency for precipitation of calcite. Kapendo (No. 12) and Nakwamekwi parish BH(No. 27) samples are in the upper range of SI values and the Keenyenyuk sample (No. 15) is in the middle of the interval for thermodynamic equilibrium. When these points are plotted, there is a significant Pearson correlation coefficient (p<0.05) for the inverse correlation between calcium ions and fluoride ions with the value of R = - 0.993(Fig. 7a) as expected based on CaF2solubility control of dissolved F-(Appelo and Postma 2005). However, when all points are included in the plot, there is no correlation(Fig. 7b), suggesting these processes operate only locally.
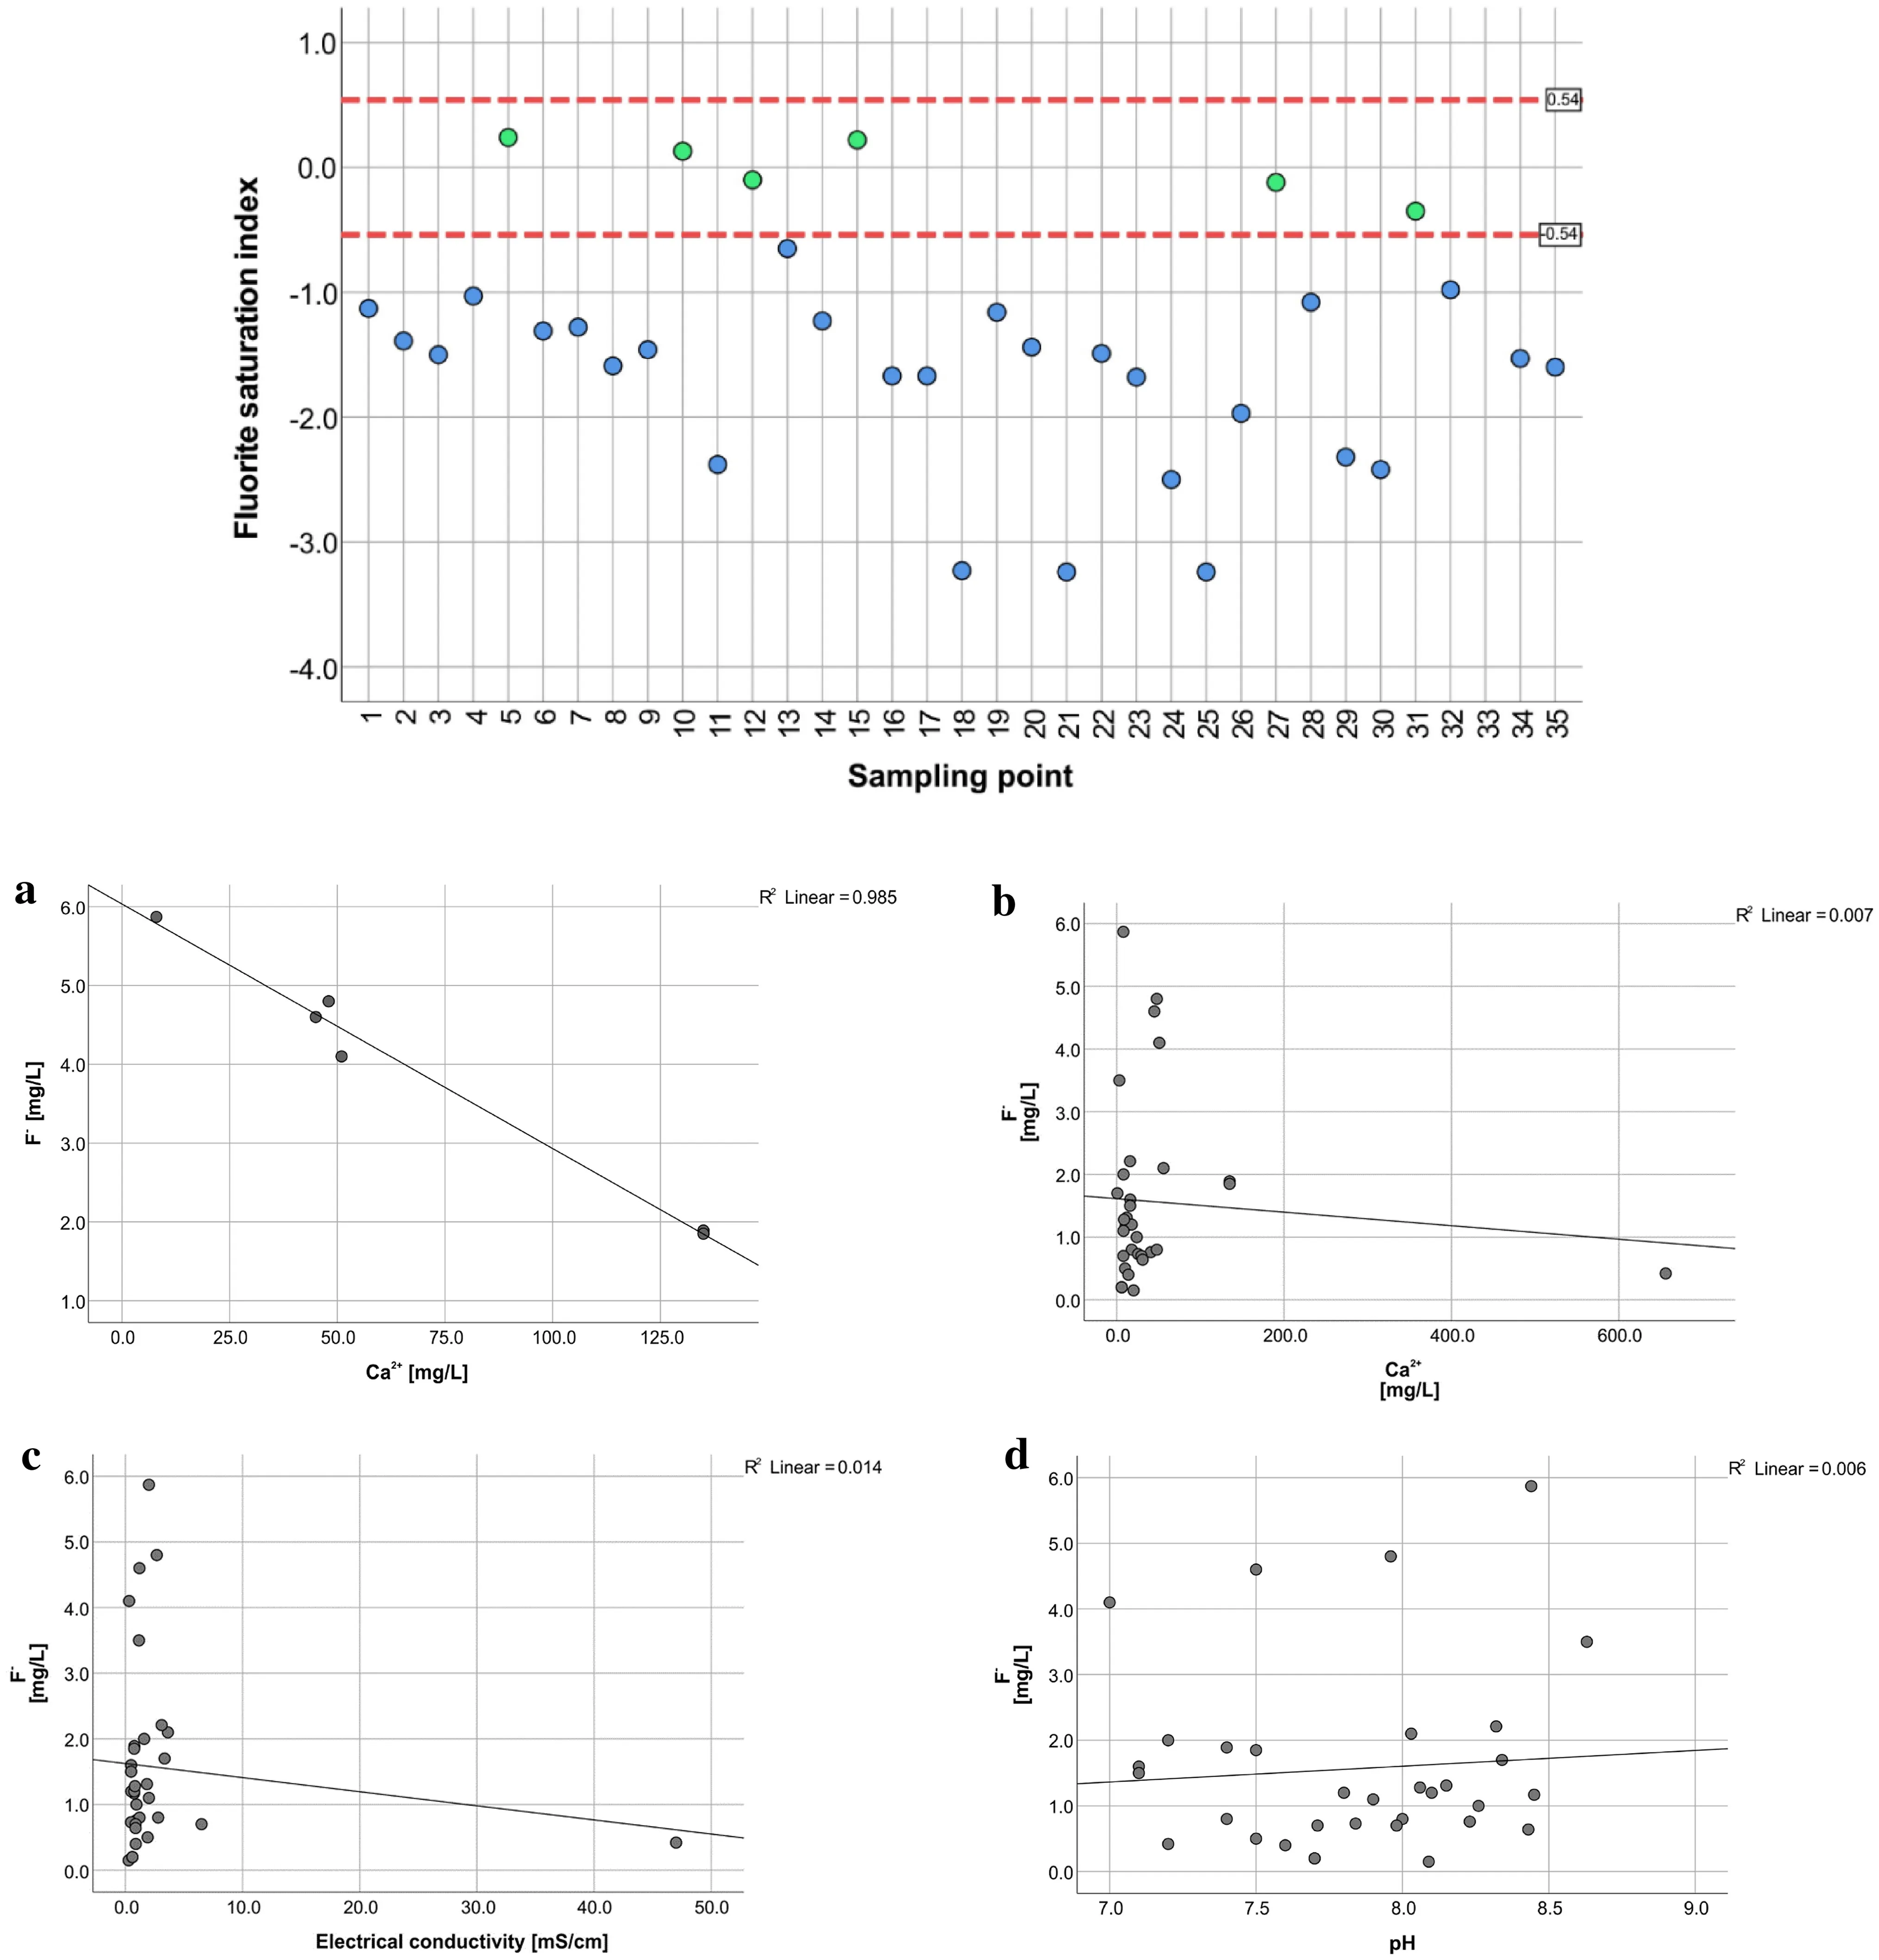
Fig. 7 Saturation index for CaF2 legend: greent—hermodynamic equilibrium, blue—undersaturated solution
5.4 Correlation between F- and EC, pH
There is no correlation between F-and EC representing mineralization (Fig. 7c), suggesting that evaporation is not the principal process responsible for high Fconcentrations.
Similarly, the lack of correlation between pH and F-(Fig. 7d), suggesting that desorption of F- under increasing pH conditions is not significant. However, the possibility of competition with trace elements forming anionic species for adsorption sites should be checked in future studies.
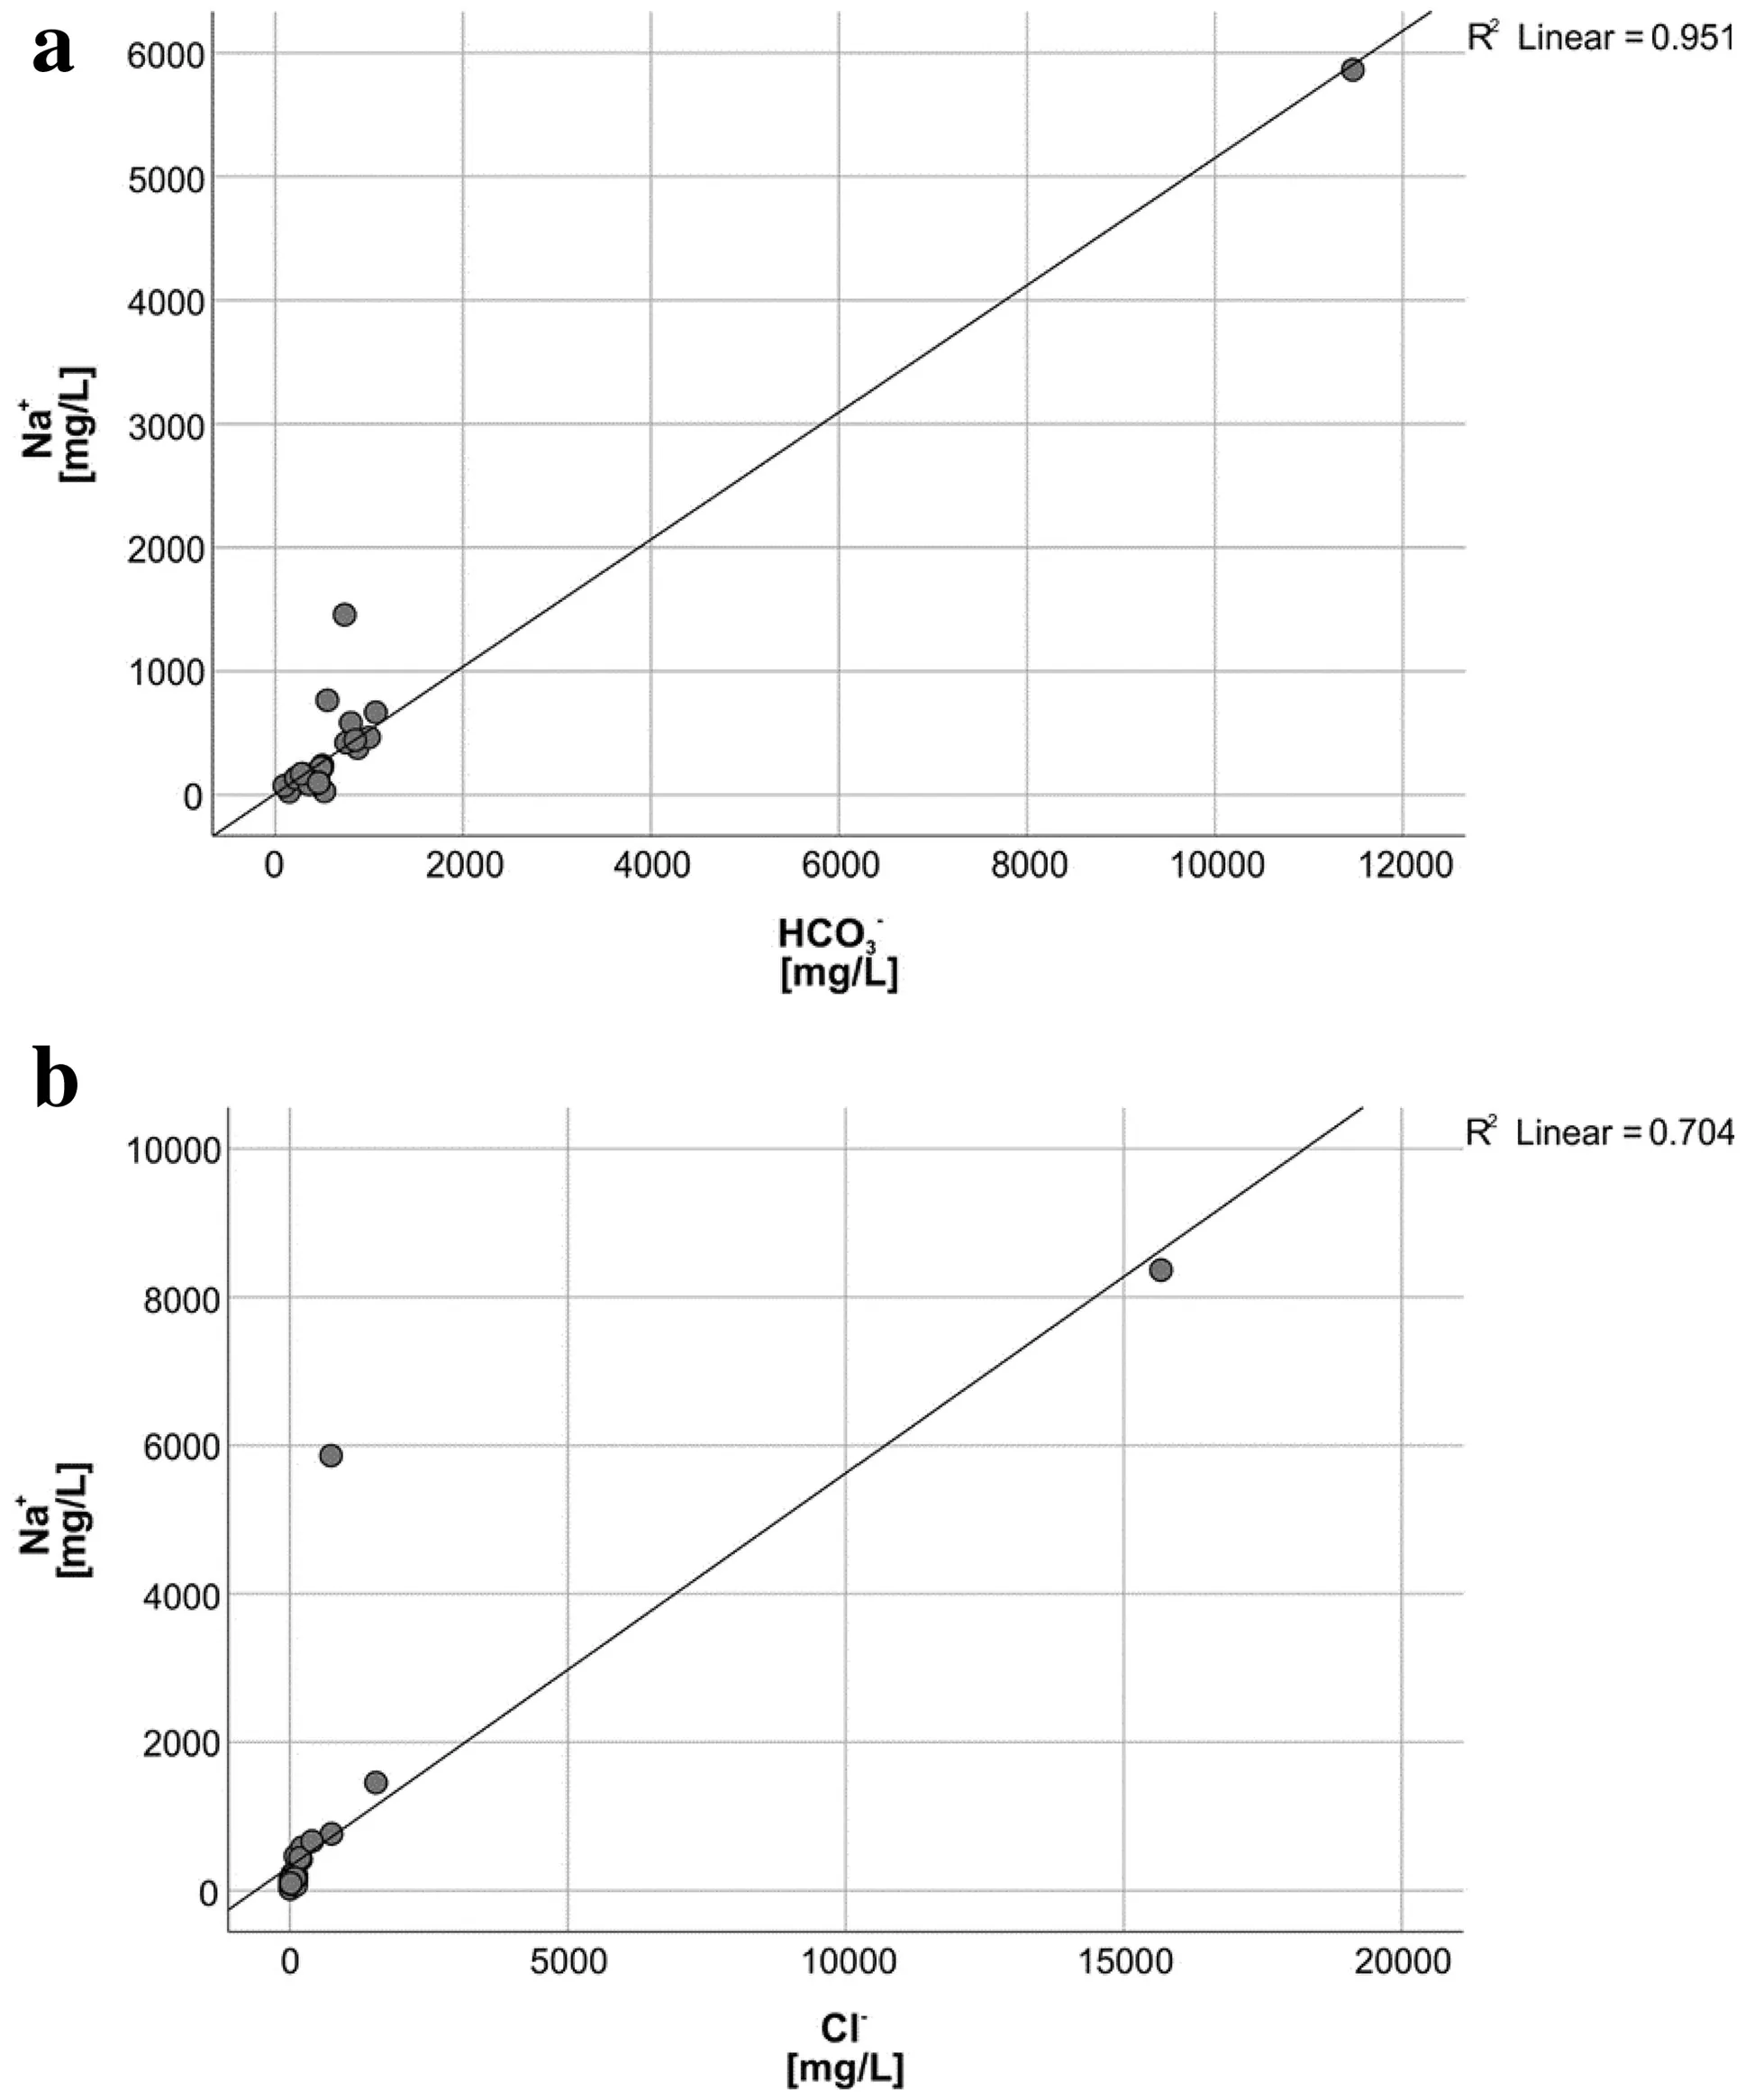
Fig. 8 a Na vs HCO3 for all data b Na vs Cl for all data
5.5 Relationship between Na+ and F- ions
Also, Na+ions have a strong positive correlation with HCO3-probably as a consequence of the sodium feldspar weathering in the aquifers and/or cation exchange coupled to the dissolution of carbonates (Fig. 8a). This correlation has been observed in F-rich groundwaters in Ethiopia(Bretzler et al. 2011) and Namibia (Sracek et al. 2015). For samples, where the sampled wells are installed in sandy riverbed sediments, a high concentration of sodium may be a result of hydraulic contact of groundwater with local surface water bodies. The water in the Kenyan rivers and lakes exhibit slightly alkaline to alkaline pH with increasing concentration of Na + , HCO3-, and Cl-ions as a result of strong evaporation (Gizaw 1996; Cerling 1979; Yuretich and Cerling 1983). Concentrations of Na+and Cl-increase in parallel (Fig. 8b) because both ions behave conservatively, i.e., they remain dissolved, until advanced evaporation stages with resulting formation of a brine (Drever 1997).
In our study concentration of sodium perhaps is mostly restricted to the water horizon which constitutes of sands and gravels with locally alternated with clay formation,weathered and/or fractured gneisses (granitoid, pegmatic,biotite, epidotised), and mafic rocks like basalts with different degree of weathering and linked to the Tertiary volcanic rocks.
On a regional scale, F-ions revealed only a slightly positive correlation (R = 0.350) with K+ions. It suggests that a potential source of F-and K+in groundwater can be the dissolution of biotite (Chae et al. 2006), being one of the principal minerals in gneiss or weathered/fractured granitoid gneiss.
6 Conclusions
Investigations of the groundwater collected from the wells in the Turkana County in Kenya revealed relatively high concentrations of fluoride ions in the range from 0.15 to 5.87 mg/L. Almost half of the samples have a higher value of F-than the WHO guideline value and the Kenyan potable water standard of 1.5 mg/L. Drinking water with an elevated concentration of fluoride can lead to healthrelated issues like dental or skeletal fluorosis or even to hypocalcaemia while precipitating CaF2in the human organism. Some prevention programs and water treatment should be applied to prevent negative (even serious) health problems that may result from the consumption of contaminated groundwater. Hydrogeochemical facies has shown that the groundwater in the majority is of Na-HCO3type which is significantly linked to high F-concentrations, just like observed elsewhere, e.g., in Argentina,Ethiopia, and Namibia. These results suggest geogenic sources of F-. Process of controlling the high concentration of F-ions in groundwater seems to be precipitation of CaCO3decreasing Ca2+concentration followed by the dissolution of CaF2and enrichment of groundwater in F-.Simultaneously, chemical weathering of sodium feldspar in the aquifer matrix and cation exchange of Ca2+for Na+on the exchange sites result in the formation of alkaline pH,Na-HCO3type of groundwater with a high concentration of F-. Further studies should be focused on other trace elements forming anionic species like As and V.
AcknowledgementsThe authors are very thankful to the Government Chemist’s Department of the Republic of Kenya and local institutions for sharing the data used in this paper.
Authors’ contributionsConceptualization, P.R, K.S.; methodology,P.R.; formal analysis, P.R., O.S., K.S.; investigation, P.S., K.S., P.R.;writing—original draft preparation, P.R..; writing—review and editing, P.R., O.S., and K.S.; supervision, O.S. and K.S. All authors have read and agreed to the published version of the manuscript.
FundingThe study was partially financed by AGH-UST 16.16.140.315/10.
Declarations
Conflict of interestThe authors declare that they have no known competing financial interests or personal relationships that could have appeared to influence the work reported in this paper.
Open AccessThis article is licensed under a Creative Commons Attribution 4.0 International License, which permits use, sharing,adaptation, distribution and reproduction in any medium or format, as long as you give appropriate credit to the original author(s) and the source, provide a link to the Creative Commons licence, and indicate if changes were made. The images or other third party material in this article are included in the article’s Creative Commons licence, unless indicated otherwise in a credit line to the material. If material is not included in the article’s Creative Commons licence and your intended use is not permitted by statutory regulation or exceeds the permitted use, you will need to obtain permission directly from the copyright holder. To view a copy of this licence, visit http://creativecommons.org/licenses/by/4.0/.
杂志排行
Acta Geochimica的其它文章
- Interception, degradation and contributions of terrestrial organic carbon obtained from lignin analysis in Wujiang River, southwest China
- Mineralogy and geochemistry of fine-grained Dahab stream sediments,Southeastern Sinai,Egypt:emphasis on the intergrowths of Fe–Ti oxides
- Response of silicate chemical composition variation on thermal metamorphism of ordinary chondrites and classification of petrologic types: the case of L chondrites from Grove Mountains, Antarctica
- Hydrogeochemical characteristics and its role in controlling arsenic mobilization in a shallow aquifer
- Constraints on unconsolidated pyroclastic flow sediments related REE enrichments originated from potassic-alkaline Go¨lcu¨k stratovolcano: Darıdere-Direkli-Yakao¨ren (DDY) table 4deposits,southwestern Anatolia of Turkey
- Distribution of functional microorganisms and its significance for iron, sulphur, and nitrogen cycles in reservoir sediments
