Interception, degradation and contributions of terrestrial organic carbon obtained from lignin analysis in Wujiang River, southwest China
2021-11-04XinLinYujieWangJinhuaZhangMingYangXuepingChenFushunWangJingMa
Xin Lin • Yujie Wang • Jinhua Zhang • Ming Yang • Xueping Chen •Fushun Wang • Jing Ma
Abstract Understanding the fate of terrestrial organic carbon (OC) in a cascade impoundment system is critical for recognizing the role of carbon sink for reservoirs.Surface sediments collected from eight cascade reservoirs across the Wujiang River, southwestern China, were analyzed for elemental and stable carbon isotopic (δ13C)composition, and lignin phenols (Σ8 and Λ8) to investigate the spatial distribution, contribution, origin and degradation of sedimentary terrestrial OC. The values of total organic carbon (TOC) and Σ8 exhibited a remarkable reduction along the upstream–downstream transect suggesting the trapping effect of cascade-damming. A relatively broad range of δ13C (-26.61 to -25.54%, 95% CI)and C/N (6.80–18.20) indicated mixed allochthonous/autochthonous OC sources in surface sediments. The quantitative simulation indicates that the OC of the sediments mainly was derived from terrestrial organic matter. Soilderived OC rather than C3 vascular plant-derived OC makes a major contribution to sedimentary terrestrial OC in reservoirs on karst terrain. As evidenced by lignin compositions and δ13C, the predominant vascular plant origins of terrestrial OC along the Wujiang River are non-woody angiosperm C3 plants. The aged reservoirs showed a trend of increasing contribution of autochthonous OC, which potentially weaken the role of carbon sink for reservoirs.The relationship between runoff inputs, watershed area/water surface area ratios, and water residence time and Λ8 were explored, indicating the natural and anthropogenic influences on terrestrial OC remains very complex in a cascade-damming river.
Keywords Lignin phenols ∙Terrestrial organic carbon ∙Cascade impoundment
1 Introduction
Organic carbon (OC) sequestration in the sediments of impoundment rivers (reservoirs) represents a significant sink in the global carbon cycle. At present, around 40% of OC from inland water (including terrestrial and autochthonous OC) is estimated to annually collectively bury and store in reservoirs (Zarfl et al. 2014; Clow et al. 2015;Mendonca et al. 2017). For the last few decades, largescale impoundment of natural rivers has been increasingly practiced for drinking-water supply, hydropower generation, flood control, and irrigation globally. It is reported that more than 90% of the major river basins were strongly regulated across China, with about 97,246 reservoirs have been built as of 2011(Chen et al. 2018). The total storage capacity of reservoirs was more than 8.10 × 10¹¹m3,which was around two times higher than that of lakes(Chen et al. 2018; Wang et al. 2019b; Waters et al. 2019).Moreover, a high density of cascade dam developments aggravated river fragmentation, hydrological changes,sediment deposition, and ecological impacts, potentially changed river capacity to transport and transform organic matter (OM) (Xu and Milliman 2009; Wang et al. 2019a,c;Keaveney et al. 2020; Pondell and Canuel 2020; Yang et al.2020; Kang et al. 2021).
Sedimentary OC in reservoirs is influenced by its origins and these attributes, in turn, control its fate (Rowe et al.2018). It is commonly assumed that mineralization of terrestrial vascular sources (allochthonous) of sedimentary OC is strongly constrained with a limited degree of postdepositional degradation (Gudasz et al. 2017). In contrast,sedimentary OC originated from internal primary production (autochthonous, e.g., algae and non-vascular aquatic macrophytes) is labile, and mineralized rapidly at the sediment–water interface (Keaveney et al. 2020). Hence,quantitative estimation of the contributions of the terrestrial OC stored in cascade reservoir sediments is of great interest in our understanding of the drivers and mechanisms of OC burial and the feedback to environmental changes.
Lignin has been widely used as a biomarker for terrestrial OC because this complex compound is exclusively produced by vascular plants tissues with relative resistance to microbial degradation (Jex et al. 2014; West et al. 2016;Salim and Pattiaratchi 2020). Useful information on the oxidation stage of lignin and the biological source in natural environments can be given by the monomeric composition of lignin phenols upon copper oxide (CuO)oxidation (Wysocki et al. 2008). Lignin phenols have hence been widely used in probing the transformation and transport of terrestrial carbon in the soil, marine and fluvial systems (Pondell and Canuel 2020; Shi et al. 2020). To date, little is known about the origin, degradation and contributions of lignin composition in cascade reservoirs along a river, and the potential control of terrestrial OC burial is still poorly understood in the cascade impoundments, in particular in the karst landscape. Therefore,analysis of lignin as a signal of terrestrial OC may be helpful to better understand the influence of cascade reservoirs on the distribution and decomposition stage of terrestrial OC in sediments of inland water (Dittmar and Lara 2001; West et al. 2016; Salim and Pattiaratchi 2020).
Here we examine eight large-volume reservoirs with different types of hydrological regulation along the Wujiang River, a major tributary of the upper Yangtze River in southwestern China, to explore the cascade-damming effect on the spatial distribution of terrestrial OC in surface sediments. we determined lignin contents and composition in surface sediments of reservoirs. By doing so, we provide evidence on the contribution of terrestrial OC, its plant sources and degradation, as well as to understand how the potential hydrological factors ultimately control the preservation of terrestrial OC in the cascade constructed impoundments.
2 Material and method
2.1 Study area and sampling
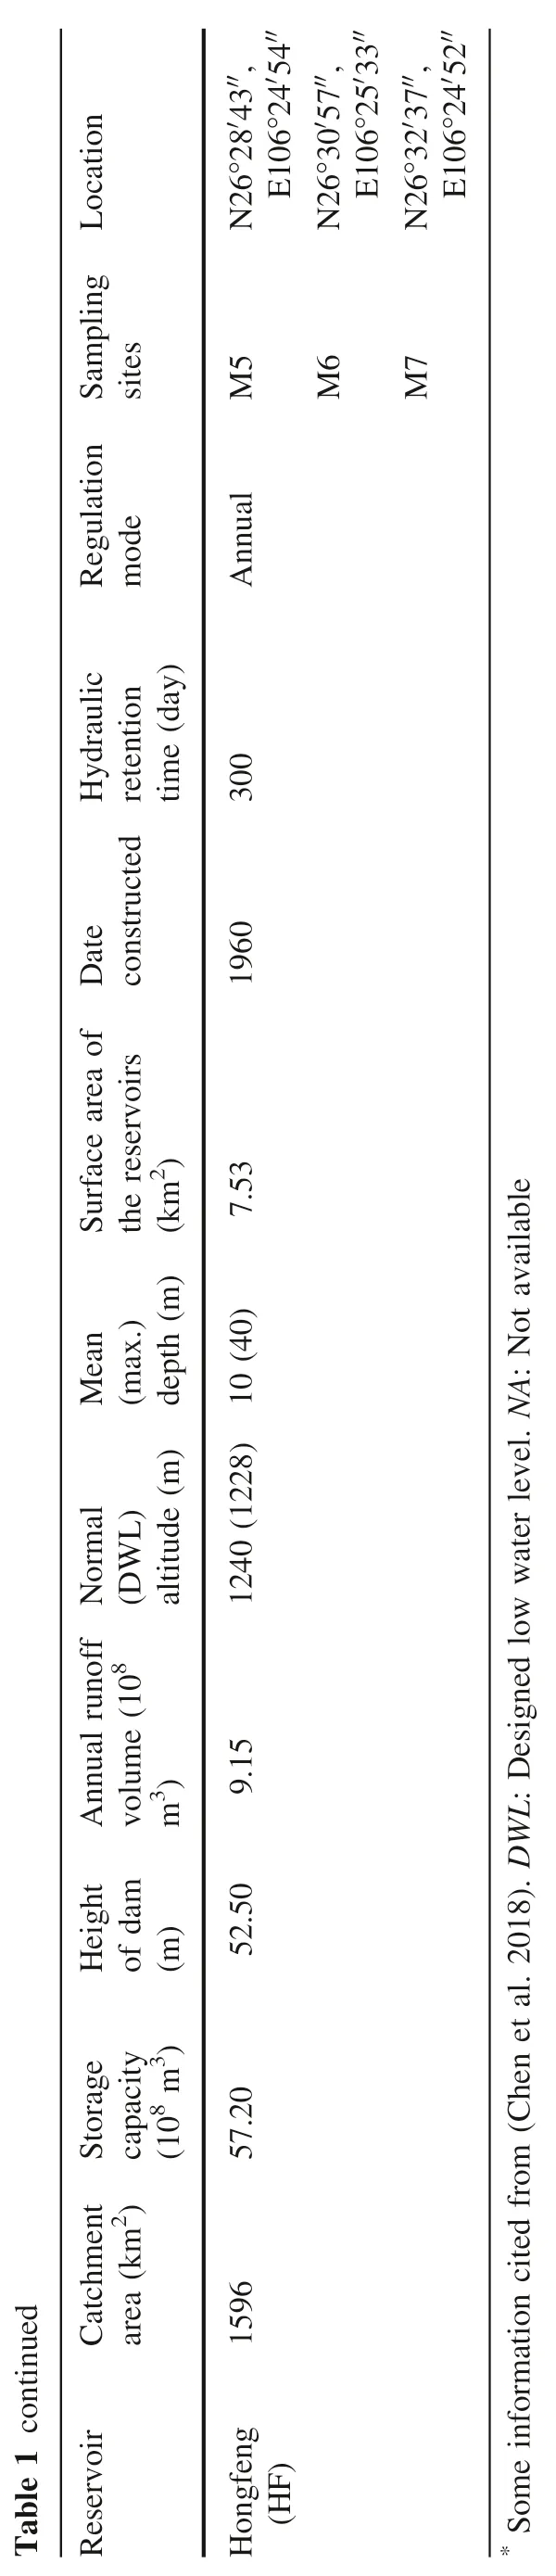
With a length of 1150 km and a drainage area of 88,267 km2, the Wujiang River is the largest southern tributary of the upper Yangtze River, mainly distributed in a karst area of southwestern China. As a valley river, the Wujiang River is sourced from Sancha in western Guizhou Province, picking up fifteen major tributaries, and empties into the Yangtze River at Fuling, approximately 80 km eastern of Chongqing Municipality. The Wujiang River has been extensively developed for hydroelectricity generation due to its ample water resource, and twelve reservoirs have been constructed on the mainstream of the Wujiang. The Maotiao River, the primary southern tributary of the Wujiang River, also owns four reservoirs connected closely along the river, two of which are important drinking water sources for Guiyang city. The aquatic environment of the Wujiang River basin has greatly changed by the cascade dam over the past decades. In the present study, we sampled the surface sediments of selected eight reservoirs:Hongjiadu (HJD), Dongfeng (DF), Suofengying (SFY),Wujiangdu (WJD), Silin (SL), Pengshui (PS), and Yinpan(YP) sequentially located in the mainstream, and Hongfeng(HF) in its tributary, the Maotiao River. Detailed elementary characteristics and sampling sites of these eight selected reservoirs are shown in Table 1.
The surface sediment samples (0–20 cm depth) were collected from 20 sites of the eight selected reservoirs with a stainless-steel grab sampler in 2017 (Fig. 1). Three or four parallel samples were collected at each sampling site(n= 77 in total) identified using a GPS locator accurately.Samples were stored in solvent-cleaned aluminum foil,sealed in plastic bags, and transported on ice to the laboratory and stored at - 29 °C until further treatment and analysis.
2.2 Chemical analysis
After removal of carbonates with 12.5% HCl and drying,total organic carbon (TOC) and total nitrogen (TN) were determined by combustion using an elemental analyzer(FLASH 2000 HT, Thermo Fisher Scientific, MA, US).Samples for stable carbon isotopic ratios of TOC (δ13C)were pre-treated by the same method as used for the TOC measurement. The analysis of δ13C was carried out by applying an elemental analyzer equipped with isotope ratio mass spectrometer (EA-IRMS, FLASH 2000 HT, Thermo Fisher Scientific, MA, US). The analytical variability of elemental and stable isotopic analysis was better than ±1% and ± 0.2%.

′′′′′′′′′′′′′′′′′′′′′′′′′′ion a t Loc′34′′′′′′′′′′,′41′48′′,′′,′39′41′′,′′,′27′′,′′,′53′17′′,′29′35′36′′,′13′′,′51′′,′′,E105°46′48′27 E105°51 E105°47′′,′57′14′49′25′17′58′39′23′29′′,′49′36′′,E105°50′34′34′′,′57′40′55 E106°5 N26°55 N26°53 N26°55 N26°48 E106°8 E106°8 N26°47 N26°51 N26°57 E106°21 E106°25′′,E106°31′31 E106°40′4 N26°55′14 N27°9 N27°13 N27°18 E106°45 N27°19 E108°6 N27°44 E108°10 N27°47 E108°16 N29°8 E108°12 N29°11 E107°53 N29°16 ing mpl s Sa te s i W3 W4 W5 W6 W9 W10 W11 W14 W17 W18 W19 W20 SL3 SL4 PS2 PS3 YP2 ion a t gul Re mode ic aul iony)(da Hydr nt te re t ime l Annua 368 l ona a s Se 29 y i l Da 4 l ona a s Se 49 y i l Da 17 y i l Da 11 y i l Da 2 d te r)ve r i o ia ot Ma he(t y a r ibut t r s i t and r ve R i ng ia Wuj the in rs rvoi se uc te tr Da cons of ea rs a r rvoi ce se fa re 2)Sur the(km))(m anx.h Me(ma pt de)(m l ma Nor(DWL)tude t i a l f runof(108 l Annua ume vol m 3)2004.47 49(130)60(1076)1140.88 48 1995.25 10(76)25(936)970.90 108 2006 01 2.(80)21(822)837.60 124 1983.00 23(95)33(720)760.00 158 2007.54 16(60)22(431)440.16 266 2007.35 13 NA 293.00 410 2007 20 3.NA 215.00 436 re e d c t le se ght e i of rs te ight m He da)of(m)age ty c i m 3 or pa St c a(108.50 179.50 68.00 162 74 8..80 115 99 0..00 165.24 50.00 117.02 34.50 116 13 8..00 80.40 11 me ra pa y a r nt me le 1 E e Tabl nt 2)hme(km tc Ca e a a r r rvoi se Re 9900 du ia Hongj D)(HJ,161 18 eng Dongf(DF),862,790 21 27 ng engyi)ngdu)JD Suof(SFY ia Wuj(W,558 48(SL)n l i Si,000 69 hui ngs Pe (PS),910(YP) 74 n npa Y i
d inue ont 1 c e Tabl ion a t Loc ing mpl s Sa te s i ion a t gul Re mode ic aul iony)(da Hydr nt te re t ime d te uc te tr Da cons of ea rs a r rvoi ce se fa re 2)Sur the(km))(m anx.h Me(ma pt de)(m l ma Nor(DWL)tude t i a l f runof(108 l Annua ume vol m 3)ight m He da)of(m)age ty c i m 3 or pa St c a(108 nt 2)hme(km tc Ca e a a r r rvoi se Re′′′′′′′54′′,′33′52′′,′′,′43 E106°24′57′37 N26°28 E106°25 N26°30 E106°24 N26°32 M5 M6 M7 l Annua 300 1960 53 7.e abl i l ava(40)Not 10 NA:(1228)l.ve le r 1240 te wa low d gne 15 s i 9.De DWL:.50.52 2018).a l e t n.20 57(Che om f r d te 1596 c i on t i ma or eng inf Hongf(HF)* Some
Lignin phenols were performed according to the alkaline CuO oxidation method developed and modified in previous literature (Hedges and Ertel 1982; Miguel and Shelagh 2000). Briefly, freeze-dried sediments were weighted(500 mg), and mixed with CuO (250 mg), ammonium iron(II) sulfate hexahydrate (Fe (NH4)2(SO4)2∙6H2O, 25 mg)and N2-purged NaOH (2 M, 7 mL) in a Teflon-lined vessel. All vessels were prepared in a glove compartment. The digestion process was performed in a microwave digestion system (WX-6000, PreeKem, Shanghai, China) at 150 °C.An internal standards mixture (ethyl vanillin and cinnamic acid) was spiked, and pH was adjusted to 1 by the addition of 6 M HCl, vortexed and then kept in the dark for 1 h.After centrifugation (3000 rpm for 15 min), clear supernatants were loaded on a Cleanert PEP cartridge (150 mg/6 mL, Bonna-Agela Technologies, CA, US) for solid-phase extraction. Lignin phenols were eluted by 5 mL of ethyl acetate. The eluents were concentrated to near dryness under a gentle nitrogen stream and reconstituted with 200 μL of acetonitrile for further analysis. Both samples and native standards were derivatized with 99% bistrimethylsilyl trifluoroacetamide (BSTFA) and 1%trimethylchlorosilane (TMCS) to silylate all exchangeable hydrogens prior to instrument analysis (70 °C, 10 min).Gas chromatography coupled with the mass spectrometer(GCMS-QP2020, Shimazu, Kyoto, Japan) was used in the identification and quantification of lignin phenols. Eleven lignin phenols and two internal standards were separated by a fused capillary column (DB-1,30.00 m × 0.32 mm × 0.25 μm; Agilent, CA, US). Aliquots of 1 μL of extract were injected in splitless mode, at 300 °C. The column oven temperature program was set from 100 to 170 °C at a rate of 8 °C/min and held for 5 min, and then raised to 300 °C at 10 °C/min, held for 4 min for lignin phenol analysis. The temperature of the ion source is set to 230 °C, and that of the interface was maintained at 300 °C. The mass spectrometer was operated in the electron ionization (EI, 70 eV) and selected ion monitoring (SIM) modes. Recoveries of internal standards spiked into individual samples were 85% (± 11%) for ethyl vanillin and 104% (± 15%) for cinnamic acid.
These eleven lignin-derived phenols produced by alkaline CuO oxidation are divided into vanillyl (V; including vanillin, acetovanillone, and vanillic acid), syringyl (S;including syringaldehyde, acetosyringone, and syringic acid), cinnamyl (C;p-coumaric, and ferulic acids), andphydroxyl (P; includingp-hydroxybenzaldehyde,p-hydroxyacetophenone, andp-hydroxybenzoic acid) groups (Heges and Mann. 1979; Goni and Hedges. 1992). Notably, P groups are not only released from CuO oxidation but also demethylation of lignin or decomposition of non-lignin precursors such as proteins and ‘‘tannin-like’’ compounds in aquatic environment probably, which are not regarded as indicators of terrestrial OC generally (John and Richard 1995; Feng et al. 2016). So, the concentration of lignin phenols is summarized as absolute concentrations of the sum of V, S and C groups (Σ8 = V + S + C; in the units of mg/10 g sediment or soil) and OC-normalized concentrations (Λ8 = Σ8/TOC; in the units of mg/100 mg OC).Ratios of S/V and C/V are applied to indicate the relative input of angiosperm and nonwoody tissues versus gymnosperm wood, respectively. The Ad/Al ratios of V and S phenols are used to indicate lignin degradation through propyl side-chain oxidation (e.g., by white-rot decay). The ratio of P/(V + S) can reflect the diagenetic state of lignin when the other sources of P phenols are relatively constant(Hedges and Ertel 1982; Dittmar and Lara 2001).
2.3 Mixing model and Monte-Carlo (MC)simulation

A three-end-member mixing model was applied using δ13C and Λ8 as markers to quantify the contributions of sources of OC in the surface sediments of the cascade reservoirs along the Wujiang River (Wang et al. 2004, 2015), which consists of the following equations:wherefsoilandfvasclrepresent the relative proportions of OC from soil and terrestrial vascular plants to TOC collectively indicating the contribution of terrestrial OC, whilefplktrepresents the proportion of OC from freshwater plankton expressing the contribution of autochthonous OC.The specific assumptions used are as follows:Λ8soil= 0.76 ± 0.38 mg/100 mg OC, and δ13Csoil= - 24.37 ± 1.00 %; Λ8vascl= 15.00 ± 5.00 mg/100 mg OC (Yang et al. 2008), and δ13Cvascl= - 27.00 ± 2.00 % (Gordon and Gon˜i 2003);Λ8plkt= 0 (it is generally believed that freshwater plankton does not contain Λ8), and δ13Cplkt= -29.10 ± 2.00 %(Chen and Jia 2009). The end-member values for soil were determined by the soils collected from the hydro-fluctuation belt around the reservoirs along the Wujiang River.When selecting the end-member values of higher vascular plants, Yu Hao (Hao et al. 2007) and others believe that it is necessary to take into account that plants will have different vegetation characteristics. So, the parameter of Λ8 for vascular C3plants refers to that used by Gon˜i at the estuary of Winyah Bay, which considered the mixture of woody and herbaceous plants (Gon˜i et al. 2003). MC simulation was employed to estimate the relative proportions of each end member in the present study. The values of the end-member directly affect the accuracy of the results. The MC simulation method adopted in this study allows the values to change within a certain range, which can correct the uncertainty of traditional methods to a certain extent (Andersson 2011).
3 Result
3.1 TOC, C/N ratios and δ13C values
The results of bulk elemental, stable carbon isotope and lignin parameters of eight studied reservoirs in the Wujiang River are presented in Table 2. Bulk OC values of surface sediments ranged from 0.88 % to 4.66 %, where the TOC content (95 % confidence interval, CI) was 2.00–2.47 % in upper reach, 0.94–1.10 % in lower reach, and 3.04–4.04 %in tributary respectively. This result exhibited expected spatial patterns, where the TOC contents appeared to decrease from upper reach to lower reach significantly, and the values in tributary were significantly higher than those both in upper and lower reaches (One-way ANOVA,p= 0.000). Similarly, TN content (95 % CI) was 0.23–0.27 % in upper course, 0.13–0.23 % in lower course,and 0.35–0.47 % in tributary respectively, consistent with the trends of TOC (r2= 0.683,p= 0.000,n= 77). The C/N ratios ranged from 6.80 to 18.20 showing significant spatial variations between upper and lower reaches(p= 0.000) and between tributary and lower reach(p= 0.003). The δ13C values displayed a narrow variety(- 26.61% to - 25.54 %, 95% CI) along the Wujiang River except for a marked drop at W20 (- 29.42 % on average) in the WJD reservoir. No significant (p= 0.390)spatial variation was observed along the upstream–downstream transect or mainstream–tributary transect for the δ13C values.
3.2 Lignin phenols
Lignin phenol concentrations were 0.39–4.45 mg/10 g for Σ8 (1.35–1.74 mg/10 g, 95% CI for mean) and 0.14–1.60 mg/100 mg OC for Λ8 (0.61–0.77 mg/100 mg OC, 95 % CI for mean) in the eight studied reservoirs.Significant decline (p= 0.000) was observed along the upstream–downstream transect. The relatively higher values of Σ8 were observed in SFY and WJD reservoir(2.83 ± 1.05 mg/10 g and 2.43 ± 0.75 mg/10 g, on average respectively) compared to the other reservoirs. However, the trend of Λ8 is opposite to an increase along the upstream–downstream transect with significant variation(p<0.001). Remarkably, both Σ8 and Λ8 values showed minimum levels in the HF reservoir in the tributary.
The S/V and C/V ratios were 0.49–1.73 (0.96–1.05,95 % CI for mean) and 0.08–2.16 (0.48–0.64, 95 % CI for mean), respectively. The Ad/Al ratios of V phenols (95 %CI for mean) were 0.33–0.39, 0.35–0.43, and 0.36–0.52 for upper reach, lower reach and tributary, respectively. The Ad/Al ratios of S phenols (95 % CI for mean) were 0.32–0.37, 0.27–0.33, and 0.28–0.51 for upstream, downstream and tributary, respectively. The highest Ad/Al ratios for both vanillyl and syringyl phenols (0.54 and 0.58 respectively) were observed only in M5 from the HF reservoir. No significant differences were found between upstream and downstream (p= 0.272 andp= 0.106) along the upstream–downstream transect for the Ad/Al ratios of V and S phenols.
The MC simulation results showed that soil-derived OC was the predominant component of OC in surface sediments in the Wujiang River, followed by freshwater plankton OC, and then terrestrial vascular plants except in W19, W20, PS3, M45, and M6 (Table 3). The soil-derived OC fractions (on average) increased from 49 % in the downstream reservoir to 93 % in the upstream reservoir. C3vascular plant-derived OC comprised the smallest fraction of the sedimentary OC.

Table 3 Monte-Carlo simulation results of three end-members: soil derived OC, vascular plant and freshwater phytoplankton

OC)mg r ve R i ng ia Wuj the in rs rvoi s e re ed c t le se ght e i om f r s nt me di se c e fa sur 100(mg/Λ8 g)10(mg/Σ8 S)+(V P/)s A l(Ad/)v A l(Ad/V C/22 0.21 0.±±77 0.86 0.36 0.82 0.±±78 1.49 2.14 0.18 0.±±33 0.43 0.08 0.06 0.±±32 0.35 0.07 0.04 0.±±39 0.44 0.20 0.15 0.±±60 0.39 0.23 0.12 0.±±53 0.62 0.62 0.22 0.±±35 1.37 1.11 0.05 0.±±43 0.29 0.17 0.12 0.±±45 0.32 0.12 0.02 0.±±44 0.36 0.18 0.18 0.±±34 0.63 0.29 0.19 0.±±51 0.73 0.84 0.30 0.±±22 1.41 1.04 0.09 0.±±35 0.28 0.06 0.08 0.±±35 0.38 0.07 0.08 0.±±40 0.40 0.15 0.10 0.±±42 0.32 0.14 0.34 0.±±40 0.26 1.38 0.05 1.±±24 1.83 2.01 0.04 0.±±29 0.18 0.05 0.04 0.±±34 0.35 0.09 0.08 0.±±46 0.29 0.15 0.13 0.±±61 0.29 0.24 0.20 0.±±97 0.93 0.82 0.44 0.±±23 3.39 2.03 0.01 0.±±18 0.22 0.05 0.05 0.±±34 0.33 0.04 0.03 0.±±32 0.28 0.15 0.11 0.±±58 0.52 0.18 0.08 0.±±79 0.58 0.15 0.37 0.±±92 1.10 2.06 0.02 0.±±29 0.29 0.03 0.05 0.±±31 0.29 0.06 0.04 0.±±30 0.24 0.29 0.34 0.±±53 0.72 0.22 0.28 0.±±95 0.94 0.24 0.32 0.±±19 1.04 1.03 0.02 0.±±28 0.29 0.06 0.05 0.±±29 0.27 0.03 0.07 0.±±37 0.39 0.12 0.09 0.±±46 0.40 0.23 0.18 0.±±09 1.09 1.23 0.15 0.±±10 1.08 1.03 0.04 0.±±25 0.28 0.06 0.05 0.±±31 0.29 0.13 0.07 0.±±40 0.40 0.24 0.11 0.±±48 0.25 0.20 0.03 0.±±98 0.25 0.09 0.08 0.±±85 0.86 0.04 0.53 0.±±30 0.35 1.04 0.18 0.±±34 0.58 0.05 0.13 0.±±40 0.54 0.29 0.19 0.±±57 0.58 0.05 0.01 0.±±22 0.16 0.12 0.08 0.±±78 0.75 0.10 0.04 0.±±89 0.74 0.03 0.03 0.±±33 0.26 0.02 0.06 0.±±36 0.42 0.37 0.42 0.±±05 1.50 1.in rs 14 0.17 0.10 0.24 0.14 0.12 0.05 0.17 0.13 0.07 0.27 0.20 0.05 0.09 0.14 0.06 0.04 0.06 0.10 0.23 0.te me ra V S/±±05 1.97 0.±±84 0.09 1.±±96 0.94 0.±±08 1.07 1.±±14 1.12 1.±±92 0.99 0.±±98 0.91 0.±±76 0.82 0.±±87 0.96 0.±±17 1.34 1.pa n gni l i and ope ot is rbon c a e abl s t,a l nt eme e l k bul(%)δ13C N C/)(%TN)(%86 0.54 97 52 47 51 30 39 24 31 08 00 66 32 29 62 51 37 08 22±1.2.1.0.0.0.2.0.0.1.0.1.0.0.1.0.1.1.3..51±±±±±±±±±±±±±±±±±±±25.08.98.77.39.89.27.62.75.04.01.42.83.46.29.13.57.98.87.61--25-24-26-25-24-25-24-24-26-27-29-24-26-26-27-26-26-27-24 51 06 1.60 0.80 1.61 2.79 0.51 0.15 1.13 1.31 5.44 1.04 2.58 76 51 09 32 25 97 29 1.±±±±±±±±±±0.0.0.1.1.0.0.0.±.50.90.90.70.60.70.40.50.20.60±±.70±±±±±±±.60 12 11 12 11 12 11 14 11 18 12 10 11 9.14 9.81 8.04 8.59 8.50 8.68 9.38 9.11 06 06 02 02 02 02 02 01 02 02 05 0.08 0.05 0.03 0.02 0.02 0.02 0.03 0.03 0.02 0.0.0.0.0.0.0.0.0.0.0.±±±±±±±±±±±±±±±±±±±±23 28 46 16 15 15 14 12 43 44 47 0.29 0.23 0.23 0.21 0.20 0.26 0.23 0.23 0.24 0.0.0.0.0.0.0.0.0.0.0.31 17 40 18 08 19 03 05 09 16 20 21 0.78 0.77 0.38 0.30 0.24 0.15 0.39 0.30 1.0.0.0.0.0.0.0.0.0.0.0.±±±±±±±±±±±±±±±±±±±±of y i t TOC 37 2.95 2.53 2.27 2.25 2.97 1.15 3.22 2.57 3.60 2.52 2.62 3.26 1.15 1.01 1.00 1.88 0.52 3.51 3.66 4.a l ti spa for s lue va ge ra 2 Ave e Tabl te s i ing mpl Sa r rvoi se Re 4)3)4)4)4)4)4)4)4)=========(n (n (n (n (n (n (n (n (n W3 W4 W5 W6 W9 W10 W11 W14 W17 D D HJ DF SFY W J m e a tr Ups 4)4)3)4)4)4)4)3)====4)4)4)====(n (n (n ===(n (n(n (n (n W18 W19 W20(n (n (n SL3 SL4 PS2 PS3 YP2 M5 M6 M7 SL PS YP HF m e a t r y Downs a r ibut Tr
4 Discussion
4.1 Spatial distribution and origins of organic carbon in sediments
Due to the different elemental composition of terrestrial plants and algae, the different sources of OC in the sediments can be discussed through the values of TOC, C/N and lignin phenols. Measured values of sedimentary TOC and Σ8 showed strong spatial variability along the upstream–downstream transect, indicating the cumulative effect of sediment trapping across the cascade dams as the artificial barriers. It is reported that recent booms in megadam construction on East, South and Southeast Asian large rivers have posed a marked reduction in fluvial fluxes of sediment and terrestrial OC (Xu and Milliman 2009; Dai et al. 2011; Gupta et al. 2012; Loh et al. 2018). According to these reports, the interception seems to be even more obvious in the cascade-damming in the Wujiang River(CERC 2020), where the cascade dam altered the spatial distribution of lignin in the sediments. Physical process such as hydrodynamic sorting is likely to make the large fragments containing lignin-rich C3vascular OC deposit in the upstream reservoirs, and make the fine-grained particles with lignin-poor soil-derived OC delivered further along with the downstream (Li et al. 2014). The divergence of Λ8 and Σ8 was due to the deposited phytoplankton-derived OM diluting the abundance of lignin in TOC (Λ8), but this influence was small on sediment mass (Rezende et al.2010). Similar results were reported in Amazon River Basin and Sepetiba Bay (Rezende et al. 2010; Sun et al.2017). Based on the values of TOC and Λ8, three spatial groups were visually divided as the mainstream reservoirs of upper reach, the mainstream reservoirs of lower reach,and the tributary reservoir (Fig. 2a). Variation both in bulk and lignin contents can be pronounced in the special reservoirs and sampling sites. For example, the age of construction, annual hydrological regulation pattern, and less runoff as tributary have led to the lacustrine of HF reservoir. Significant higher TOC content and depleted Σ8 and Λ8 values in HF revealed the lower contribution of terrestrial OM but the higher contribution of autochthonous OM, which is likely to consequently stimulate microbial activity and then exacerbate eutrophication. It has been reported that HF repeatedly suffered from algal blooms and accidental deterioration of water quality since the 1990s,where the maximum values of TOC, TP, and TN in sediment were 2–4 times higher than those in Taihu Lake in Eastern China (Chen et al. 2018). The δ13C values ranged from -24.61% to -29.42% in the present study indicated that C3plants dominated over C4in the sedimentary OC(Fry and Sherr 1984; Saia et al. 2008; Yu et al. 2010).

Fig. 2 a Plot of Λ8 versus OC values for the surface sediments of cascade reservoirs along the Wujiang River. b mixing lines between Λ8 and the P/(V + S) ratio
The three-end-member mixing model was applied to identify the allochthonous and autochthonous origins of the sedimentary OC. The riverine terrestrial OC is composed of soil-derived (degraded) OC and C3vascular plant debrisderived (fresh) OC. The relative contribution of terrestrial OC is predominant in most sampling sites, with soilderived OC accounting for most of the terrestrial OC. Soilderived OC has been proved to constitute a significant part of the sediment OC in many large-river delta-front estuaries systems and reservoirs (Gordon and Gon˜i 2004; Stephane and Patrick 2006; Goni et al. 2008; Cathalot et al.2013; Li et al. 2014). Given this, soil-derived OC should be fully considered as one important source of sedimentary OC burial under cascade-damming conditions that were neglected before. The different fractions among the sampling sites were likely to be attributed to differences in the annual fluxes of terrestrial OC inputs, depositional settings,OC burial efficiency resulted from distinct water residence times, UV exposure, water temperature, or priming effect from elevated nutrients (Li et al. 2014; Prairie et al. 2018).Our quantitative simulation results show that the proportion of terrestrial OC decreased in downstream reservoirs,indicating that reservoir flooding induced the redistribution of eroded soil OC and increasing in the fraction of autochthonous OC transferred to sedimentary environments of these ‘‘young’’ reservoirs, which were built in 2007. A similar observation was also reported in Cabonga reservoir (Houel et al. 2006). Especially, it should be taken into account that the karst landform area accounts for 73.60% in Guizhou province, which is the largest karst mountainous area in southwest China. It has been reported that vegetation located in karst terrains has low aboveground biomass and land degradation that reduces vegetation biomass (Ni et al. 2015). In addition to the harsh and fragile natural habitat on karst terrain, human activity also induced the degradation of vegetation. This might explain the extremely lower contribution of fresh C3vascular plant debris-derived OC. Of course, the accuracy of the model depends greatly on the selection of parameters, but the simulation results can give a trend in a way.
4.2 Lignin characteristic and degradation of terrestrial OC
Elevated S/V ratios (from 0.60 to 4.00) indicate the presence of angiosperms, while low S/V ratios (~0) indicate gymnosperm inputs, as the latter plants do not produce syringyl phenols (Goni, 1997). Nonwoody and woody tissues were differentiated by using the C/V ratio since only nonwoody tissues produce cinnamyl phenols and show C/V values of 0.10–0.80. Woody tissues have C/V values less than 0.05 (Goni 1997). The lignin source indicator S/V and C/V are 1.00 and 0.56 on average, respectively. The elevated S/V and C/V values in this study indicate that lignin in the sediments from eight reservoirs in the Wujiang River has a predominantly non-woody, angiosperm origin (Gon˜i 1997), which was consistent with the forest vegetation and main crops in the Wujiang River Basin, such as cogon,pyracantha, asteraceae, ferns and grassland (Xiuchun et al.2008).
Oxidative degradation of lignin side-chains caused by white-rot fungi often produces Ad/Al ratios >0.40 (Gon˜i 1997). Only a few sampling sites show the ratios above this value. Notably, Ad/Al ratios for both vanillyl and syringyl phenols exhibits similar in lower and upper reach reservoirs. This does not mean that the oxidation stage of lignin is not significantly altered in the particulate phase in the Wujiang river–reservoir system. On one hand, the oxidation of the incoming, terrestrially derived OC is reduced in the annual or seasonal regulated reservoirs in upper reach with longer water retention time because the OM is no longer maintained in transport in the well-oxygenated water column (Feng et al. 2016). On the other hand, the enhanced runoff supplies of fresh lignin in lower reach have weakened the signal change of Ad/Al ratios. Furthermore, acidic phenols have been reported to be more soluble, resulting in higher Ad/Al ratios in dissolved organic matter (DOM) relative to particulate organic matter(POM) or sediments due to fraction during leaching and sorption processes (Hernes et al. 2007; Feng et al. 2016).Relative higher runoff of the lower reach reservoirs may result in a higher input of fresher lignin from the surrounding area as well as have enhanced lignin dissolution,which was indicated by further lower Ad/Al ratios in sediments potentially related to preferential loss of acidic phenols from sediment to DOM (Feng et al. 2016; Loh et al. 2018).
Althoughp-hydroxyl phenol inputs from autochthonous sources are probably negligible, a specific lignin degradation pathway due to brown-rot fungi leading to demethylation of methoxylated vanillyl and syringyl constituents could mark an increase in the P/(V + S) ratio (Filley et al.2000; Houel et al. 2006). The relatively lower ratios of P/(V + S) were observed in the reservoirs from the mainstream Wujiang River, indicating that deposited terrestrial OC has not suffered from high-level degradation (Li et al.2014). Contrarily, significant increasing P/(V + S) ratios in tributary HF reservoir probably suggested the enhanced degree of demethylated degradation of terrestrial OC occurred in this relatively ‘‘old’’ reservoir which was constructed in 1960, or greater contributions of soil-derived OC from river input. A strong nonlinear relationship was observed between Λ8 and P/(V + S) in surface sediments(r2= 0.47,p<0.001, Fig. 2b), indicating that lignin-rich C3vascular plant-derived OC is likely to mix with ligninpoor but more degraded soil OC in these reservoirs, which is consistent with the result of the three-end-member mixing model simulation. Our result agrees well with previous observations reported in the Cabonga Reservoir(Houel et al. 2006), the inner shelf of the East China Sea(Li et al. 2012), the Changjiang Estuary (Li et al. 2014),Gulf of Ca´diz (Sa´nchez et al. 2009) and Atchafalaya River Estuary (Gordon and Gon˜i 2003).
4.3 Impact of hydrological control on terrestrial OC burial
Construction of river impoundments has likely altered the OC dynamics of river systems (J.Mulholland and Elewood 1982). Moreover, a cascade dam further changes the granularity, chemical compositions and distribution of sediments (Guo et al. 2020). Identifying the natural and artificial factors which potentially control the content and composition of terrestrial OC is challenging, but essential for interpreting the sedimentary record of terrestrially derived organic carbon supply and burial, and for predicting how these systems may respond, and contribute, to future global carbon cycle perturbations (Zonneveld et al.2010; Wu et al. 2013). Disturbances such as local sedimentation rate, hydrodynamic sorting, water residence time, reservoir age, runoff inputs, and anthropogenic eutrophication, have consequences for biogeochemical cycling and aquatic ecosystems (Mulholland and Elewood 1982; Oliver et al. 2016). We explore some of these factors in the context of the Wujiang River.
One of the most significant hydrological changes resulting from the impoundment of a river is the increased water residence time, which of reservoirs were able to bemuch longer like days, months, even years, compared with a few hours for natural rivers, with it, the streamflow patterns were changed (Aguiar et al. 2016; Prairie et al.2018). The difference in hydrological regulation regime may lead to a strong spatial heterogeneity in sediment accumulation rates (Osidele and Beck 2004; Houel et al.2006), and rates of organic carbon accumulation in the sediments of inland aquatic ecosystems appear to be related to the flushing rates of these systems (Mulholland and Elewood 1982). Comparison of lignin (Λ8) with hydraulic retention time, runoff, and watershed area/water surface area ratios also reveal several interesting relationships(Fig. 3). There is a strong positive correlation between the watershed area/water surface area ratios of the water body of the reservoir and the sediment Λ8 (R2= 0.94,p<0.001), which also explains why the downstream reservoir area still has a relatively high content of terrestrial OC. Rivers with larger basin areas tend to receive more sediments and nutrients (Straskraba et al. 2013). SFY reservoir has the highest watershed area/water surface area ratios, indicating that the reservoir’s characteristics are very conducive to the burial of terrestrial OC. More runoff presumably provides more water and sediments, which is an important source of terrestrial OC. The highest lignin content was found in those reservoirs which have relatively larger allochthonous inputs indicated by the positive relationship between Λ8 and runoff. The aged reservoirs commonly have a positive relationship to the watershed area/water surface area ratios, while they are generally inversely related to water residence time, on the premise of having sufficient water residence time for substantial sedimentation of allochthonous inputs and medium to high autochthonous production at the same time (J.Mulholland and Elewood 1982). It is the combined interactions among these factors that will influence the fate of the terrestrial OC and thereby the OC burial attributable to damming.
5 Conclusion
In the present study, element content, stable carbon isotopic composition of organic matter, and lignin phenol concentrations were used to investigate the spatial distribution, contribution, origin, and degradation of sedimentary terrestrial OC in cascade reservoirs across the Wujiang River basin. The values of TOC and Σ8 exhibited a significant reduction along the upstream–downstream transect due to the trapping effect of cascade-damming.Our quantitative simulation estimated that the terrestrial OC, especially soil-derived OC, contributes the major to sedimentary OC in most reservoirs, implying that the extent of mineralization and protection of allochthonous OC stored in sediments is likely to determine the reservoirs as an important carbon sink. The predominant plant origins of terrestrial OC are non-woody angiosperm C3plants. The aged reservoirs showed a trend of increasing contribution of autochthonous OC, which potentially lead to enhanced mineralization and thus weaken the role of carbon sink for reservoirs. In addition, the content of Λ8 in sediments decreased significantly with the increasing water residence time, but increased with the increasing runoff inputs and watershed area/water surface area ratios, indicating the natural and anthropogenic influences on terrestrial OC remains complex in a cascade-damming river. On the premise of having sufficient water residence time for substantial sedimentation of allochthonous inputs and medium to high autochthonous production at the same time. The findings of this study provide a scientific monitoring strategy and a database for OC sequestration along rivers with cascade dams. More work needs to be done to better understand the impacts of cascade dams on the fate of terrestrial OC.
AcknowledgementsThis research was funded by the National Key Research and Development Program of China (2016YFA0601003),and additional supporting was provided by the National Natural Science Foundations of China (Nos. 21477072 and 41573064).
Authors’ contributionsThe authors contribute according to their research specialty: Xin Lin and Yujie Wang: sample collection, data analysis, and writing the original manuscript. Jinhua Zhang: sample collection and preparation. Ming Yang, Xueping Chen, Fushun Wang and Jing Ma: reviewing, editing and supervision. All authors read and approved the final manuscript.
Availability of data and materialAll data generated and analyzed during this study are included in this published article and its supplementary information files.
Declaration
Conflict of interestOn behalf of all authors, the corresponding author states that there is no conflict of interest.
杂志排行
Acta Geochimica的其它文章
- Mineralogy and geochemistry of fine-grained Dahab stream sediments,Southeastern Sinai,Egypt:emphasis on the intergrowths of Fe–Ti oxides
- Response of silicate chemical composition variation on thermal metamorphism of ordinary chondrites and classification of petrologic types: the case of L chondrites from Grove Mountains, Antarctica
- Hydrogeochemical characteristics and its role in controlling arsenic mobilization in a shallow aquifer
- Constraints on unconsolidated pyroclastic flow sediments related REE enrichments originated from potassic-alkaline Go¨lcu¨k stratovolcano: Darıdere-Direkli-Yakao¨ren (DDY) table 4deposits,southwestern Anatolia of Turkey
- Fluoride ions in groundwater of the Turkana County, Kenya, East Africa
- Distribution of functional microorganisms and its significance for iron, sulphur, and nitrogen cycles in reservoir sediments