Nonlinear dynamics of cell migration in anisotropic microenvironment∗
2021-09-28YanpingLiu刘艳平DaHe何达YangJiao焦阳GuoqiangLi李国强YuZheng郑钰QihuiFan樊琪慧GaoWang王高JingruYao姚静如GuoChen陈果SilongLou娄四龙andLiyuLiu刘雳宇
Yanping Liu(刘艳平),Da He(何达),Yang Jiao(焦阳),Guoqiang Li(李国强),Yu Zheng(郑钰),Qihui Fan(樊琪慧),Gao Wang(王高),Jingru Yao(姚静如),Guo Chen(陈果),Silong Lou(娄四龙),and Liyu Liu(刘雳宇),‡
1Chongqing Key Laboratory of Soft Condensed Matter Physics and Smart Materials,College of Physics,Chongqing University,Chongqing 401331,China
2Spine Surgery,Beijing Jishuitan Hospital,Beijing 100035,China
3Department of Physics,Arizona State University,Tempe,Arizona 85287,USA
4Materials Science and Engineering,Arizona State University,Tempe,Arizona 85287,USA
5Beijing National Laboratory for Condensed Matter Physics and CAS Key Laboratory of Soft Matter Physics,Institute of Physics,Chinese Academy of Sciences(CAS),Beijing 100190,China
6Department of Neurosurgery,Chongqing University Cancer Hospital,Chongqing 400030,China
Keywords:cell migration,nonlinear behavior,motility parameter,acceleration profile,anisotropic microenvironment
1.Introduction
Cell migration[1,2]is a basic process,which is essential for the normal development of tissues and organs.[3]In particular,a wide range of physiological and pathological processes are involved in cell migration,such as immunological responses,[4]wound healing,[5–7]embryogenesis,[8–11]nervous development.[9,10]However,governed rigorously by complex intra-cellular signaling pathways(ICSP)[12–16]and the extra-cellular matrix(ECM),[2,17–21,23,24]the ill-regulated cell migration leads to many human diseases,[25]among which cancer[26]is the most representative.
As a ubiquitous phenomenon in biology,[1,2]cell migration has been one of the research hotspots,which attracts a lot of attention from mathematicians,physicists and biologists in the past several decades.Initially,cell migration is only viewed as random walk,[27]which is also referred to as Brownian motion.[28,29]For example,the motility of bacteria and eukaryotic cells in the absence of symmetry-breaking gradients.[30,31]Based on Brownian motion,researchers proposed a persistent random walk model(PRW),[32–35]which is highly effective to characterize isotropic cell movement in two-dimensional(2D)ECM.The PRW model obeys the following Langevin equation:[29,36,37]

In recent years,micropatterning techniques have been greatly developed,which make it possible to confine cells to a patterned geometry and further study the confined dynamics of cell migration.For example,an elastomeric stamp was used to create islands of defined shape,confining cells in predetermined locations and arrays.[38]By analyzing the switch of Human and bovine capillary endothelial cells from growth to apoptosis on micropatterned substrates,a fundamental mechanism for developmental regulation had been represented to explain the role of local geometric patterns in regulating cell growth and viability.[39]In addition,the specific micropatterns and statistical analysis of cell compartment positions indicate that ECM geometry can determine the orientation of cell polarity and also plays an important role in developmental process.[40]Moreover,other geometries have been manufactured,e.g.,one-dimentional tracks,[41,42]microratchets,[43,44]micro-structural channel arrays,[45,46]and two-state micropatterns,[23,47,48]etc.,in which cell migration experiments can be performed and useful measures such as cell migration speed and persistence(time)can be extracted to quantify cell motility.[49–51]
Except for the micropatterned geometries,some in vitro cell migration experiments have been performed to study the role of ECM in determining the behaviors of cell migration.[52]For example,the persistence-driven durokinesis has been observed,which states that cells behave differently on substrates with different rigidities,i.e.,cell migration is more persistent on stiffer substrates.[53]Different from the substrates,another crucial component is collagen fibers in ECM,which also greatly affects the behaviors of cell migration.[54,55,57–59]For example,aligned collagen fibers can guide MAD-MB-231 breast cancer cells to invade into rigid matrigel in a constructed ECM,[60]as well as the invasion of cell into 3D funnel-like matrigel interface in a micro-fabricated biochip.[22]
Although a lot of works including numerical simulations and in vitro cell experiments,have been done to study the nature of cell migration in complex ECM,[20]few works are involved in the effects of anisotropy of ECM on cell migration dynamics in term of acceleration profiles.In this work,we introduce the PRW and APRW models to simulate cell migration in anisotropic ECM[61,62]and study the role of anisotropy in regulating cell migration,e.g.,nonlinear and non-monotonic dynamics,by numerical simulations and in vitro cell experiments.The results illustrate that the anisotropy is universal in complex ECM,which can be incorporated into persistent random walk model to describe in vitro migration of Dictyostelium discoideum and MCF-10A mammary epithelial cells on 3D collagen gel,to some extent.
The rest of the paper is organized as follows.In Section 2,we apply both quantitative and qualitative approaches to analyze the differences between cell migrations simulated by PRW and APRW models in numerical simulations,especially the analysis of velocity auto-covariance function.In Section 3,we compute and analyze acceleration profiles,exploring the effects of different combinations of motility parameters on cell dynamics based on phase diagram.We also discuss the mechanisms and physical insights of the non-monotonic behaviors,combining with the force exerted on migrating cells.In Section 4,we perform in vitro cell migration experiments,and verify universality of nonlinear dynamics and the consistence of non-monotonic behaviors with the results from numerical simulations by fitted motility parameters.Conclusions and discussion are given in Section 5.
2.Two dynamics models describing cell migration
In this section,we aim to introduce two dynamics models describing cell migration in anisotropic ECM.One is the persistent random walk model(PRW),and another is the anisotropic persistent random walk model(APRW).After applying these two models to generate cell migration trajectories in the x–y plane,we initially investigate the differences of cell migration properties due to the differences of ECM.
2.1.Isotropic persistent random walk model
In the past several decades,many of physical models have been developed by researchers to characterize cell migration in certain circumstances.Especially,the inspired PRW model plays an important role and is governed by Eq.(1)in the form of velocity components,as follows:

where Px,Py,Sx,and Syare persistence times and migration speeds,respectively on the x and y axes,all of them are used to quantify cell migration capability.The displacements during cell migration in each time step ofΔt are defined as

whereΔx andΔy are the displacements of cell location on the x and y axes,and the termsαx,αy,Fx,and Fyare memory factors and noise amplitudes,respectively,they are given by


The PRW model above[cf.Eqs.(2)–(7)]has been widely used to describe the isotropic cell movement in 2D ECM,which denotes that the abilities of cells to move are the same for all directions,there is no preferential direction.Note that the PRW model exhibits a significant characteristic that the velocity auto-correlation function(VACF)[21,63]has the following form:

where n is the dimension of ECM in which cell migrates,which can be set as 1,2 or 3.τis the time lag between any two frames of cell trajectory.D is the diffusion coefficient,which is related to persistence time P and migration speed S,as demonstrated in Ref.[61].The above VACF indicates that the cell’s memory of past velocities satisfies a single-exponential decay.When taking a limit of time lagτ(e.g.,infinite),cells can barely remember past velocities,which means that cell migration behaves like the random walk.
After integrating the velocity auto-covariance function twice,we can gain an expression for the mean-square displacement(MSD),[64]as follows:

where n,S,and P are the same as those in Eqs.(1)and(8).
2.2.Anisotropic persistent random walk model
Unfortunately,although the PRW model exhibits good performance in describing cell migration in isotropic ECM,it is not appropriate to characterize cell migration in 3D ECM.Differing from 2D cell migration,the 3D cell migration displays high anisotropy,which is mainly caused by the effective substrate stiffness and the physical properties of 3D ECM,e.g.,collagen fibers and pore size.The former indicates that cell imaging direction relative to substrate plane will lead to differently persistent migration trajectories,i.e.the persistence reaches maximal value when the direction is perpendicular to the plane,while the latter will affect the local properties of trajectory,producing the time-varying characteristics different from the 2D migration.In order to address inappropriateness,Wu et al.considered the anisotropy of 3D ECM and proposed the anisotropic persistent random walk model(APRW),see details in Ref.[63].In numerical simulations,we make motility parameters(Pxand Sx)on the x axis differ from the counterparts(Pyand Sy)on the y axis,corresponding to anisotropic migration.
To explore mechanisms of cell migration in anisotropic ECM,we present comparisons of results obtained from PRW and APRW models,as shown in Fig.1.Firstly,we simulate cell migration in x–y plane by using the two models above,in which the sampling time is 1 min.Note that we do not consider the effect of localization error(σpos),because the localization error does not affect the nature of cell migration.Obviously,the migration trajectories[c f.Figs.1(a)and 1(d)]display qualitatively differences,i.e.,the trajectory simulated by APRW covers a greater territory in x axis than that in y axis,while the trajectory simulated by PRW almost covers the same territories for x and y axes,according to the scales of axis.In other words,the trajectory simulated by APRW has a preferable direction,which is a direct proof of anisotropy,differing from the isotropic case(PRW).
Furthermore,we compute instantaneous velocity components vxand vyby applying the formula v=dr/dt(averaged distance every 1 min).The resulting velocity components are exhibited by histograms,as indicated in Figs.1(b)and 1(e).Clearly,the distribution of vx[upper panel in Fig.1(b)]is nearly same as that of vy[lower panel in Fig.1(b)],both of them can be fitted by normal Gaussian distributions(see the black lines).The red arrows mark the points of 0µm/min,corresponding to the peaks of these distributions,which indicate these distributions are symmetry and possess the same probabilities for cell to move forward and backward.The analysis of velocity illustrates that cell migration simulated by PRW is consistent with the OU process,to some extent.Similarly,the counterparts[c f.Fig.1(e)]calculated from APRW also satisfy normal Gaussian distributions with mean values of 0µm/min,but with a larger difference on the values of variance,which is the consequence of the anisotropic motility parameters in APRW model.Thus,the cell migration in x or y axis meets the OU process,and can be described by different PRW models.
For gaining more insights into the effect of anisotropy on cell migration,we introduce an approach to compute velocity auto-covariance function(VAC),[65]based on velocity components,see details in Figs.1(c)and 1(f).The black points represent the values of VAC,and the colored dotted lines are auxiliary in log–lin axis,indicating exponential decays in lin–lin axis.Interestingly,we discover an obvious difference in VAC profiles,i.e.,the VAC profile follows a single-exponential decay(linearity in log–lin axis)for isotropic case[red dashed line in Fig.1(c)],while a double-exponential decay(nonlinearity in log–lin axis)for anisotropic case[red and blue dashed lines in Fig.1(f)].There is no doubt that the nonlinear behavior contains two migration modes:one is quantified by parameters Pxand Sx,while another is quantified by Pyand Sy,which are consistent with the results obtained from Fig.1(e),i.e.,cell migration in x or y axis satisfies PRW model with different motility parameters.Further,one has access to more insights into the double-exponential behavior by referring to Ref.[61].
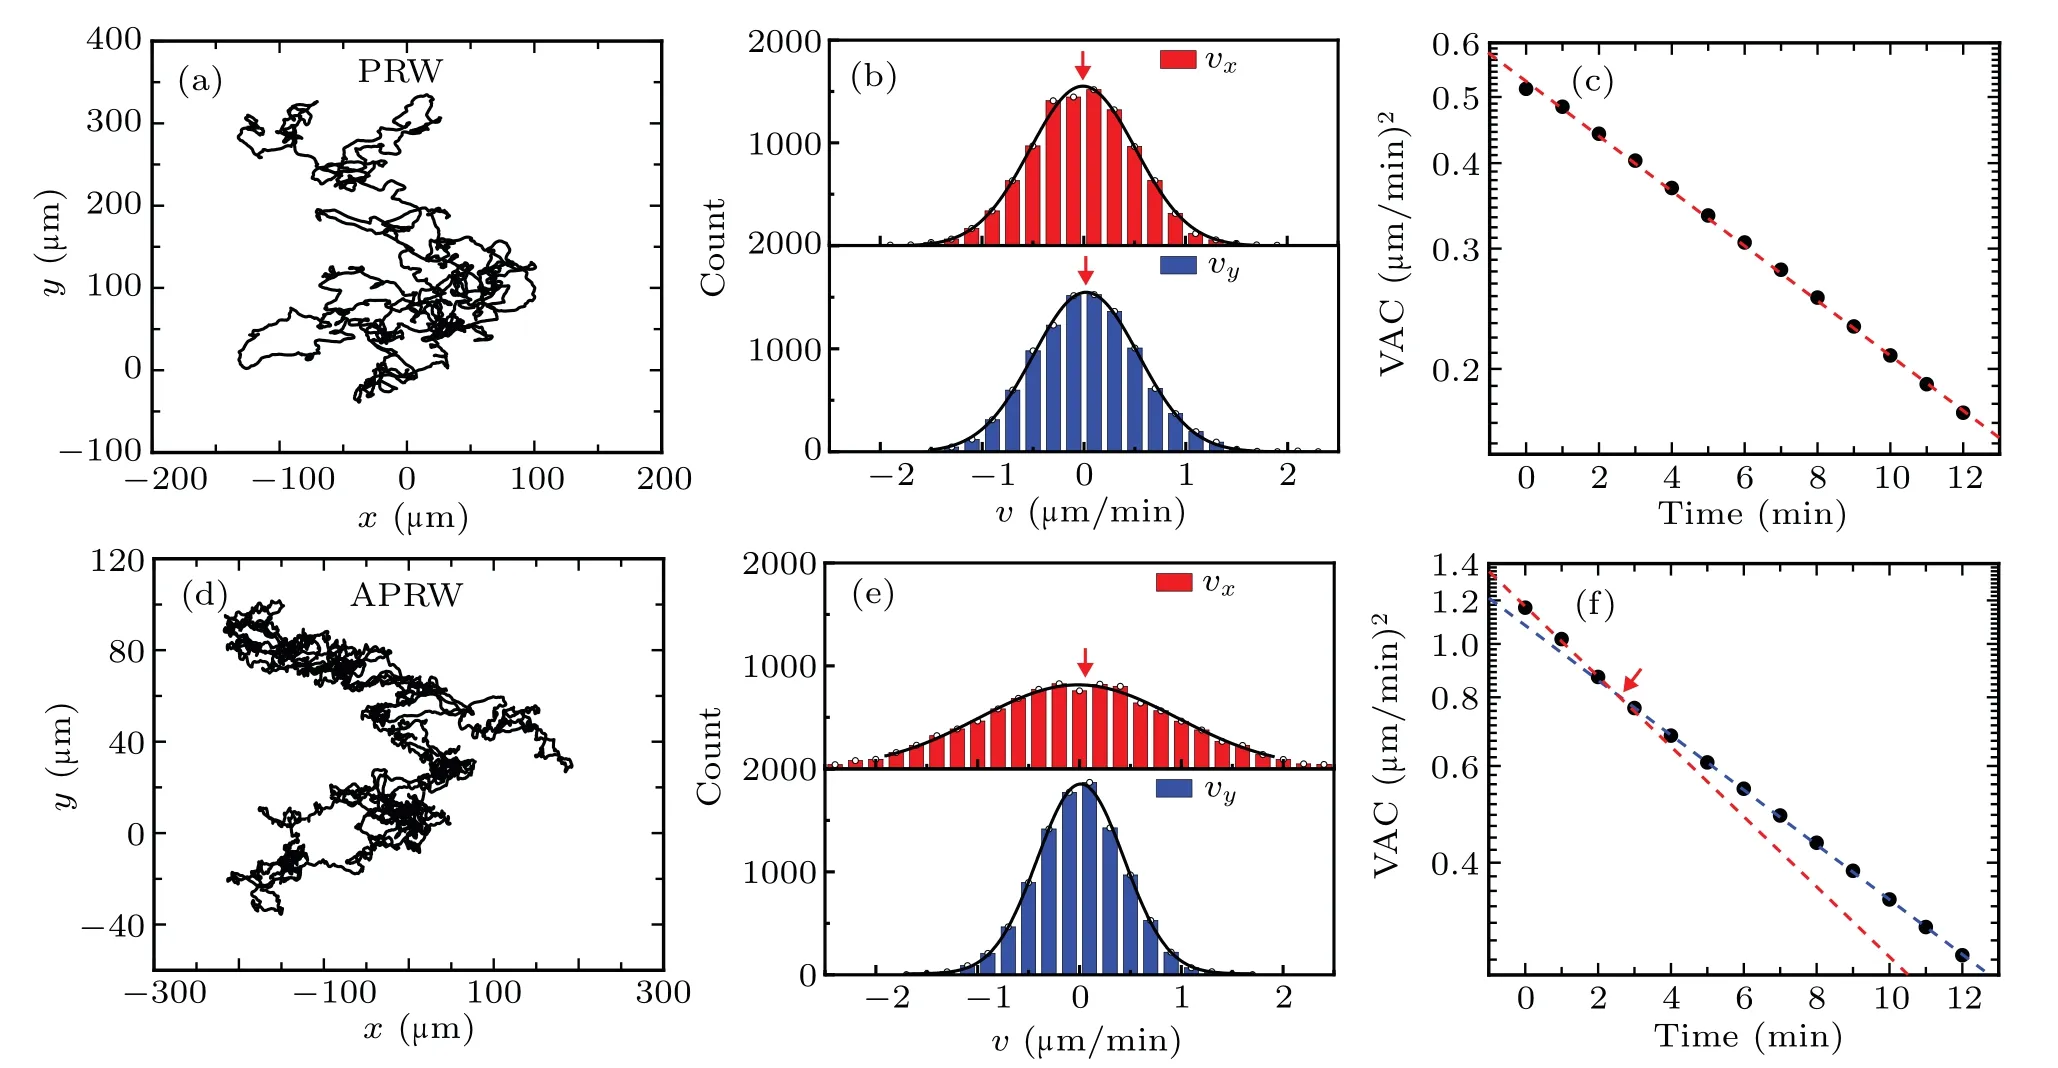
Fig.1.Comparisons of cell migration simulated by PRW and APRW models.(a)Trajectory starting at the origin(0,0)in x–y plane and sampled with time intervalΔt=1 min.The number of recorded frames is N+1=10001(black line).The migration trajectory is simulated by PRW model with a set of parameters(Px=Py=10 min,Sx=Sy=0.5µm/min).(b)Distributions of velocity components(red for vx and blue for vy).The migration velocity can be computed from formula v=dr/dt.(c)Velocity auto-covariance function(black points)based on PRW model.(d)–(f)The captions are corresponding to panels(a)–(c),but the migration trajectory in panel(d)is simulated by APRW model with a set of parameters(Px=10 min,Py=1 min,Sx=1.0µm/min,Sy=0.5µm/min).The colored dashed lines are auxiliary,and each color corresponds to a single-exponential decay.
3.Anisotropy of ECM triggers the nonlinear cell dynamics
To investigate the effect of anisotropy on cell migration,we apply formula a=dv/dt to compute the acceleration in different manners,as a function of instantaneous velocity.By analyzing the acceleration profiles,we investigate the role of anisotropy in regulating cell migration dynamics in anisotropic ECM.
3.1.Linear cell dynamics
In Fig.1,we analyze the cell migration simulated by PRW and APRW models,and find the latter is consistent with OU process to some extent,and anisotropy does affect cell behavior.To explore the mystery of cell dynamics and verify the effect in other aspects,we firstly compute acceleration components axand aybased on the isotropic trajectory in Fig.1(a).The scatter diagrams[cf.Fig.2(a)]of acceleration components axand ayare plotted against the corresponding velocity components vxand vy,respectively.The corresponding binaveraged acceleration components in Fig.2(b)show that they decrease linearly as the velocity components increase.Further,the statistical histograms of the acceleration components also manifest that both of the acceleration components are fitted well by the Gaussian distributions with mean values smaller than 0µm/min2,as shown in Fig.2(c).With the same meanings,the red arrows mark the points of 0µm/min2,and it is obvious that the peaks of the Gaussian distributions are slightly smaller than 0µm/min2,corresponding to the decreasing negative accelerations in Fig.2(b).
Next,we explore the relationship between acceleration components parallel and orthogonal to velocity,respectively.The acceleration components apand aoscattered in Fig.2(d)are generated as follows:(i)picking any two successive velocities computed from cell migration trajectory,(ii)computing the components of second velocity relative to the first velocity,(iii)calculating acceleration components parallel and orthogonal to the first velocity,and(iv)plotting acceleration components scatters against migration velocity.
The bin-averaged acceleration components apand aoin Fig.2(e)clearly show that they are subject to different trends as the velocity increases.The bin-averaged aohardly varies with the velocity and have a mean value of 0µm/min2,while the bin-averaged aplinearly decreases with the increase of velocity.Note that the fluctuation of bin-averaged acceleration components corresponding to high velocity,e.g.,the interval 1.25µm/min~2.0µm/min in Fig.2(e),is due to the small sample size[see the sparse points in Figs.2(a)and 2(d)].This linear decreasing behavior[cf.Fig.2(e)]is a characteristic of OU model,as indicated in Eq.(10).It is clear that cell acceleration is a random vector for any time t,because of the presence of Gaussian white noise.What is more,the random vector has an expectation value,as follows:which characterizes the linear decreasing behavior in Fig.2(e)and its component forms also describe the same behaviors in Fig.2(b).The term−1/P is the slope of expectation value,and it determines how fast the acceleration component aplinearly decreases.In Fig.2(f),the distribution of apis asymmetric and the mean value of the distribution is smaller than 0µm/min2,which differs from that for ao,but is the same as those in Fig.2(c).

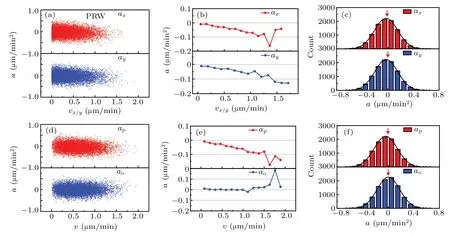
Fig.2.Linear dynamics of cell migration in isotropic ECM.(a)The computed acceleration components parallel to x axis(red for ax)and parallel to y axis(blue for ay),plotted against cell migration velocity components(vx and vy).(b)The bin-averaged acceleration components as functions of migration velocity components(vx and vy).(c)Distributions of acceleration components ax and ay.(d)The computed acceleration components parallel(red for ap)and orthogonal(blue for ao)to the cell migration velocity,plotted against cell migration velocity(v).(e)The bin-averaged acceleration components,as functions of migration velocity.(f)Distributions of acceleration components ap and ao.
3.2.Nonlinear cell dynamics
In what follows,we continue to analyze anisotropic cell migration dynamics in the same manner as that applied in isotropic case.Here,the analysis of cell dynamics is based on the anisotropic trajectory shown in Fig.1(d),and the resulting calculations are displayed in Fig.3.Note that the distributions of acceleration components axand aystill satisfy Gaussian distributions with mean values smaller than 0µm/min2,despite the large difference between these two scatter diagrams in high velocity domain.
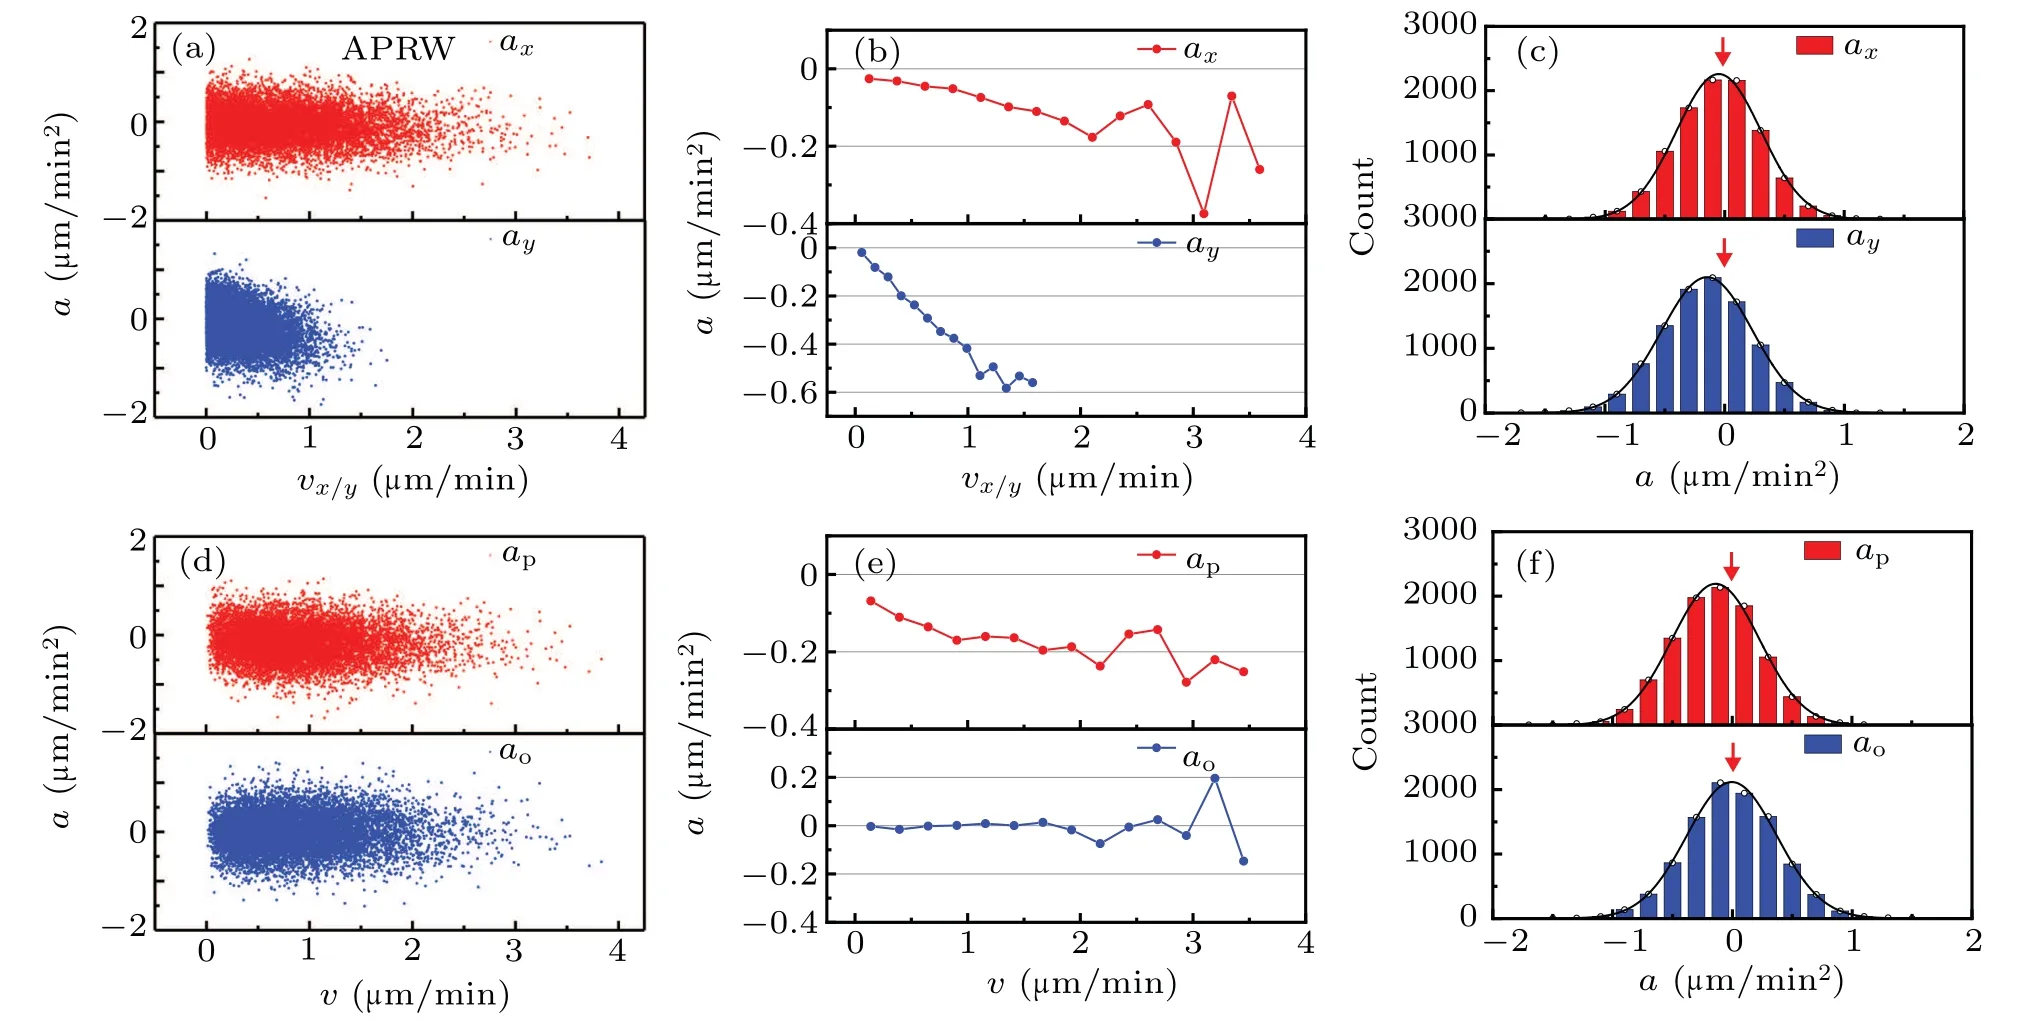
Fig.3.Nonlinear dynamics of cell migration in anisotropic ECM.The captions are identical with those for Fig.2,but the results corresponds to cell migration trajectories simulated by ARRW model.
There is an interesting phenomenon that the bin-averaged acceleration component apdecrease nonlinearly over the velocity in Fig.3(e),which differs from the linear decrease in Fig.2(e).Thus,we argue that the anisotropy of ECM is the cause of nonlinearity in acceleration component ap.Further,it is attractive that both the one-dimensional(1D)migrations on the x and y directions are consistent with OU process,but the resultant motion of these two 1D migrations exhibits a novel property,which is different from that predicted by OU process.
In contrast to the expectation value described by Eq.(10)for the PRW model,we deduce the similar relationship on the x and y axes for the APRW model,which is defined as follows:

This expression indicates that the acceleration component in individual x or y direction follows a linear decrease,but a nonlinear decrease for the resultant motion.Here,the nonlinearity is mainly the consequence of different values of Pxand Py.
3.3.The effect of anisotropy on cell dynamics
In this section,we perform several control simulations about cell migration to study how the acceleration component apchanges for different combinations of parameter values.To better quantify the anisotropy of ECM,we introduce a quantity,i.e.,anisotropy indexΦ,[61]which can be written as

Furthermore,we also define anisotropy index of persistence time and migration speed,separately.They are given as follows:
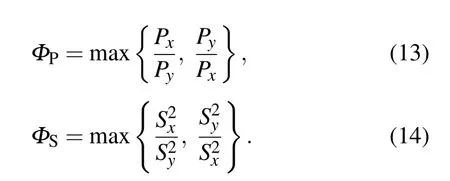
Clearly,all the indexes are dimensionless values and greater than unity.Due to the inspiration of anisotropy index,we define two concepts based on the motility parameters,i.e.,positive anisotropy(PA)and negative anisotropy(NA).The detail definition as follows:if the persistence time and migration speed in one direction(such as x axis),are greater than the values in another direction(such as y axis),respectively,then we refer the case to as positive anisotropy,otherwise it is negative anisotropy.
In Fig.4,we aim to explore how the acceleration component apchanges in the cases of positive anisotropy and negative anisotropy.Firstly,we investigate the effect ofΦPwhen Sx=Sy.As the increase ofΦPfrom 2.5 to 20.0,the approfiles become more nonlinear,corresponding to the tendency of downward concave,as shown in Fig.4(a).Based on the values of motility parameters in Fig.4(a),we just modify the values of migration speed,and make Sxgreater than Sy(PA).The approfiles become more interesting[c f.Fig.4(b)]because of a non-monotonic behavior that the values of apincrease as the increase of velocity,in the context of downward concave.See Fig.6 for more details about this non-monotonic behavior.Similarly,we make Sxless than Sy(NA),and keep other parameters constant[cf.Fig.4(c)].The approfiles change the ways they decrease,and produce the tendency of upward convex.
In a similar manner,we analyze the effect ofΦSon the ways approfiles decrease.In Fig.4(d),we make Px=Py,and increase the values ofΦSfrom 1.6 to 25.0.The approfiles clearly show that the increase ofΦSdoes not change the linearity of profiles,but the scale of profiles.When adjusting the values of persistence time and make Pxgreater than Py(PA),the approfile becomes nonlinear,forming the tendency of downward concave.As a whole,all approfiles in Fig.4(e)almost have the same tendencies,but with different scales.It means that theΦSonly changes the scale of profile,not the way approfile decreases.For the case of Pxless than Py(NA)in Fig.4(f),all approfiles almost obey the tendency of upward convex.
To vividly exhibit the transition of approfiles induced by anisotropic motility parameters,we calculate the phase diagram of apbehaviors following the procedures:
(i)referring the line segments formed by points in approfile to as vectors;
(ii)computing the angle between any two vectors;
(iii)multiplying+1 and the angle when the second vector is biased to the right relative to the first vector(i.e.,tendency of upward convex),otherwise multiplying−1 and the angle(i.e.,tendency of downward concave);
(iv)averaging the angles and plotting the phase diagram,as seen in Fig.5.
Obviously,there are four sections in this figure,i.e.,lefttop,left-bottom,right-top,and right-bottom.Left-top and right-bottom are almost represented by positive angles(red),which denotes that the corresponding approfiles possess the tendencies of upward convex.Meanwhile,the left-bottom and right-top are almost represented by negative angles(blue),indicating approfiles possess the tendencies of downward concave.In addition,the averaged angles for Px/Py=1 slightly deviate from the theoretical value 0,which is the consequence of limited data.
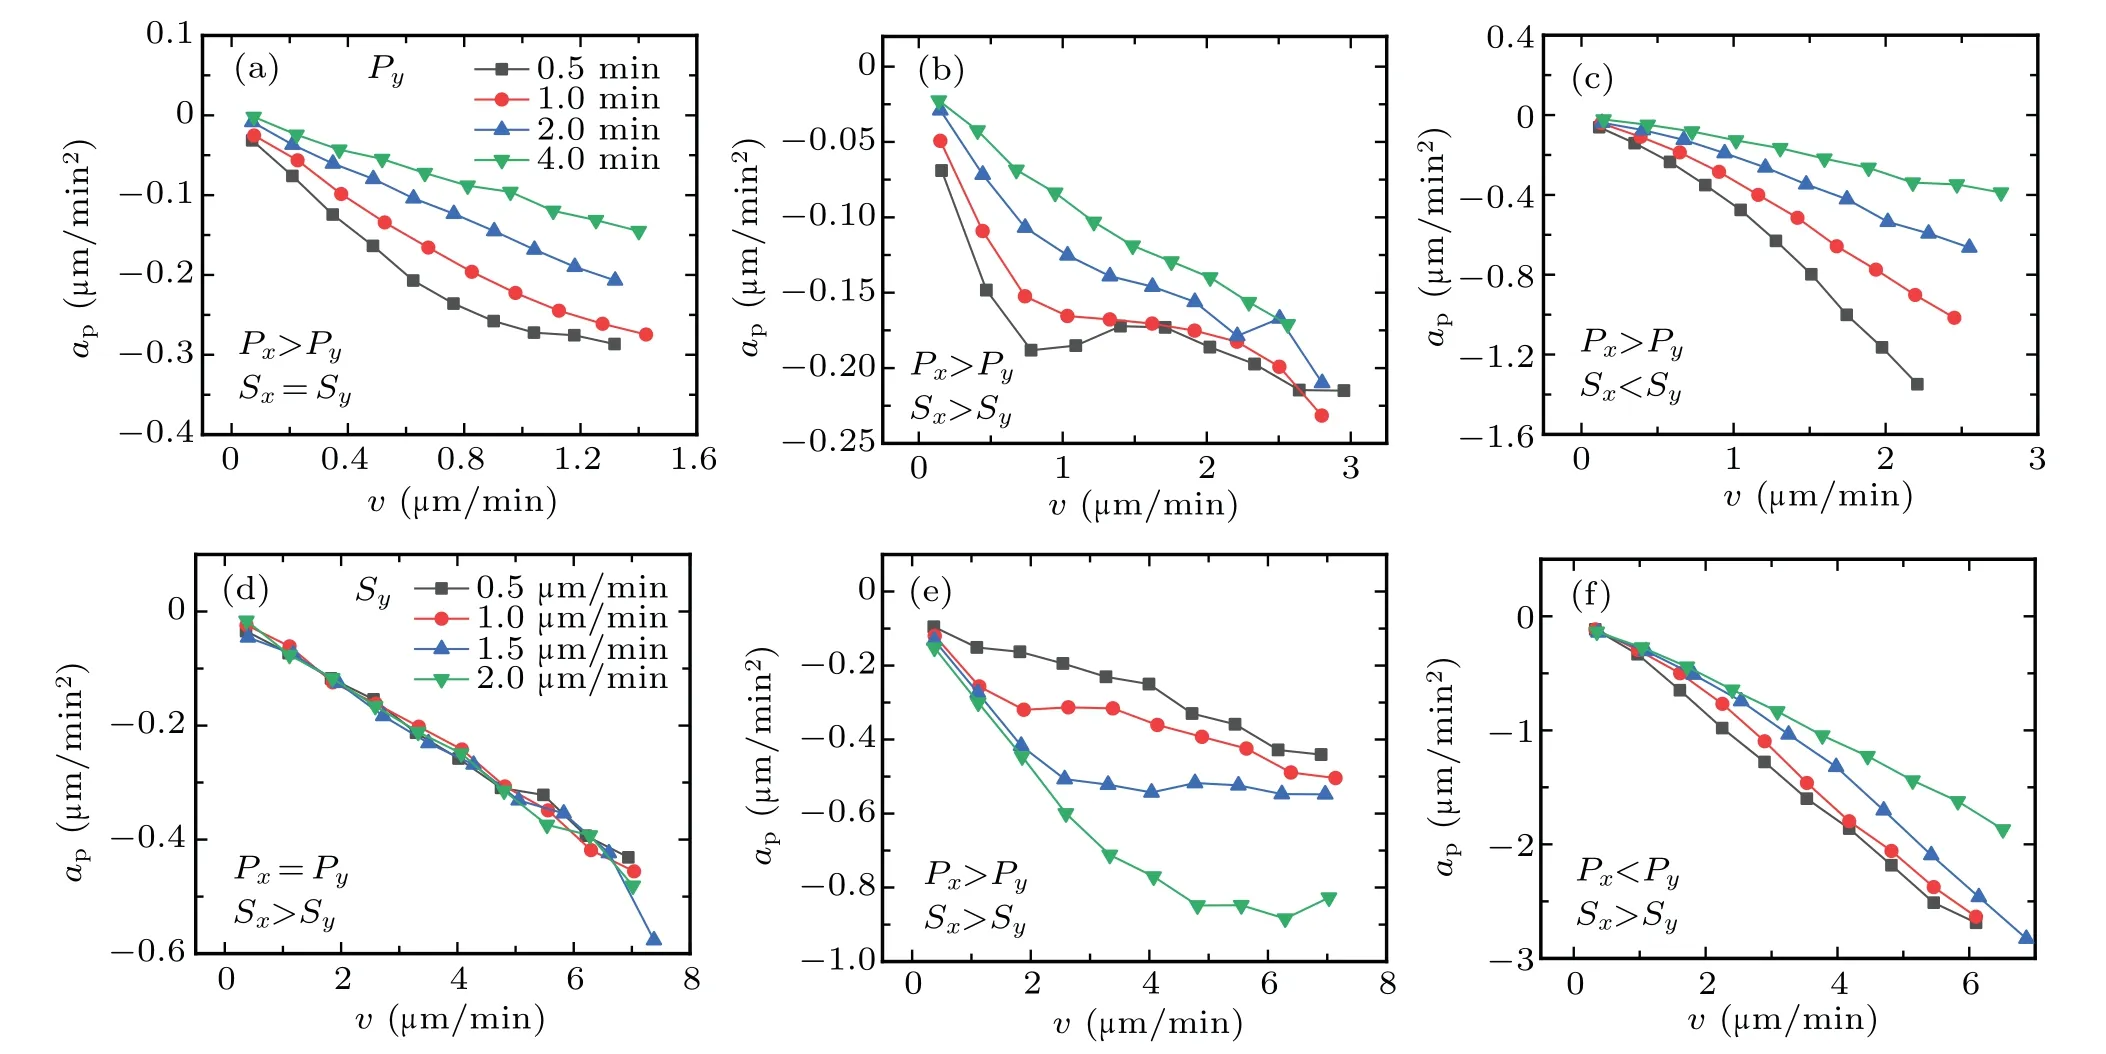
Fig.4.The effects of anisotropy on cell migration dynamics in complex ECM.(a)The effects of anisotropy of persistence time P on cell migration dynamics.Let Sx=Sy=0.5µm/min,and Px=10 min,increasing the value of Py from 0.5 min to 4.0 min.(b)The effects of anisotropy of persistence time P on cell migration dynamics in the case of positive anisotropy.The values of Px and Py are the same as those in panel(a),but Sx=1.0µm/min and Sy=0.5µm/min.(c)The effects of anisotropy of persistence time P on cell migration dynamics in the case of negative anisotropy.The values of Px and Py are the same as those in panel(a),but Sx=0.5µm/min and Sy=1.0µm/min.(d)The effects of anisotropy of migration speed S on cell migration dynamics.Let Px=Py=10.0 min,and Sx=2.5µm/min,increasing the value of Sy from 0.5µm/min to 2.0µm/min.(e)The effects of anisotropy of migration speed S on cell migration dynamics in the case of positive anisotropy.The values of Sx and Sy are the same as those in panel(d),but Px=10.0 min and Py=1.0 min.(f)The effects of anisotropy of migration speed S on cell migration dynamics in the case of negative anisotropy.The values of Sx and Sy are the same as those in panel(d),but Px=1.0 min and Py=10.0 min.
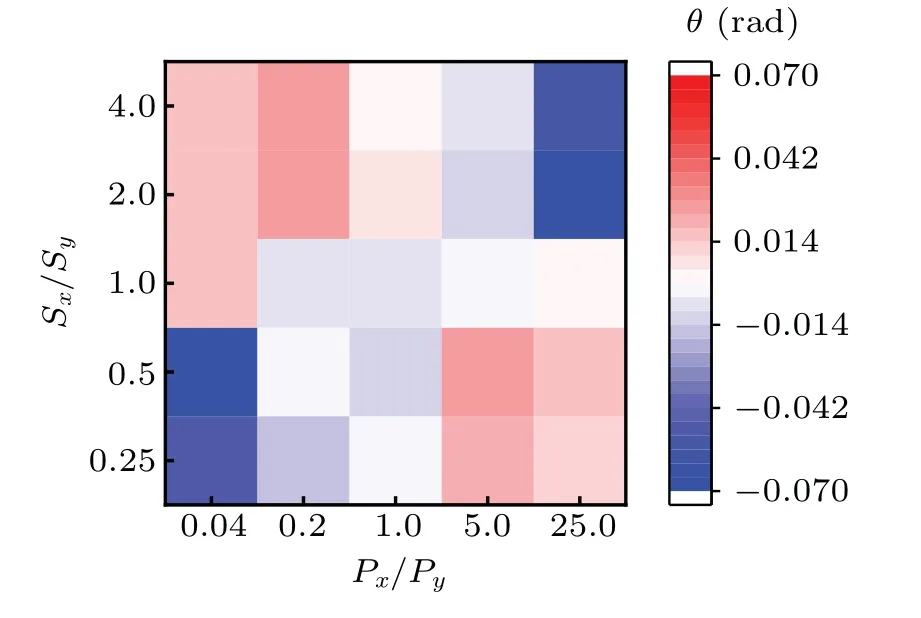
Fig.5.Phase diagram of the nonlinear behavior in complex ECM.The horizontal axis represents Px/Py,while the vertical axis represents Sx/Sy.The color bar denotes the averaged angleθcorresponding to the nonlinearity of ap profile.Px/Py=1 corresponds to the parameters Px=Py=10 min,while Sx/Sy=1 corresponds to the parameters Sx=Sy=2µm/min.
Thus,we can conclude that firstly,regardless of the values of migration speed,the anisotropy of persistence time leads to the nonlinear approfiles,see Fig.4[except for panel(d)].Secondly,the positive anisotropy produces the tendency of downward concave in the case whereΦPis small,while the negative anisotropy produces the tendency of upward convex,see Figs.4(b)–4(c)and 4(e)–4(f).Especially the non-monotonic behavior occurs as the increase ofΦP,in the case of positive anisotropy[see gray and red lines in Fig.4(b)].Then,increasing the anisotropy of persistence time facilitates approfile to be more nonlinear,in the cases of positive and negative anisotropy,see Figs.4(b)and 4(c).Finally,increasing the anisotropy of migration speed only changes the scale of approfile,not the way it decreases,see Figs.4(e)and 4(f).The phase diagram in Fig.5 also validates that the anisotropic motility parameters(or ECM)will affect the nonlinear dynamics of cell migration.
3.4.Non-monotonic cell dynamics in anisotropic ECM
In Fig.4(b),we discover that a non-monotonic behavior occurs in approfile in the case of positive anisotropy,especially for a large anisotropy of persistence time(ΦP).In what follows,we explicitly regulate theΦPto study how the nonmonotonic behavior changes in the case of positive anisotropy.
To capture the major changes of approfile,we mark two representative points in approfile,which are concave and convex,respectively.One is viewed as valley,while another is viewed as peak,as indicated in Fig.6(a).We increase the values of Pyfrom 0.15 min to 2.15 min,for a given set of parameters(Px=20 min,Sx=1.0µm/min,and Sy=0.5µm/min).Note that theΦPranges from 133.3 to 9.3 whenΦS=2.As the value of Pyincreases,the abscissa(blue scatters)of the valley increases stepwise.The three speed domains correspond to 0.15 min~0.5 min,0.5 min~1.25 min,and 1.25 min~2.15 min,respectively,as indicated by the black ladder in Fig.6(b).However,the abscissa(red scatters)of the peak undergoes two steps,first increases and then decreases.In contrast to the way the abscissa changes,both the ordinates of the valley and the peak experience a“roller coaster”,i.e.,first decrease,then increase,and finally reach the same value,as demonstrated in Fig.6(c).The roller coaster implies two events,one is the appearance of non-monotonic behavior,and another is the disappearance of non-monotonic behavior.
To gain more insights into the relationship between the anisotropy of persistence time and the non-monotonic behavior,we study the rectangle with the valley and peak as vertexes,and its orthogonal sides are parallel to the x and y axes,respectively,see the dotted lines in Fig.6(a).Figures 6(d)–6(f)manifest that the distances between valley and peak on the x and y directions and the corresponding area obey the tendency,i.e.,increase first and then decrease.Thus,we obtain an overall picture about the changes of approfile when changing the anisotropy of persistence time.
The non-monotonic behavior signifies that the approfile is not a monotonically decreasing function of velocity,but contains an interval where the values of apincrease.Here,we argue that,the increasing part clearly hints that the net force on the cell gradually decreases,as the velocity increases.Thus,we can deduce the force exerted on cell during migration,which is given as

where Fdis the force that drives the cell forward,Fris the force that impedes cell migration,and F∗is the net force.The above equation(15)is analogous to Eq.(1),the Gaussian white noise corresponds to Fd,while−v/P corresponds to Fr.Considering that the Gaussian white noise can be viewed as constant in the regime of long time scale,thus the term Frwill lead to the changes in approfile,especially non-monotonic behavior.The behavior indicates that the greater the velocity of one cell,the less the resistance it will experience,which does not conform to the widely accepted law,i.e.,the greater the velocity of a body,the greater the resistance it will experience.
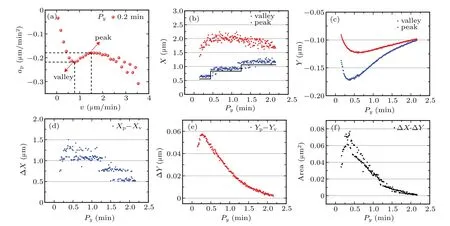
Fig.6.Positive anisotropy leads to non-monotonic cell dynamics.(a)A recessed part of the acceleration component(ap)parallel to cell’s velocity plotted against migration velocity(red point),for a given set of parameters(Px=10 min,Py=0.2 min,Sx=0.8µm/min,and Sy=0.6µm/min).(b)The abscissa of valley(blue)and peak(red)of ap profile as a function of Py.The value of Py ranges from 0.15 min to 2.15 min for a given set of parameters(Px=20 min,Sx=1.0µm/min,and Sy=0.5µm/min).(c)The ordinate of valley(blue)and peak(red)of ap profile as a function of Py.(d)The difference(blue)between the abscissa of valley and peak of ap as a function of Py.(e)The difference(red)between the ordinate of valley and peak of ap profile as a function of Py.(f)The area formed by peak and valley as a function of Py.
4.Nonlinear dynamics for in vitro cell migration
We have analyzed the effect of anisotropy on cell migration dynamics based on numerical simulations,i.e.,discussing the changes in acceleration profiles,and find there is a nonmonotonic behavior that acceleration component apgradually increases in a certain velocity interval.In this section,we analyze the in vitro cell migration experiments and verify the universality of nonlinear and non-monotonic behaviors and the consistence with the results predicted by APRW model by fitted motility parameters.
4.1.The non-monotonic behavior for Dictyostelium discoideum
In this part,we follow the procedure used above to analyze in vitro experimental data,which are obtained from Ref.[15].Note that the authors analyzed the role of Arpin protein in regulating the directionality of cell migration,we only choose the migration data for wild-type(WT)Dictyostelium discoideum.The corresponding results are shown in Fig.7.
We firstly compute the acceleration components apand ao,which are shown in Figs.7(a)and 7(c).On the basis of the acceleration scatter diagrams,we bin-averaged the apand ao,respectively,as indicated in Figs.7(b)and 7(d).The approfile also exhibits the non-monotonic behavior,i.e.,there is an non-monotonic part where the approfile gradually increases as the velocity increases.The non-monotonic behavior is almost identical with that shown in Fig.6(a).Especially,the aoprofile fluctuates around at 0µm/min2,which is close to the results shown in Figs.2 and 3.
In addition,we also compute VAC and MSD,as indicated in Figs.7(e)and 7(f).The VAC obeys a nonlinear exponential decay in log–lin axis,which mainly contains two migration modes,one is marked by red dotted line and another is marked by blue dotted line.Here,the nonlinear VAC is consistent with that in Fig.1(f).Following the procedure in Ref.[61],we fit the calculated VAC with the superimposed form of theoretical formula defined in Refs.[51,65]and obtain the fitted VAC and the corresponding motility parameters,as seen in Fig.7(e).The fitted motility parameters are P1=0.339 min,S1=6.245µm/min,P2=0.036 min,S2=4.913µm/min,respectively,which satisfies the criteria of positive anisotropy because of P1>P2,S1>S2.In addition,the MSD in Fig.7(f)lies at the interval ranging from the red line with a slope 2 to the blue line with a slope 1,which illustrates that the migration of Dictyostelium discoideum can be described by persistent walk model,e.g.,PRW or APRW model to some extent.The MSD also exhibits distinguishable behaviors at different time scales,i.e.,it grows quadratically just like ballistic motion in the regime of short lag-times(<0.8 min),while grows linearly just like pure Brownian motion in the regime of long lag-times(>0.8 min),thus there must be a point reflecting the ensemble-average characteristics of cell migration.Moreover,in the regime of short lag-times,the MSD gradually deviates from the ballistic motion,which indicates that cell gradually loses the memory of the past velocities as the lag-time increases.
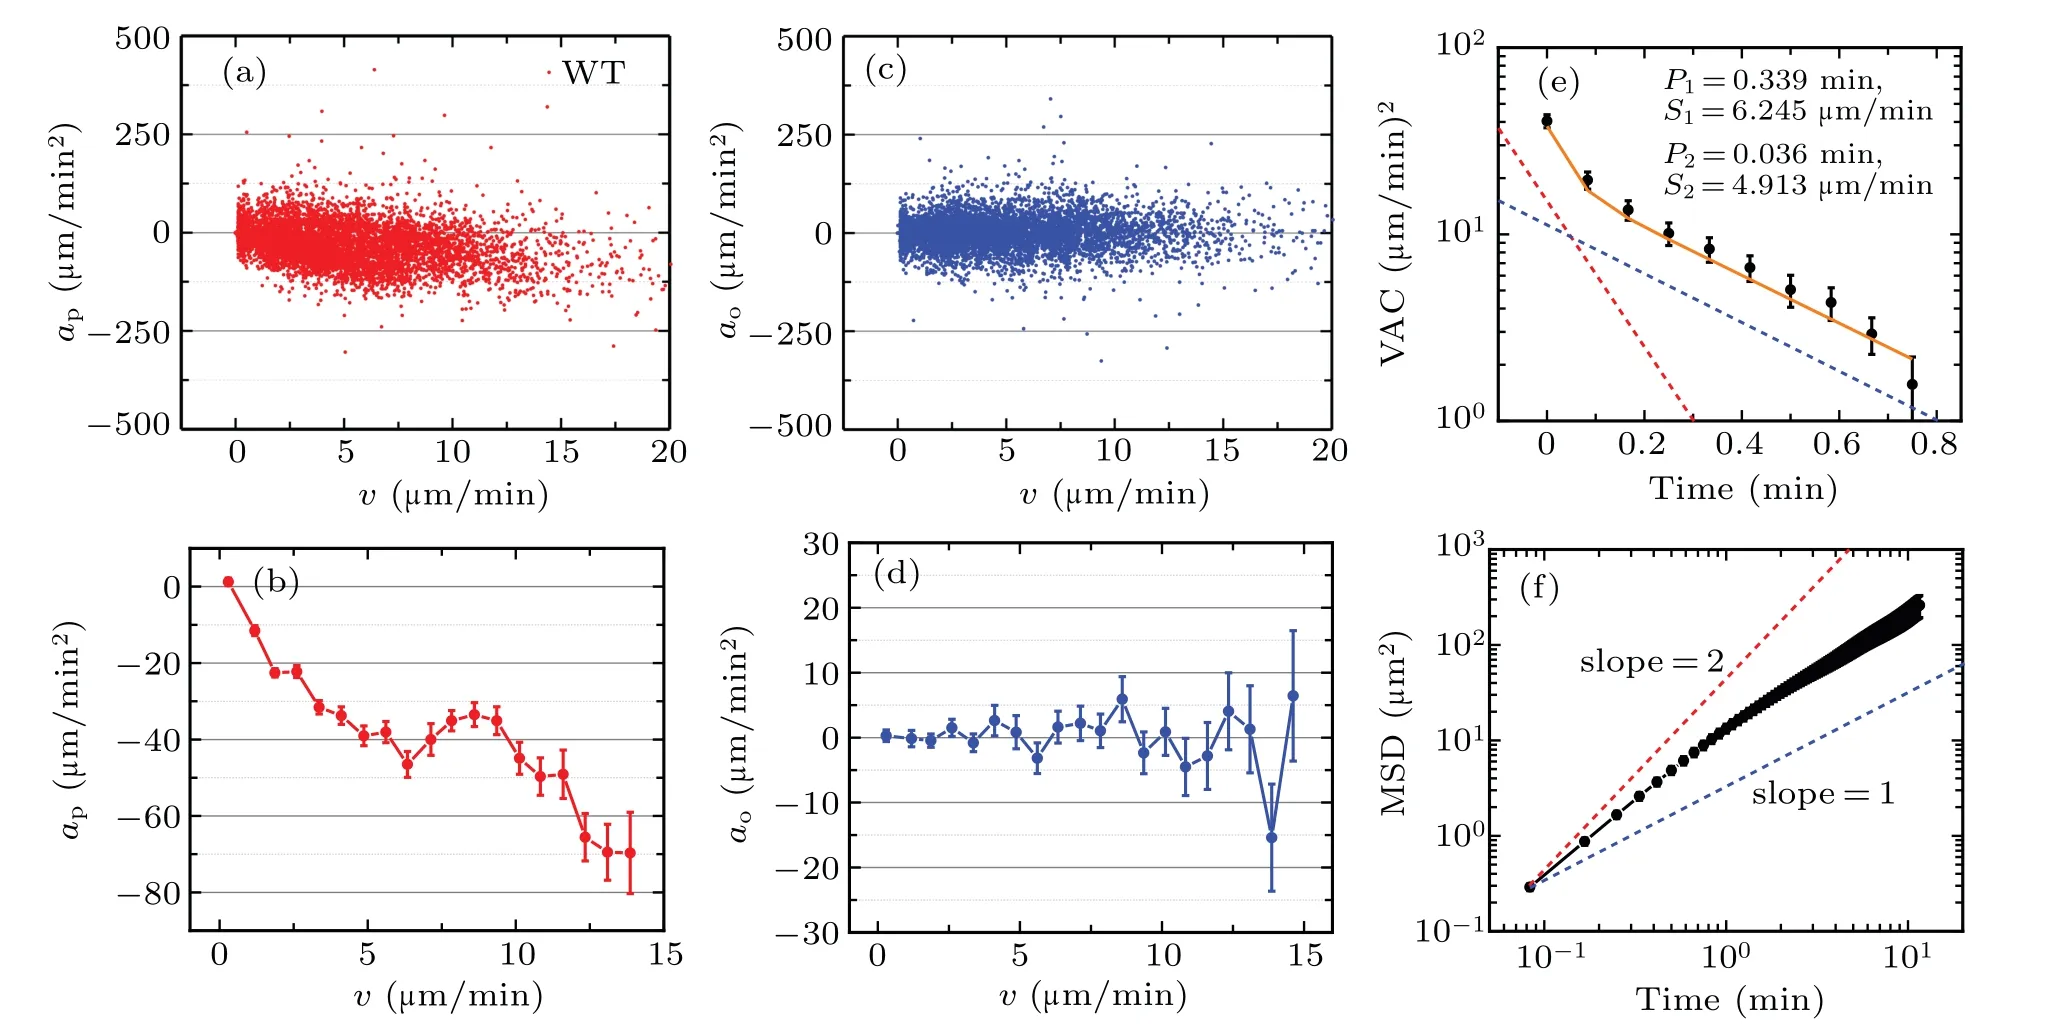
Fig.7.The non-monotonic migration dynamics for wild-type Dictyostelium discoideum.(a)The computed acceleration components ap plotted against cell migration velocity.(b)The bin-averaged acceleration component ap as a function of migration velocity.(c)The computed acceleration components ao plotted against cell migration velocity.(d)The bin-averaged acceleration component ao as a function of migration velocity.(e)Velocity auto-covariance function as a function of time.The red and blue dotted lines denote two single-exponential decay functions and the orange line denotes the fitted results.(f)Mean-square displacement as a function of time.The red dotted line corresponds to the ballistics motion with a slope 2,while the blue dotted line corresponds to the Brownian motion with a slope 1.The data are represented by mean±SE(standard error of the sample mean);the number of cells is 43.
Based on the analysis above,it is reasonable to conclude that:(i)the migration of wild-type Dictyostelium discoideum,at least can be described by APRW model because of the nonlinear VAC and the non-monotonic acceleration ap;(ii)the non-monotonic behavior in acceleration profile illustrates that motility parameters meet the condition of positive anisotropy and there is a greater difference between two persistence times(high anisotropy);(ii)the fitted motility parameters fitted from VAC do validate the consistence with the results from APRW model.
4.2.The nonlinear behavior for MCF-10A mammary epithelial cells migration on 3D collagen gel
To verify the universality of the nonlinear cell dynamics and the consistence with the numerical results,we analyze the in vitro cell migration data,i.e.,MCF-10A mammary epithelial cells migration on 3D collagen gel,see more detail experimental procedures in Ref.[50].We perform the same calculations and obtain the corresponding results in Fig.8.
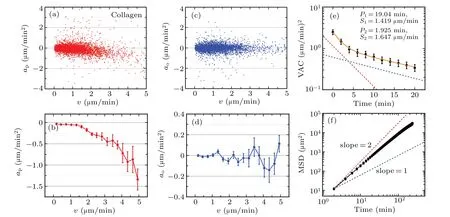
Fig.8.The nonlinear migration dynamics for MCF-10A mammary epithelial cells migration on 3D collagen gel.The captions are identical with those in Fig.7.The data are represented by mean±SE;the number of cells is 42.
When compared with results in Fig.7,we find the VAC and MSD[cf.Figs.8(e)and 8(f)]obey the same tendencies with those for wild-type Dictyostelium discoideum.The only difference is that the approfile shows no nonmonotonic behavior,but nonlinear,which is similar with that in Fig.4(c).Meanwhile,the fitted motility parameters from VAC are P1=19.04 min,S1=1.419µm/min,P2=1.925 min,S2=1.647µm/min,respectively,which satisfies the criteria of negative anisotropy because of P1>P2,S1 In this work,we firstly introduce two models,PRW and APRW,to analyze the influence of anisotropy of ECM on cell migration dynamics.Qualitatively,the trajectory pattern simulated by APRW model is more persistent than that by PRW model and the persistence is validated by VAC,i.e.,the values of VAC computed from APRW model are greater than those from PRW model for a given time lagτ.What is more,in contrast to the single-exponential decay of VAC computed from PRW model,the VAC computed from APRW model follows a double-exponential decay corresponding to two migration modes.In addition,we find that both distributions of velocity components on the x and y axes obey normal Gaussian distributions with mean values 0µm/min,which means that the cell migration on the x or y axis follows the OU process,to some extent. Secondly,we compute the acceleration components,e.g.,ax,ay,ap,ao,and investigate the distributions of different acceleration components.The results indicate both the acceleration components on the x and y axes are linearly decreasing functions of velocity components.This linear decrease exactly verifies the result mentioned above,i.e.,the cell migration in x or y axis follows the OU process.The acceleration component parallel to the instantaneous velocity,for PRW and APRW models,reveals different behaviors.The parallel acceleration component apis still a linearly decreasing function of velocity for PRW model,but a nonlinearly decreasing function for APRW model.Furthermore,whether or not the acceleration component deceases,is related to the mean value of distribution of acceleration component:if acceleration component is a decreasing function of velocity,then the mean value of distribution is smaller than 0µm/min2,otherwise it equals 0µm/min2. Then,to investigate the effects of combinations of motility parameters,we introduce positive and negative anisotropies by setting different parameter values in APRW model,and find that positive anisotropy leads to a downward concave in approfile,while negative anisotropy leads to an upward convex based on phase diagram.In particular,the anisotropies of persistence time and migration speed only influence the nonlinearity and scale of approfile,respectively.We further discover that the anisotropy of persistence time results in a nonmonotonic behavior occurring in approfile in the case of positive anisotropy. Finally,we follow the same procedure to analyze two types of in vitro cell migration experiments,i.e.,the migration of wild-type Dictyostelium discoideum and MCF-10A mammary epithelial cells migration on 3D collagen gel.The results indicate that the approfile for Dictyostelium discoideum show non-monotonic behavior and that for MCF-10A cells show nonlinear behavior,which are consistent with the results obtained from APRW model,especially the fitted motility parameters further validate the consistence. Our work presents the relationship between the anisotropy of ECM and cell migration dynamics in term of acceleration profile,and emphasizes the importance of the anisotropy during cell migration,especially the VAC following a double-exponential decay,the nonlinear decrease and the non-monotonic behavior of approfile.We conclude that the anisotropy of ECM in which cell migrates is the cause of the non-monotonic and nonlinear dynamics,and the APRW model can be as a suitable tool to analyze in vitro cell migration with different combinations of motility parameters.The work provides new insights into the dynamics of cell migration in complex ECM,which also has implications in tissue engineering and cancer research.5.Discussion and conclusion
猜你喜欢
杂志排行
Chinese Physics B的其它文章
- Origin of anomalous enhancement of the absorption coefficient in a PN junction∗
- Protection of isolated and active regions in AlGaN/GaN HEMTs using selective laser annealing∗
- First-principles study of plasmons in doped graphene nanostructures∗
- Probing thermal properties of vanadium dioxide thin films by time-domain thermoreflectance without metal film∗
- An improved model of damage depth of shock-melted metal in microspall under triangular wave loading∗
- Signal-to-noise ratio of Raman signal measured by multichannel detectors∗
