Quantifying aluminosilicate manganese release and dissolution rates across organic ligand treatments for rocks,minerals,and soils
2021-09-10JustinRichardsonLeAnnZuiga
Justin B.Richardson• LeAnn X.Zuñiga
Abstract Manganese is ubiquitous in terrestrial environments and most studies have focused on dissolution of Mn oxides,but aluminosilicates also release Mn.Here,we evaluated oxic Mn dissolution from six rocks and minerals(amphibolite,anorthosite,kaolinite,kyanite,muscovite,orthoclase feldspar) and soils from four Critical Zone Observatories (CZOs) under four LMWOLs treatments(catechol,citric acid,oxalic acid,control).Overall rock and mineral Mn mass-normalized release was 1.4 ± 0.5 nM μM-1 14 d-1 and dissolution rate was 2403 ± 935 nM m-2 d-1 × 10³.Overall CZO soil Mn release was 16.7 ± 5.1 nM μM-1 14 d-1 and dissolution rate was 7010 ± 2570 nM m-2 d-1 × 10³.Anorthosite and kyanite had the highest Mn dissolution rates but kaolinite and kyanite had the highest Mn mass-normalized release rates.We hypothesize the structural location of Mn,surface area,and potential inclusions of highly-weatherable-phases control Mn dissolution for rocks and minerals.CZO soils with the highest solid phase Mn had the highest Mn release and dissolution rates.Citric acid and catechol had higher Mn release and dissolution rates than the control while oxalic acid did not.For rocks and minerals,we found pH 4 had higher Mn release and dissolution rates than pH 6,but not for control treatments without LMWOL.Our study highlights that the abundance of Mn drove Mn release in soils but not rocks and minerals.Moreover,LMWOLs are important for Mn dissolution,even under acidic pH conditions.
Keywords Aluminosilicates · Weathering rates · organic acids · Critical zone · Mn oxides
1 Introduction
Manganese is an important element because of its ubiquity in terrestrial environments and its potential negative impacts on surface water and groundwater.The US Environmental Protection Agency has set a secondary maximum contaminant limit (SMCL) of 50 μg/L for Mn in drinking water (ATSDR 2008).While the regulation aims to avoid superficial issues of discoloration,Mn has been linked to neurotoxicological disorders in humans.Overexposure to Mn from drinking water has been shown affect adults and infants at low to moderately elevated concentrations (Ljung and Vahter 2007).Lifetime exposure to elevated Mn may lead to an increased risk of Parkinsonian diseases as Mn may act as a neurotoxin (Lucchini et al.2009;Michalke and Fernsebner 2014).In spite of its potential health impacts,it is estimated that 2.6 million people in the United States are consuming groundwater with elevated Mn concentrations (McMahon et al.2018).
Manganese can be released to surface and ground waters from rocks or minerals through mineral dissolution under both oxic and reductive conditions.Dissolution of Mn+2under reducing conditions from Mn oxides (e.g.MnIII/IV such as birnessite)has been extensively studied due to their high release of Mn relative to other Mn-bearing minerals(see Murray et al.1985;Petrunic et al.2005;Tang et al.2013;Sinha and Purcell 2019;Toro et al 2021).The dissolution of Mn oxides have been the primary focus because of their high Mn concentrations and fast kinetics for dissolution under acidic,reducing conditions (Duckworth et al.2009;Sinha and Purcell 2019;Toro et al 2021).The dissolution of Mn oxides under acidic-reducing conditions is highly effective with abundant reducing agents,but can be affected if other metals that can consume acidic are also released (Sinha and Purcell 2019;Moraga et al.2021).Manganese reduction reactions (Eqs.1.and 2) can occur abiotically via dissolved reductants under reducing(<0.6 V) and acidic conditions (<pH 7) (e.g.Duckworth et al.2009;Sinha and Purcell 2019;Toro et al.2021) or biotically through direct microbial reduction (e.g.Myers and Nealson 1988;Burdige et al.1992;Petrunic et al.2005;Tang et al.2013).
Manganese dissolution from Mn oxyhydroxide:

Manganese dissolution from Mn oxide

While the dissolution of Mn oxides can be an important source of Mn where they are present in the parent rock or neoformed during pedogenesis,they are not widely abundant across rock types.Instead,Mn is widely distributed in terrestrial environment through isomorphic substitution into aluminosilicate rocks and minerals.The dissolution and release of Mn-substituted aluminosilicates in soil environments can generate soluble Mn,albeit at orders of magnitude slower rates than Mn oxides due to kinetic limitations(cf Zhang et al 1996,2019;Toro et al.2021).In aluminosilicate minerals,Mn(II) substitutes for Ca,Mg,and Fe,making it abundant across nearly all lithologies but at much lower concentrations than rocks bearing Mn oxides,Mn carbonates and Mn sulfides(Gilkes and McKenzie 1988;Jordan et al.2019).
Mn substitution for Ca and release from feldspar(anorthosite):

Mn substitution for Fe and release from amphibole(ferrohornblende)
Mn substitution for Al and release from phyllosilicate(muscovite)

In soils,aluminosilicates dissolution and subsequent Mn release occurs due to acidity (pH 3.5 to 6) with protonpromoted dissolution and the presence of low molecular weight organic ligands (LMWOLs) for ligand-promoted dissolution complexation increasing Mn solubility (Duckworth et al.2009;Karolewski et al.2021).
LMWOL can drive aluminosilicate dissolution through ligand-promoted dissolution (e.g.Duckworth et al.2009;Jones et al.2018;Karolewski et al.2021),in which an organic compound can weaken metal–oxygen bonds (e.g.Al to O studied by Stumm et al.1985) by decreasing the activation energy and increasing the solubility of metals(Zhang and Bloom 1999).The enhanced dissolution of the aluminosilicate can increase Mn dissolution by increasing Mn solubility through greater chelation with LMWOL ligands (Fig.1;Luther et al.2015;Lazo et al 2017).However,the functional groups on LMWOL (e.g.carboxyl,hydroxide) are pH-dependent and may not be available for surface interactions if protonated under acidic conditions (Stone and Morgan 1984;Zhang and Bloom 1999;Lazo et al.2017).Notably,proton-promoted dissolution may positively interact with ligand-promoted dissolution and enhance mineral dissolution by several orders of magnitude (Chin and Mills 1991;Stumm 1997;Lazo et al 2017).This may be mineral specific as dissolution rates can exhibit limited variations in dissolution with changing acidity.As a prime example,kyanite dissolution rates are comparable across pH 1 to 9 at 25 °C in a study by Zhang et al.(2019).However,kaolinite dissolution different significantly among LMWOLs (oxalate >citrate >malate)and was pH dependent(Wang et al.2005).
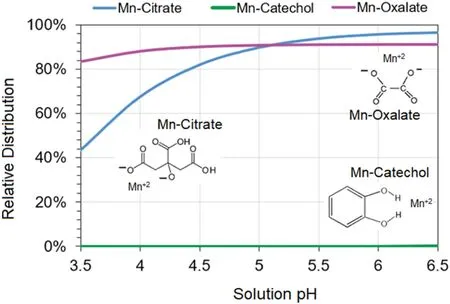
Fig.1 Visual MINTEQ ver.3.1 modeled speciation and complexation of 0.01 M Mn with 0.01 M catechol,citrate,or oxalate with 0.02 M NaCl at 25 °C
The objective of this study was to evaluate aluminosilicates dissolution and release of Mn from minerals,rocks,and soils and quantify the influence of LMWOLs and acidity.Manganese release is defined here as Mn in solution over time normalized to the Mn in solid phase,and Mn dissolution rates are Mn in solution over time normalized to the surface area exposed to weathering.We investigated four LMWOLs treatments:control of no ligands,catechol,citric acid,and oxalic acid,which represent different complexation mechanisms:bi-dentate aromatic,tri-dentate folding,and bi-dentate folding,respectively.Moreover,we investigated if Mn release and dissolution rates rates would be impacted by soil properties such as the abundance of secondary Fe oxides and organic C in soils.
First,we hypothesized dissolution rates for felspars minerals and rocks (orthoclase and anorthosite) and nesosilicates (kyanite) would be lower than inosilicates rocks (amphibolite) and phyllosilicates (muscovite) due differences in low temperature stability and surface area available for dissolution (Zhang et al.2019) and assumed Mn substitution for Fe or Ca in minerals rather than into Al.Second,we hypothesized that LMWOLs available to complex Mn under acidic conditions (e.g.citrate),will increase Mn dissolution rates more than the control or protonated LMWOL unavailable for complexation (e.g.catechol).Third,we predicted the most acidic pH conditions would have the highest Mn dissolution rates as it promotes Mn solubility.Lastly,we hypothesize that greater Fe oxides and OM would result in lower Mn dissolution rates across soils.This information is essential to furthering our understanding of Mn release to terrestrial environments.
2 Materials and methods
2.1 Rocks,minerals,and soils studied
Rocks and minerals were collected from several areas to investigate a range of elemental concentrations and forms of aluminosilicates.An amphibolite,primarily hornblende and garnet in composition,was collected from glacial till in the High Peaks region of Adirondacks,NY as an Fe-rich aluminosilicate end-member.Anorthosite sourced from Labrador,Canada was obtained from the Dartmouth College rock and mineral collection.A granitic pegmatite was sampled for muscovite and orthoclase feldspars from Leominister,MA.Kyanite was collected from Blandford,MA.Kaolinite was purchased from Ward’s Science(Rochester,NY,USA).Rocks and minerals were crushed using a ceramic mortar and pestle and powdered using a shatterbox to between 0.1 and 100 μm.Minerals were washed with DI water and dried three times to remove ultrafine particles and were mineralogy confirmed by XRD patterns measured with a Rigaku Miniflex 600 (Rigaku Analytical Devices,Wilmington,MA,USA)and elemental composition from total digestion (total digestion methodology is described in Sect.2.3).
Soils were obtained from B and C horizons at four Critical Zone Observatories:Calhoun,Eel River,Luquillo,and Southern Sierra CZOs.CZO sites were chosen due to their known bedrock and extensive information on land-use history.More importantly,the CZOs together allows for a comparison of soils from contrasting climates:hot,tropical climate of Luquillo CZO to colder,drier montane climate at Southern Sierra CZO (see Richardson et al.2018 for additional details for each CZO).Briefly,Calhoun soils are residuum of granitic gneiss;samples obtained from archived material from a Bt horizon(1–1.5 m depth)and C horizon at 12.2–13.7 m depth)(see Bacon et al.2012).Eel River soils are residuum of argillite and greywacke at Rivendell;Bt horizon samples were collected from 40 cm depth and C horizon from 5.5 m depth (see Richardson et al.2018).Luquillo soil samples are colluvium of tonalite from Guaba Ridge within the Rio Icacos watershed;soil samples were collected from a clay B horizon and drilled rock core from 3 m depth (see Buss et al.2017).Southern Sierra soil samples are from the head of Providence Creek and are granitic materials in a glaciated ridge;B horizon soil samples are from 0.5 to 1.1 m depth soil pit and C horizons are from 7 to 8 m depth geoprobe (see Holbrook et al.2014).B horizons and C horizons were air-dried,and sieved to <2 mm.
Subsamples of crushed,homogenized rock,mineral,and soil samples were digested for total concentrations of macro elements (Al,Fe,Ca,K,Mg,Mn) but only Al and Mn are discussed here.In brief,25.0 ± 1.0 mg of solid sample was weighed into 30 mL PFA vials.With every 20 samples,we included at least one preparation blank,a duplicate,and two SRMs:W-2 diabase and G-2 granite from the United States Geological Survey(USGS).For the digestion,a mixture of 4 mL of trace metal grade 28.9 M HF and 10 mL of trace metal grade 15.6 M HNO3was added to each vial,which were then tightly sealed and heated to 120 °C for the first 24 h,then 180 °C for 72 h.After no visible solids were observed,samples were slowly dried down to volatilize off SiF4and re-dissolved in dilute HNO3.Total macro concentrations for rocks and minerals are in Table 1 and for soil horizons are in Table 2.

Table 1 Mineral and rock surface area and elemental composition measured by concentrated HF-HNO3 digestion

Table 2 Soil surface area measured by BET and majors measured by total HF-HNO3 total digestion
Surface area was measured for rocks,minerals,and soils by Brunauer–Emmett–Teller (BET) method commercially by Particle Testing Authority following ASTM C1069-09(ASTM 2014).In brief,samples were oven dried and degassed to purge vapors under N2for 960 min at 25 °C.Surface area was calculated using a 10 point calibration curve of saturation pressure (ranging from 80 to 120 kPa)and temperature (75.4 to 78.9 K).
2.2 Batch reactors
Batch reactors were conducted to determine Mn massnormalized release(total Mn in solution normalized to total Mn in solid phase) and dissolution rate (surface area normalized Mn in solution per day)across rocks,minerals,and soils and across low-molecular weight organic ligands and solution starting pH.Acid-washed 50 mL centrifuge tubes were used as batch reactors.For each sample,5.000 ± 0.010 g of rock,mineral,or soil was weighed into a unique tube.Four treatments were used:10 mM catechol,10 mM citric acid,10 mM oxalic acid and a control of only dilute HCl.Organic buffers were not used because they can act as ligands,which unfortunately allowed for pH to increase in solutions over time.The ionic strength of each solution was kept constant with 20 mM NaCl and each solution was acidified to pH 4,5,or 6 with their conjugate base(Na-citrate,Na-oxalate)and HCl and NaOH.Each pH treatment,LMWOL treatment,and rock,mineral,and soil treatment combination was completed in triplicate,totaling 312 samples.Solutions were placed into a box to prevent photo reactions and were shaken with an Eberbach tabletop reciprocating shaker at 180 oscillations per minute.After 14 days of shaking,solutions centrifuged at 2500 RPM for 1 h,supernatant was decanted,and filtered to <0.45 μm.Regrettably,pH was not measured for supernatants.Batch reactor solutions were treated with 5 mL of 30% H2O2to remove organic acids and acidified to 0.4 M HNO3.To avoid artifacts from freshly ground rocks (see Zhang et al.1996),the 14-day batch reactor experiment was repeated four times.
2.3 Digests and solutions metal analyses
Rock,mineral,and soil digests,and batch reactor solutions were analyzed for macro metals (Al,Fe,Ca,K,Mg,Mn)with an Agilent 5110 ICP-OES (Agilent,Santa Clara,CA,USA).Multi-element standards from Inorganic Ventures(Inorganic Ventures,Christiansburg,VA,USA) were used for calibration.Manganese and Al concentrations in preparation blanks samples were <0.005 μg g-1.SRM digestion recoveries for total digests of W-2 and G-2 were 81%–103% of their USGS certified values for macro elements Al and Mn.The variation between intra-sample duplicates was <6%.
2.4 Aqueous phase and saturation modeling
The speciation of aqueous phase ions and calculation of mineral saturation indices was performed using Visual MINTEQ version 3.1 for Windows (Gustafsson 2014).Batch reactor solutions were modeled using averaged measured metal concentrations (Al,Ca,Fe,K,Mg,Mn,Na) across the four,14-day replicates and three treatment replicates.Several parameters were not measured and were estimated,specifically the initial LMWOL concentrations(10 mM catechol,10 mM citric acid,10 mM oxalic acid),CO2(g)at 4.1 × 10⁻⁴atm,and oxic conditions were assumed (pe=10.5).Calculations did not take into account mineral surface sorption reactions,and existing organic matter was not included for soils.Ionic strength of the solution was calculated from inputs and temperature was set at 25 °C.Further,we also assumed Fe was Fe+3and Mn was Mn+3instead of Mn+2,based on the assumption that the initial oxygen would oxidize Mn during the 14 d incubation.However,ORP was not measured and gaseous and dissolved oxygen is likely to have decreased to an extent during the experiment.Saturation indices were calculated to determine speciation and precipitation reactions;negative saturation indices suggest a solution is undersaturated for a specific mineral and positive saturation indices suggest a solution is supersaturated for a specific mineral (Stumm and Morgan 1996).Saturation indices were calculated for 55 mineral phases(Al,Ca,Fe,K,Mg,Mn,and Na common minerals)using the Visual MINTEQ 3.1 thermodynamic database.For our results,we focused on five Al minerals (diaspore,gibbsite,boehmite,kaolinite,and halloysite) and seven Mn minerals (birnessite,bixbyite,nsutite,pyrolusite,hasumannite,manganite,and rhodocrosite).
2.5 Statistical methods and data analyses
Elemental concentrations are reported on a dry weight basis.Mean values presented in the text are ± 1 standard error,where available.Comparisons among overall Mn dissolution rates for each rock and mineral (N=108 total samples and n=36 samples per rock and mineral) and for soil (N=96 total samples and n=12 samples per soil horizon)were tested for normality using the Lilliefors test,log-transformed if needed to establish normality,and compared using t-tests.The effect of LMWOL treatments for each pH across replicate days was tested using the N-Way ANOVA Test with the post-hoc t-tests in Matlab(Mathworks,Natick,MA).
3 Results and discussion
3.1 Mn release and dissolution rates among rocks and minerals
In our first hypothesis,we tested several rocks and minerals to determine variations in Mn mass-normalized release(total Mn in solution normalized to total Mn in solid phase)and dissolution rate (surface area normalized Mn in solution per day).Overall rock and mineral Mn mass-normalized release was 1.2 ± 0.3 nM μM-1over the 14-day period (Fig.2)and dissolution rate was 2014 ± 680 nM m-2d-1× 10³across all LMWOL and pH treatments (Fig.3).N-way ANOVA determined that Mn release and dissolution rates were significantly different among rocks and minerals.Across rocks and minerals,Mn release was significantly higher for kyanite(3.5 ± 0.9 nM μM-1over the 14-day period)and kaolinite(2.3 ± 0.6 nM μM-1over the 14-day period,p<0.05)than other rocks and minerals (p<0.05) (Fig.2).Manganese release was significantly lower for amphibolite and muscovite (0.2 ± 0.2 nM μM-1over the 14-day period)than other rocks and minerals (p<0.05) (Fig.2).When normalized to surface area,dissolution rates were significantly higher for anorthosite (5330 ± 1250 nM m-2d-1× 10³)and kyanite(3930 ± 510 nM m-2d-1× 10³)than other rocks and minerals (p<0.05) (Fig.3).Further,Mn dissolution rates were significantly lower for orthoclase feldspar (574 ± 162 nM m-2d-1× 10³) and kaolinite(23 ± 6 nM m-2d-1× 10³) than other rocks and minerals (p<0.05) (Fig.3).
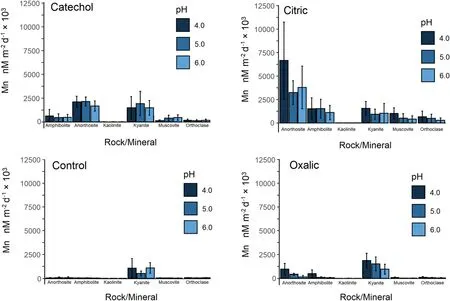
Fig.2 Manganese dissolution rates normalized to mineral surface area for rocks(amphibolite and anorthosite)and minerals(kaolinite,kyanite,muscovite,orthoclase feldspar) under catechol,citric acid,oxalic acid,and control (HCl only) at pH 4,5,and 6 over 14 days.Samples were completed in triplicate per batch and repeated four times
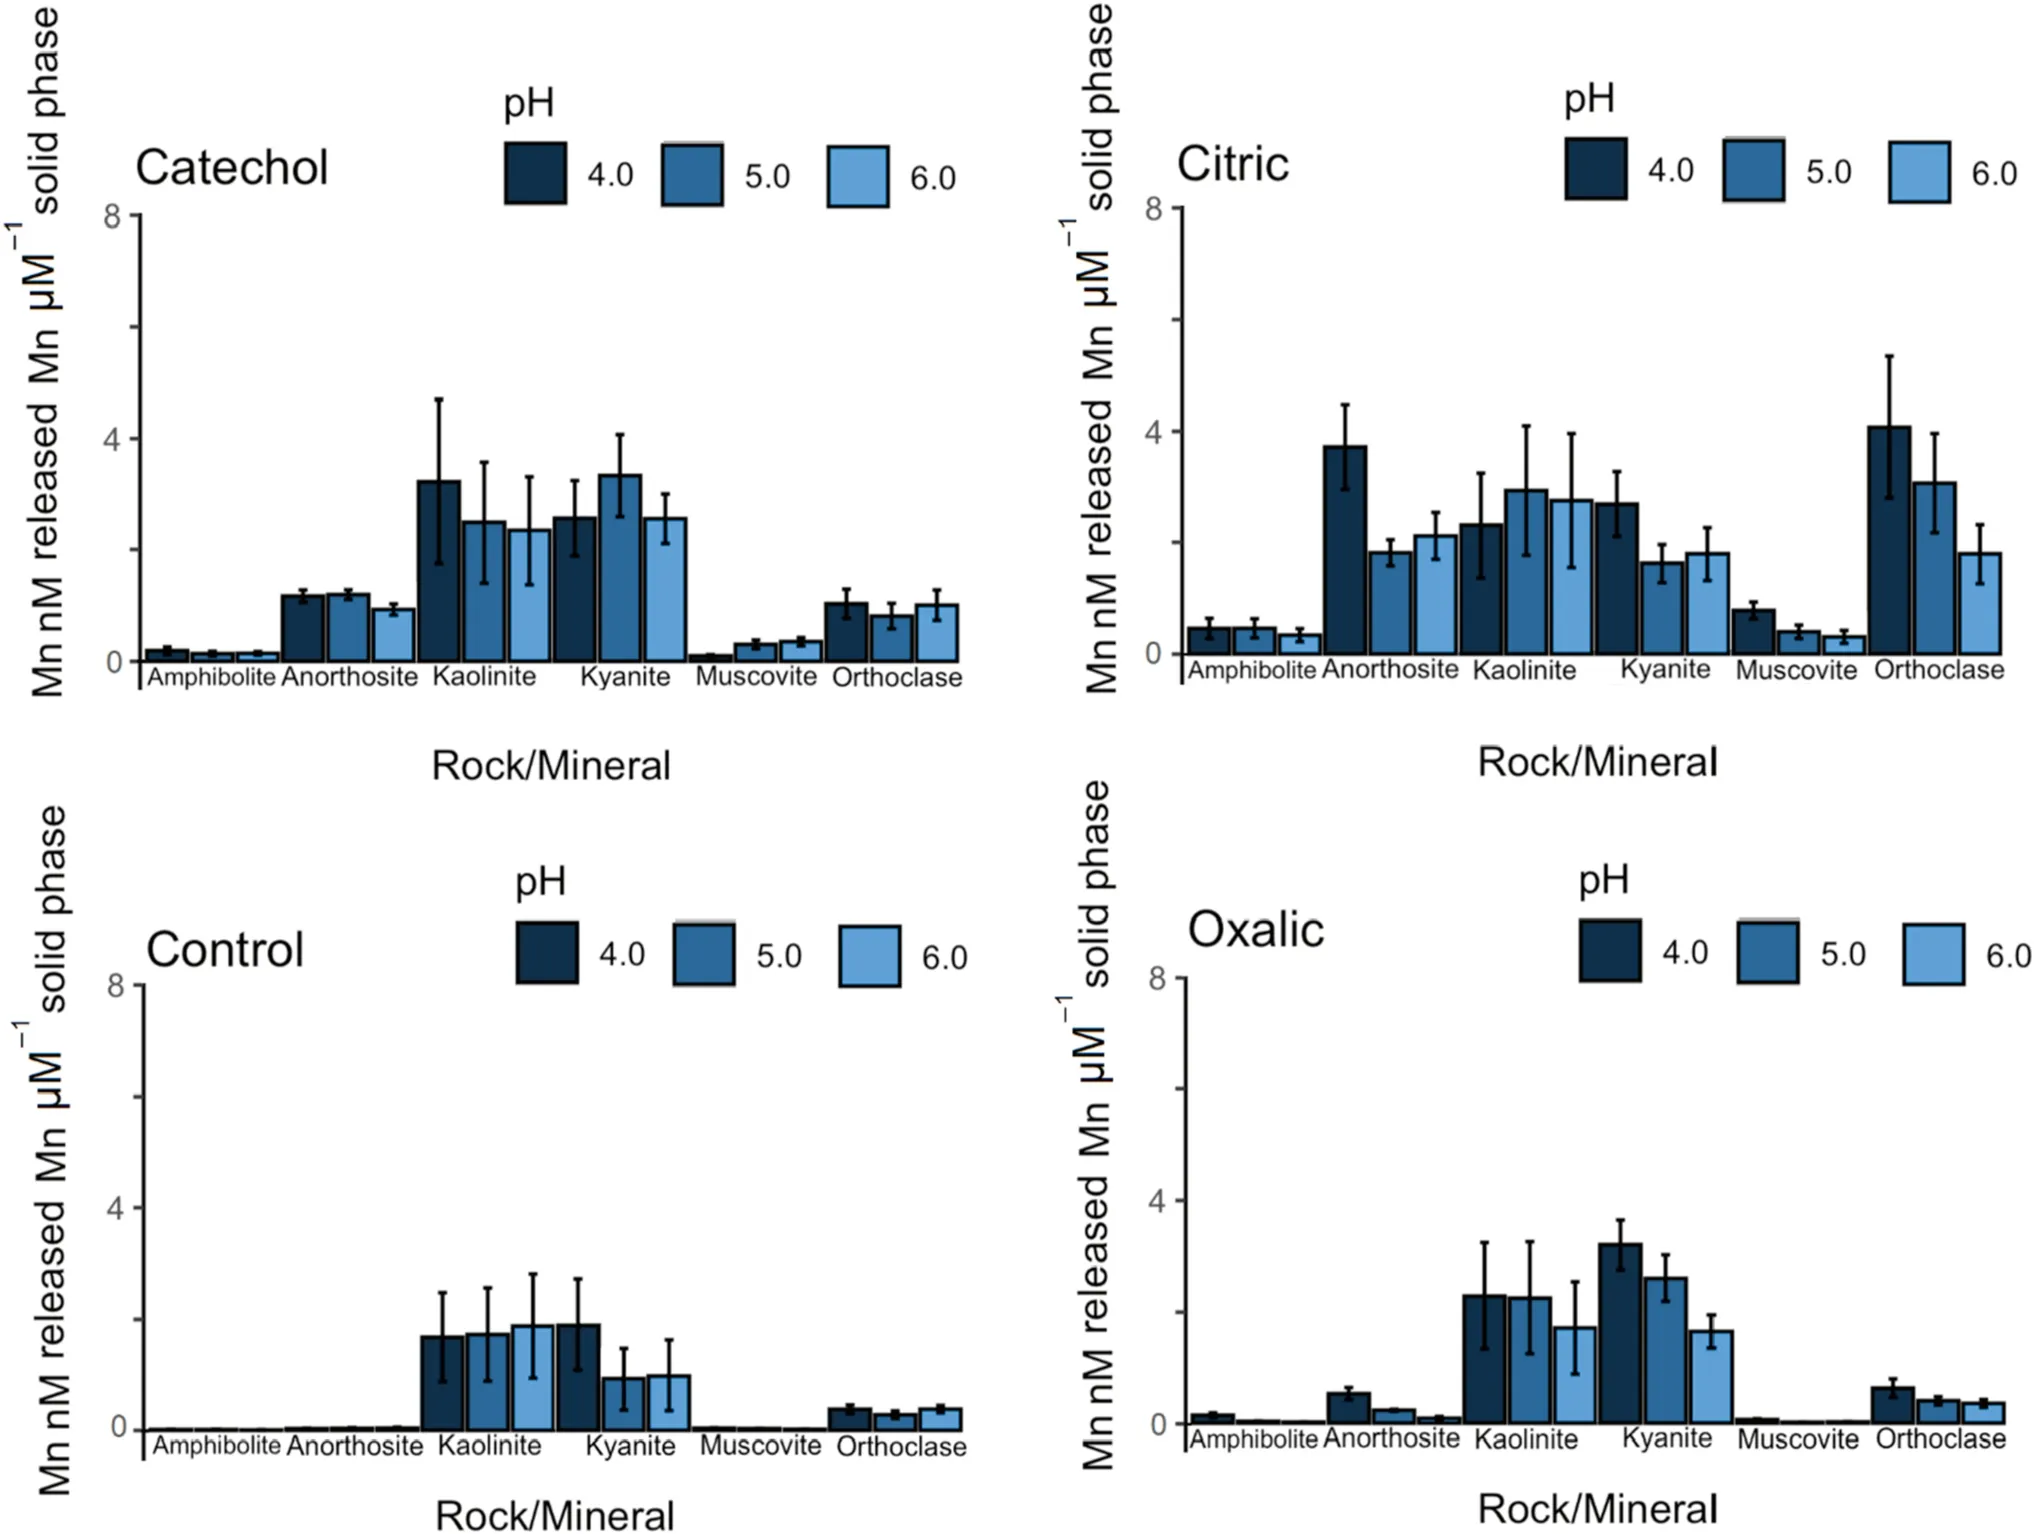
Fig.3 Manganese release rates normalized to solid phase Mn concentrations for rocks (amphibolite and anorthosite) and minerals (kaolinite,kyanite,muscovite,orthoclase feldspar)under catechol,citric acid,oxalic acid,and control(HCl only)at pH 4,5,and 6 over 14 days.Samples were completed in triplicate per batch and repeated four times
Manganese release and dissolution rates were not associated with solid phase concentrations,in other words,higher Mn substitution into aluminosilicates did not generate higher Mn release rates.Rocks and minerals with the higher Mn concentrations,namely amphibolite and anorthosite (Table 1),had low Mn release rates.Conversely,kyanite and kaolinite had low Mn concentrations had high Mn release rates.By comparing the Mn release rates for amphibolite and orthoclase feldspar,we surmise that Mn substituted in garnets or hornblende in the amphibolite was more resistant to dissolution than the Mn substituted in feldspar of the anorthosite (see Tan 1986;Welch and Ullman 1993).We used Al to assess if general aluminosilicate mineral dissolution affected Mn release and dissolution rates among the six rocks and minerals.Linear regressions between solid phase Al concentrations and Al released over the 14-day period were positive and significant (p<0.05;R=0.44) and linear regressions between solid phase Al concentrations and Al dissolution rates were positive and significant(p<0.05;R=0.53).These results suggest that aluminosilicate dissolution scaled with Al present,suggesting that solid phase Mn abundance was likely not a limitation for Mn release.Instead,we hypothesize that structural location of Mn,more specifically Mn substituted for Fe within inosilicates or amphiboles,may lead to different release rates.
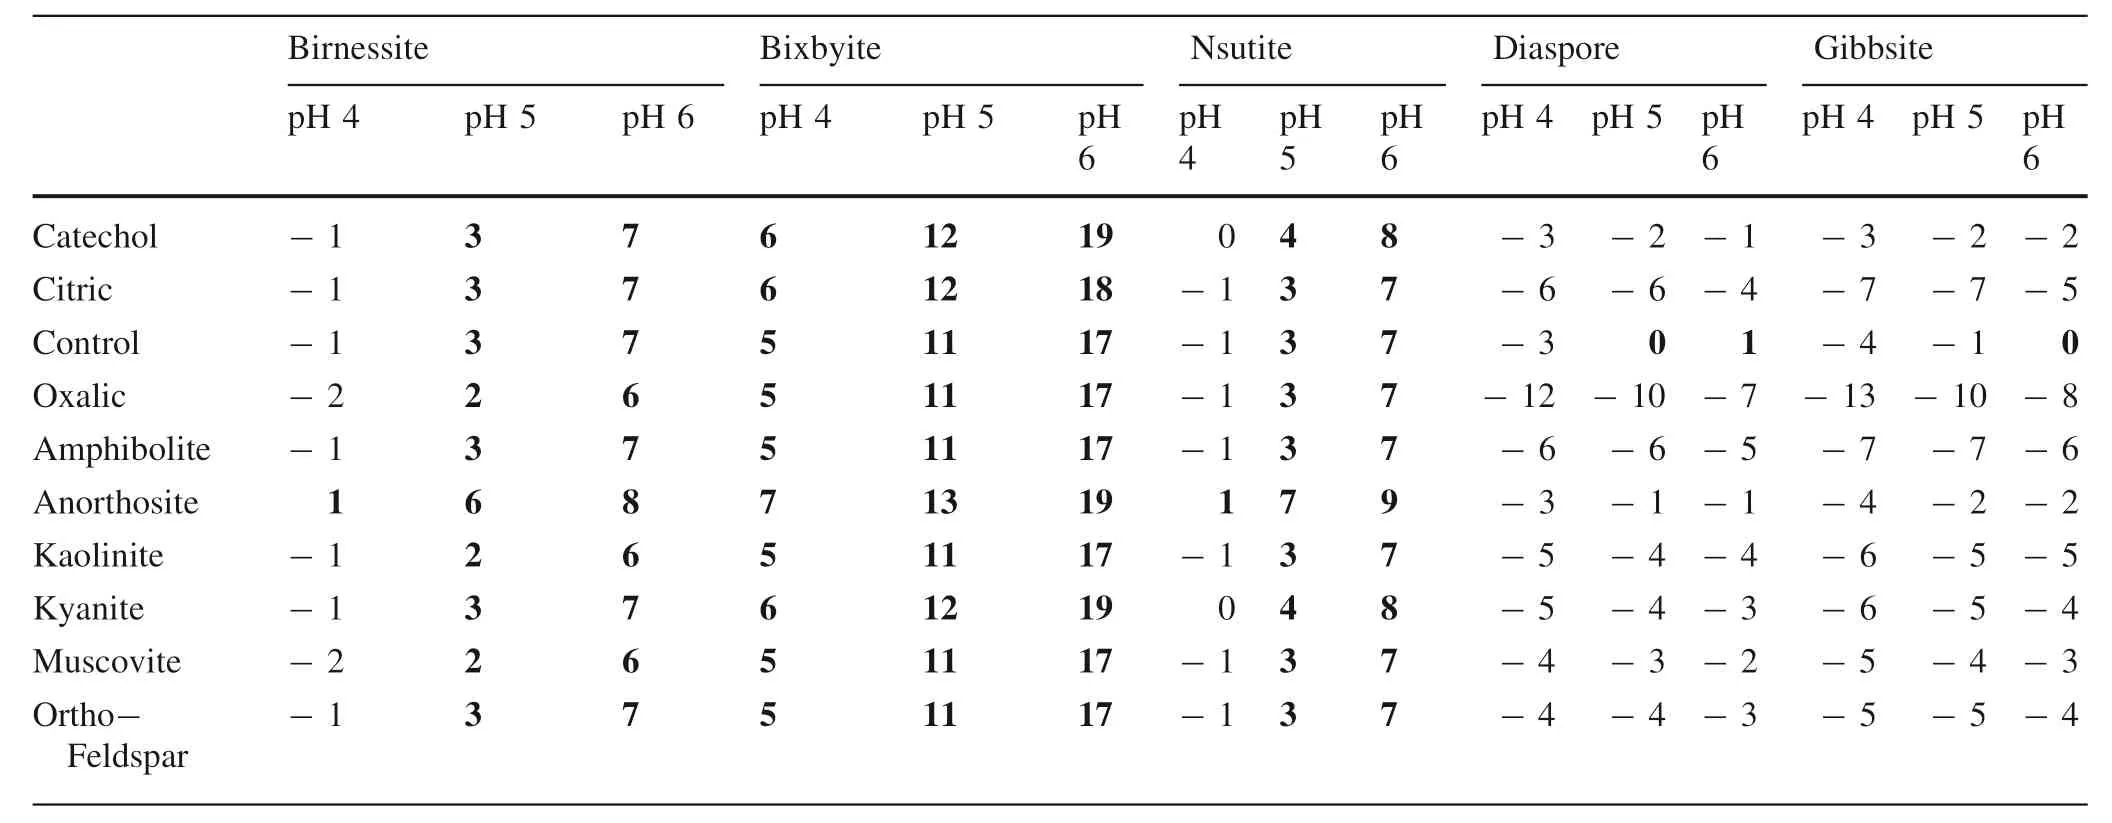
Table 3 Median mineral and rock saturation indices (Log IAP) for LMWOL treatments of 0.01 M catechol,citrate,and oxalate using Visual MINTEQ version 3.1.Saturation indices were calculated using measured Ca,Al,Fe,K,Mg,and Si and approximated Na,Cl,CO2,pe at 25 °C.Positive values (in bold) indicate theoretical saturation.Al minerals boehmite,kaolinite,and halloysite and Mn minerals pyrolusite,hausmannite,manganite,and rhodocrosite were also calculated but were unsaturated (<-5 SI) for all materials,LMWOL,and pHAl minerals boehmite,kaolinite,and halloysite and Mn minerals pyrolusite,hausmannite,manganite,and rhodocrosite were also calculated but were unsaturated (< -5 SI) for all materials,LMWOL,and pH
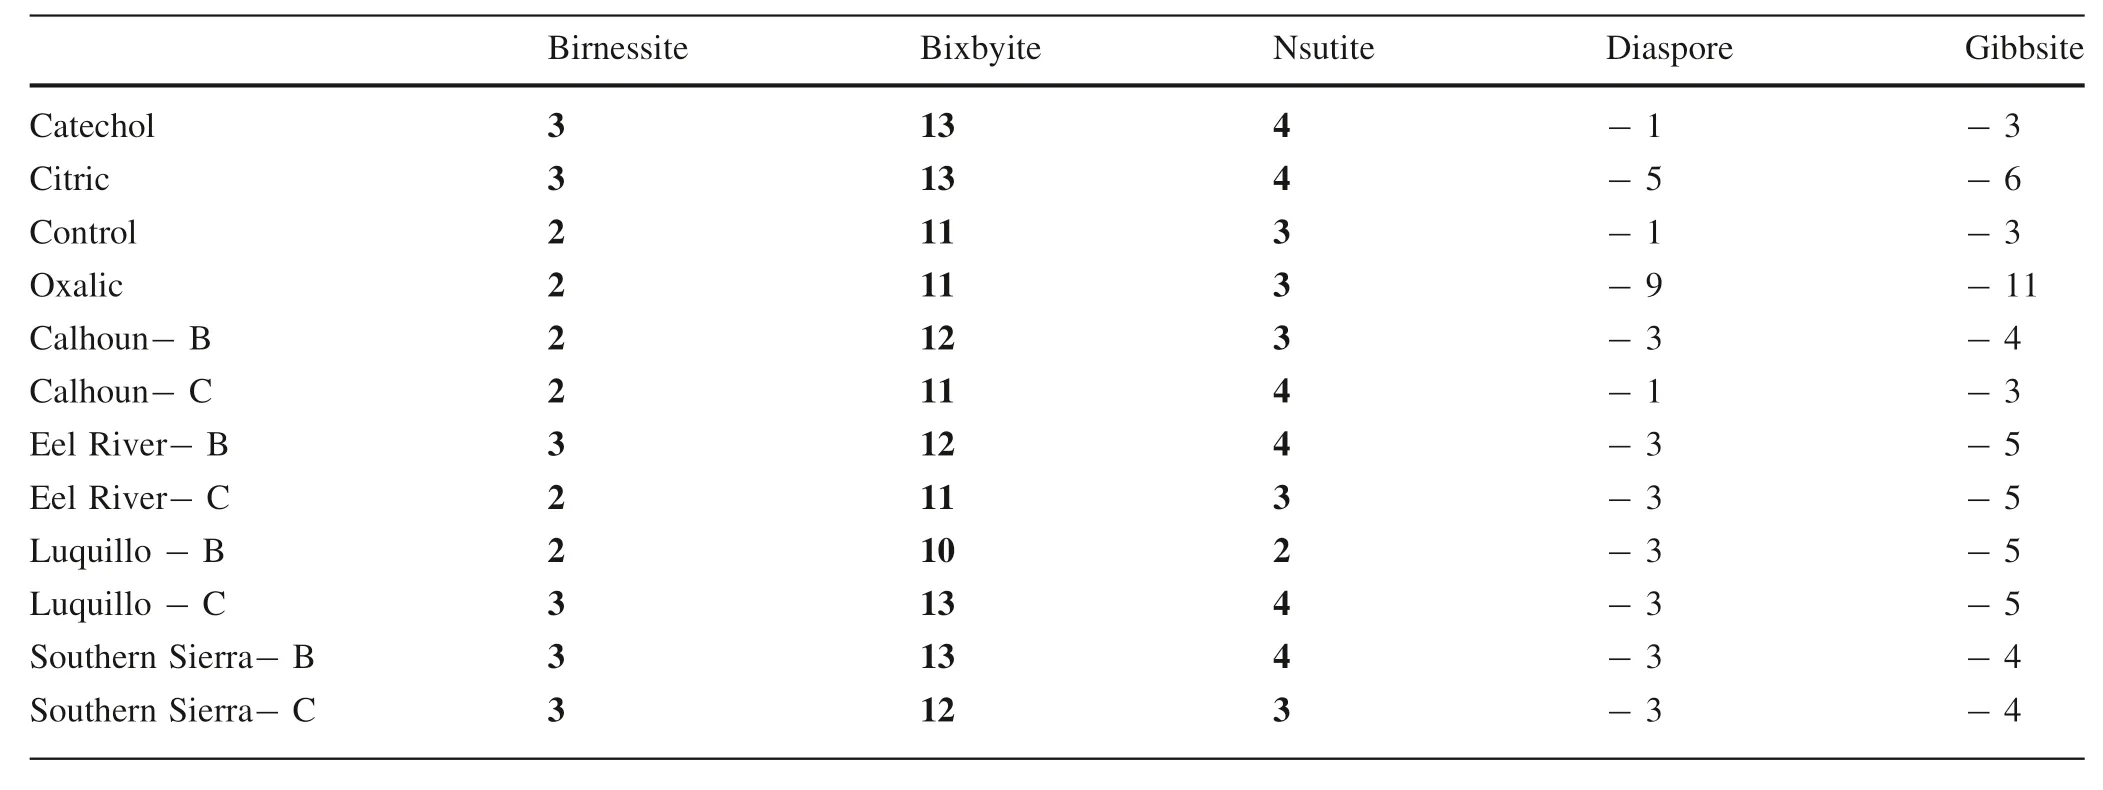
Table 4 Median soil saturation indices (Log IAP) for LMWOL treatments of 0.01 M catechol,citrate,and oxalate using Visual MINTEQ version 3.1.Saturation indices were calculated using measured Ca,Al,Fe,K,Mg,and Si and approximated Na,Cl,CO2,pe at 25 °C.Positive values (in bold) indicate theoretical saturation.Al minerals boehmite,kaolinite,and halloysite and Mn minerals pyrolusite,hausmannite,manganite,and rhodocrosite were also calculated but were unsaturated (<-5 SI) for all materials,LMWOL,and pHAl minerals boehmite,kaolinite,and halloysite and Mn minerals pyrolusite,hausmannite,manganite,and rhodocrosite were also calculated but were unsaturated (< -5 SI) for all materials,LMWOL,and pH
Interestingly the rocks and minerals with the highest Mn mass-normalized release were kyanite and kaolinite.The high surface area of kaolinite may have affected the efficacy of LMWOLs in enhancing Mn release and dissolution and normalizing to solid phase Mn concentrations may be important for interpreting our kaolinite results.Kaolinite is a stable mineral under low temperature,acidic environments with dissolution rates two orders of magnitude lower than quartz and feldspars (Zhang et al.2019).The rapid release of Mn from kaolinite may stem rapid dissolution from octahedral layer(e.g.Iriarte et al 2005)or amorphous Al-Mn phases within the kaolinite structure (cf.Nahon et al.1989).The high Mn dissolution rate and low resistance to Mn release for kyanite seems anomalous,especially as kyanite is typically characterized as a slow weathering aluminosilicate with dissolution rates orders of magnitude lower than other similar silicates (Zhang et al 2019).However,the surface area and elemental composition of our kyanite were comparable to values from Oelkers and Schott (1999).Further,the kyanite Al release(0.15 μM mM-1over the 14-day period) was lower than all anorthosite,orthoclase feldspar,and muscovite(0.20–0.40 μM mM-1over the 14-day period).We hypothesize the high Mn release rates are from small inclusions of accessory minerals within the kyanite,such as Mn-rich epidote(Yang and Rivers 2001)or magnetite(e.g.Mistikawy et al.2020).Thus,the Mn abundance in rocks and mineral controlling Mn release did not explain Mn release or dissolution rates,likely stemming from how Mn is coordinated with each aluminosilicate rock and mineral.
3.2 Mn release and dissolution rates among soils
Overall soil Mn release across all CZOs,horizons,LMWOL,and pH treatments was 16.7 ± 5.1 nM μM-1over the 14-day period (Fig.4) and dissolution rate was 7010 ± 2570 nM m-2d-1× 10³(Fig.5),which were significantly higher than measured in rock and minerals(p<0.05).N-way ANOVA determined that Mn release and dissolution rates were significantly different among soil horizons and among CZOs.Comparing across CZOs and soil horizons,mass-normalized Mn release was highest for Calhoun B horizon,Eel River B horizon,Luquillo C horizon (18 to 33 nM μM-1over the 14-day period) and were significantly lower for Luquillo B horizon(6.2 ± 1.8 nM μM-1over the 14-day period) and Southern Sierra C horizon(5.4 ± 1.7 nM μM-1over the 14-day period)(p<0.05).Similarly,Mn dissolution rates were significantly higher for Luquillo C horizon(18,430 ± 6830 nM m-2d-1× 10³) and Southern Sierra B horizon (10,480 ± 4270 nM m-2d-1× 10³) than the other soil horizons (p<0.05).Further,Mn dissolution rates were significantly lower for Luquillo B horizon(377 ± 110 nM m-2d-1× 10³) and Calhoun C horizon(2180 ± 667 nM m-2d-1× 10³) than the other soil horizons (p<0.05).
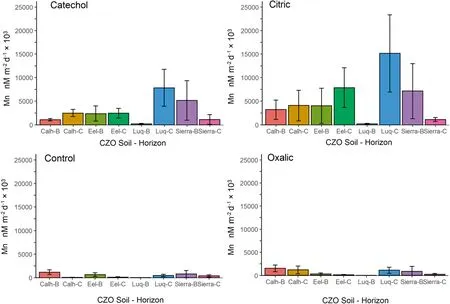
Fig.4 Manganese dissolution rates normalized to soil surface area for B and C horizons at Calhoun,Eel River,Luquillo,and Southern Sierra CZOs under catechol,citric acid,oxalic acid,and control(HCl only)at pH 4.5 over 14 days.Samples were completed in triplicate per batch and repeated four times
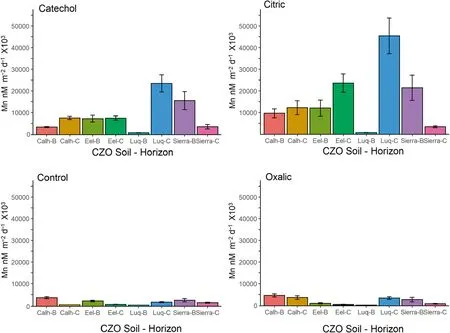
Fig.5 Manganese release rates normalized to solid phase Mn concentrations for B and C horizons at Calhoun,Eel River,Luquillo,and Southern Sierra CZOs under catechol,citric acid,oxalic acid,and control (HCl only) at pH 4.5 over 14 days.Samples were completed in triplicate per batch and repeated four times
For soil horizons,the variation in Mn release and dissolution rates was strongly associated with higher solid phase Mn concentrations;soil horizons with higher Mn concentrations had higher Mn release rates.However,Mn release and dissolution in the soils is controlled beyond aluminosilicate weathering,as organic matter,secondary Mn oxides,or adsorbed Mn could have an important effect.Soils with higher %C content did not have significantly higher or lower Mn release or dissolution rates (Supplemental Fig.1).Thus,the native organic C appears to not have had a significant effect on Mn release and dissolution.However,Mn sorption to native C was not quantified in this study.Further,Fe oxides(estimated by CBD extraction of soils see Richardson et al.2018) did not significantly impact Mn dissolution or release rates (Supplemental Fig.1) as there were not overall trend.These results suggest that extent of pedogenesis did not impact Mn dissolution beyond controlling the abundance of solid phase Mn.Thus,the highly weathered soils of Calhoun released Mn proportionally similar to the younger Eel River and Luquillo soils.To further explore the potential source of Mn,we examined solid phase Al concentrations with Al release and dissolution rates to quantify differences across sites in aluminosilicate dissolution for soil samples.Linear regressions between solid phase Al concentrations and Al released over the 14-day period were not significant for soils (p>0.10;R=0.02) nor were linear regressions between solid phase Al concentrations and Al dissolution rates significant (p>0.10;R=0.04).The Mn and Al release and dissolution rates of the soils were orders of magnitude greater than those measured in the rocks and minerals of our study.Thus,we hypothesize Mn release and dissolution rates may have been controlled by amorphous phases or secondary oxides.Additional operationally-defined extractions were not performed in this study,but future projects should consider examination of the susceptibility of oxide and adsorbed Mn for release under oxic conditions,particularly in-situ to avoid laboratory-condition artifacts.
3.3 Batch reactor dissolution rates among LMWOL
In our second hypothesis,we expected that LMWOLs would affect the dissolution rate of Mn from rocks,minerals and soils,with expectations for greater dissolution and complexation by citric acid and oxalic acid than catechol or controls treatment without LMWOLs.Across all rocks and minerals,the citric acid LMWOL treatment had significantly higher Mn release (1.9 ± 0.2 nM μM-1over the 14-day period)and dissolution rates(4140 ± 460 nM m-2d-1× 10³) than the control,which had Mn release (0.5 ± 0.1 nM μM-1over the 14-day period) and dissolution rates (347 ± 60 nM m-2d-1× 10³) (p<0.05).These trends are evident in Figs.2 and 3.When considered for each rock and mineral,N-way ANOVA determined that citric acid had significantly higher Mn release and dissolution rates than catechol,oxalic acid,and the control for all rocks and minerals except for kyanite (p<0.05).Furthermore,citric acid increased Mn release and dissolution rate by over an order of magnitude for amphibolite,anorthosite,orthoclase feldspar,and muscovite.
Across all soils,N-way ANOVA determined that citric acid had increased Mn release(37.1 ± 3.8 nM μM-1over the 14-day period)and dissolution rates(16,060 ± 2000 nM m-2d-1× 10³) than the control Mn release (4.2 ± 0.6 nM μM-1over the 14-day period) and dissolution rate (1380 ± 170 nM m-2d-1× 10³)(p<0.05).These trends are observable in Figs.4 and 5.When considering each soil horizon,citric acid had significantly higher Mn release and dissolution rates than catechol,oxalic acid,and the control for all CZO soils and horizons except for Calhoun and Luquillo B horizons(p<0.05) (Figs.4 and 5).As a check on aluminosilicate dissolution,we found that Al release and dissolution rates exhibited the same patterns as Mn for citric acid treatment(p<0.05).These results highlight that citric acid is an effective ligand,even under acidic conditions.Citric acid likely acted through ligand-promoted dissolution by weakening and breaking Mn to O lattice bonds (Stumm 1997;Goyne et al.2006).These results agree with Neaman et al (2004),who found citrate to be more effective in Fe release from granites than oxalate and malonate at pH 6.Furthermore,the pH did not dimmish the efficacy in citric acid due to its second and third pka values of 4.7 and 6.4.Our results show that protonation of the second and third functional groups did not decrease its capacity as a ligand by leaving the functional groups uncharged and unavailable.
Further,we found significant effects from catechol on Mn dissolution.Across all rocks and minerals,Mn release for catechol (1.3 ± 0.1 nM μM-1over the 14-day period)and dissolution rates for catechol (2310 ± 200 nM m-2d-1× 10³) were significantly higher than the control(p<0.05).Catechol significantly increased Mn release and dissolution rates for amphibolite,anorthosite,orthoclase feldspar,and muscovite (p<0.05),which was nearly an order of magnitude difference for amphibolite and anorthosite.Across all soils,Mn release for catechol(19.8 ± 1.8 nM μM-1over the 14-day period) was also significantly greater than the control (p<0.05).Catechol increased Mn release and dissolution for all sites and soil horizons except Calhoun B horizon.As a check on aluminosilicate dissolution,we found that Al release and dissolution rates exhibited the same patterns as Mn for catechol treatment(p<0.05).We expected minimal effect from catechol due to full protonation below pH 6 due to its pka values of 9.45 and 12.8.Similar to citric acid,catechol increased Mn release and dissolution rates and may have a cumulative proton-promoted and ligand-promoted effect on Mn dissolution.Furthermore,catechol can also cause reduction and dissolution of crystalline and amorphous Mn oxides (Stone and Morgan 1984),which may be particularly important for the soils in this study due to potential Mn oxides.
For oxalic acid across all rocks and minerals,Mn release(0.9 ± 0.2 nM μM-1over the 14-day period) and dissolution rates (1140 ± 130 nM m-2d-1× 10³) were significantly higher than the control (p<0.05).On the basis of the N-Way ANOVA,Mn release and dissolution rate was higher for oxalic acid than the control treatment for amphibolite,anorthosite,and orthoclase feldspar(p<0.05),but not for kaolinite,kyanite,and muscovite(p>0.10).Interestingly,oxalic acid had significantly lower Mn release and dissolution rate than the control for kyanite (p<0.05).Across all soils,oxalic acid had significantly higher Mn release (19 ± 3 nM μM-1over the 14-day period) and dissolution rate (1380 ± 170 nM m-2d-1× 10³) than the control (p<0.05).However,oxalic acid had higher Mn release and dissolution rates compared to the control for only Calhoun C horizon and Luquillo C horizon (p<0.05).Conversely,oxalic acid had lower Mn release and dissolution rates compared to the control for Eel River B horizon and Luquillo B horizon.These results show that oxalic acid can increase Mn release and dissolution rate through ligand-promoted dissolution,but the effect may be soil specific.We also examined Al release and dissolution rates and found oxalic acid significantly increased Al release and dissolution exhibited over the control (p<0.05),suggesting oxalate precipitation is element specific.This finding agrees with Neaman et al.(2004),who observed oxalate increased dissolution of Al and Fe from granite by approximately an order of magnitude above their ligand-free control.However,Goyne et al.(2006) observed that oxalate effectively removed Ca from solution as Ca-oxalate precipitants.In our experiment,amphibolite had the highest solid phase Ca concentration and oxalic acid still had significantly higher Mn release and dissolution rates.Thus,we conclude that oxalic acid can enhance Mn release and dissolution from minerals but may not keep Mn in solution due to its propensity to co-precipitate or substitute within hydroxyapatite (e.g.Mayer et al.2003).
3.4 Batch reactor dissolution rates pH for rocks and minerals
In our third hypothesis,we expected that pH would affect the dissolution rate of Mn from rocks and minerals by increasing proton-promoted dissolution,with expectations for greater dissolution under more acidic conditions with variability due to protonation of LMWOL at pH 4.The response of the soil horizons across pH was not explored in this study.Across all rocks and minerals,N-way ANOVA determined that Mn release was significantly higher at pH 4(1.4 ± 0.1 nM) than pH 6 (0.9 ± 0.1 nM μM-1over the 14-day period).Similarly,Mn dissolution rates was significantly higher under pH 4 (2982 ± 453 nM m-2d-1× 10³) than pH 6 (1921 ± 317 nM m-2d-1× 10³)(p<0.05).These differences are visible in Figs.2 and 3.This trend for pH 4 and 6 was also observed for Al release and dissolution rates.When considered for each rock and mineral across by each LMWOL treatment,we found that Mn release and dissolution was higher at pH 4 than pH 6 for citric acid for all minerals and minerals (p<0.05),except for kaolinite (p>0.10).Further,Mn release and dissolution increased at pH 4 and pH 6 for citric acid across all rocks and minerals (p<0.05).For catechol,pH 4 significantly increased Mn release and dissolution over pH 6 only for amphibolite and anorthosite.Moreover,catechol at pH 4 had significantly lower Mn release and dissolution for muscovite (p<0.05).
Our results highlight that acidity of pH 4 increased Mn release and dissolution rates among rocks and minerals,suggesting proton-promoted dissolution,across several LMWOL despite protonation of their functional groups(e.g.Tan 1986;Cama and Ganor 2006).However,protonpromoted dissolution may not be the responsible mechanism.When only examining the effect of pH across control treatments only,there were no significant differences between pH 4 and pH 6 for amphibolite,anorthosite,kaolinite,and orthoclase feldspar (p>0.10).This finding suggests that proton-promoted dissolution may be limited for specific minerals and proton-promoted dissolution may be dependent on the presence of LMWOL.An additional hypothesis is that the abundance of LMWOL increased Mn solubility and diminished precipitation of Mn oxides.Lastly,acidity may not have increased dissolution rates,but instead decreased adsorption of Mn to surfaces and amorphous Mn oxide phases (e.g.Duckworth et al 2009).However,post-hoc extractions for Mn oxides were not performed in this study to determine the variation in Mn oxides formed during the experiment.Nevertheless,our experiment showed pH affected Mn release and dissolution,especially when coupled with a LMWOL.
3.5 Saturation indices
Saturation indices were calculated using measured(Al,Ca,Fe,K,Mg,Mn,and Na) concentrations in solution averaged across time replicates for each rock,mineral,and soil and explored across LMWOL treatments and,for rocks and minerals,across pH values (Tables 3 and 4) using Visual MINTEQ 3.1.When considering across rocks and minerals,saturation indices suggest that solutions saturated in Mn with respect to birnessite,bixbyite,and nsutite especially at pH 5 and 6(Table 3).Few differences across rocks and minerals were observed.Further,soils were also Mn saturated with respect to birnessite,bixbyite,and nsutite at pH 4.5 (Table 4) and few differences among soil horizons or across CZOs were observed.Rocks,minerals,and soils were undersaturated in Mn with respect to other Mn minerals such as pyrolusite,hausmannite,manganite,and rhodochrosite.When considering LMWOL,few differences were observed in Mn saturation with respect to Mn minerals among catechol,citric acid,oxalic acid,and the control.The saturation indices for Mn minerals suggest that above pH 4,precipitation of birnessite,bixbyite,and nsutite was possible and may have limited the perceived Mn dissolution and release rates for the rocks and minerals.For the soils,saturation indices also suggest Mn was saturated with respect to birnessite,bixbyite,and nsutite and may have led to precipitation,with the potential to decrease perceived Mn dissolution and release rates.In addition,the interactions between mineral surfaces,oxide surfaces,and organic matter were not taken into account.Thus,the Mn release and dissolution rates may be higher due to potential precipitation of dissolved Mn.
When considering Al across all rocks,minerals,and soils,solutions were not saturated with respect to diaspore,gibbsite,boehmite,kaolinite,and halloysite (Tables 2,3 and 4).This suggests that the presence of Al may have outcompeted Mn for complexation to LMWOL.In particular,the control treatments Al concentrations for rocks,minerals,and soils were two orders of magnitude higher than catechol,citric acid,and oxalic acid(Tables 3 and 4).This demonstrates that without LMWOL to complex with,Al would be more available to precipitate as a mineral.We did not observe this effect for Mn.Although not discussed here,other cations used in the visual MINTEQ 3.1 speciation models (Ca,Fe,Mg,Na and K) could also compete with Mn for LMWOL complexation.
While the modeled saturation indices are useful for evaluating the potential impact of precipitation of Mn on perceived Mn dissolution and release rates,there are several important drawbacks to these results.First,calculations did not take into account mineral surface sorption reactions and existing organic matter was not included for soils.Thus,an unknown amount of Mn could have sorbed to organic and mineral surfaces and for soils and an unknown amount of dissolved organic carbon (DOC) was generated and could have further increased the solubility of Mn.Jones et al.(2018) explored that ligands and soluble Mn can act as oxidants and allow for degradation and release of additional DOC.However,we did not measured changes in DOC but did not find that soils with higher%C in the solid phase had higher Mn release or dissolution.Second,the reactions assumed CO2and O remained at initial atmospheric levels throughout the experiment.Microbial use of O and formation of H2CO3aqcould affect the formation of carbonate Mn (such as rhodocrosite) and reduction of Mn oxide formation due to lower pe.Lastly,we assumed Mn was predominantly Mn+3instead of Mn+2based upon the assumption the initial oxygen was not substantially depleted during the 14-day incubation.However,ORP was not measured and gaseous and dissolved oxygen is likely to have decreased during the experiment and may have increased the relative abundance of Mn+2,which would substantially decrease the saturation indices for Mn+3and formation of birnessite,bixbyite,and nsutite.
3.6 Conclusions and future directions
The goal of our study was to evaluate Mn release and dissolution rates from aluminosilicate rocks,minerals,and soils and evaluate the effect of LMWOL and acidity on the rate.Our study found that aluminosilicate rock and mineral dissolution rates was not governed by overall abundance of Mn.Instead,structural location of Mn,surface area,and potential inclusions of highly weatherable phases could dominate Mn release and dissolution rate.Moreover,there are several potential reasons to explain the anomalously high Mn release and dissolution rates for the typically weathering resistant mineral kyanite,such as inclusion of minor Fe oxide.Soils had higher Mn release and dissolution rates,which strongly corresponded with overall Mn abundance.However,Mn release and dissolution rates were likely affected by mineral surface reactions as well as the abundance of amorphous phases secondary oxides in the soils as Mn and Al dissolution rates did not scale together.These soil properties can either change the saturation and precipitation of Mn phases or contribute to higher Mn solubility (e.g.release of DOC).
In our second hypothesis,we investigated the effect of LMWOL on rock and mineral dissolution at pH 4,5,and 6 to determine if acidity diminished Mn release and dissolution rates.Despite increased acidity driving protonation of LMWOL,we found higher Mn release and dissolution rates at pH 4,across catechol,citric acid,and oxalic acid.This highlights that ligand-promoted dissolution continues below pka and dissociation constants for LMWOLs,and protonation of the functional groups did not prevent the effect.This effect was consistent across the amphibolite,anorthosite,kaolinite,muscovite,and orthoclase feldspar,but not kyanite.Furthermore,pH significantly increased Mn dissolution and release rates,but appears dependent on the presence of LMWOL as Mn dissolution and release rates at pH 4 was not significantly different than at pH 6 for several of the rocks and minerals.We hypothesize that proton-promoted dissolution is enhanced by the availability of LMWOLs for Mn release and dissolution from the aluminosilicates under the oxic conditions of this study.
There are many additional directions in which future research can build upon this non-exhaustive evaluation of Mn release and dissolution from rocks,minerals,and soils.First,the effect of organisms(bacteria,fungi,etc.)were not evaluated and may have contributed to the dissolution of Mn from soils,which has been the topic of many recent studies (e.g.Johnson et al.2016;Oldham et al.2017).Rocks and minerals were not evaluated under sterile conditions and the extent of colonization of the materials and utilization of LMWOL as C and energy sources was not evaluated.This likely contributed to higher Mn release from soils than rocks and minerals.Further,microbial communities can facilitate the oxidation and precipitation of Mn oxide minerals (e.g.Park et al.2018) and decrease perceived Mn dissolution rates.However,without quantification of microbial communities,discussion here is speculative.Second,the speciation of Mn was not evaluated.Thus,we could not evaluate the impact of changes in Mn+2to Mn+3and Mn+4to formation of new minerals and ability to complex with LMWOL.Our assumption of limited impacts on gaseous and dissolved O and predominantly Mn+2being oxidized to Mn+3needs further evaluation as the oxidation is rapid and can be mediated directly by organics (e.g.Zhang and Bloom 1999)and by microbes (e.g.Oldham et al.2017).
AcknowledgementsThis work was made possible by the National Science Foundation Grants (NSF-1360760) to the Critical Zone Observatory Network National Office and NSF-1660923 to Dr.Louis A.Derry through a subaward to Dr.Justin B.Richardson.The authors thank Corey Palmer for conducting a large portion of the laboratory work.
杂志排行
Acta Geochimica的其它文章
- Variations of methane stable isotopic values from an Alpine peatland on the eastern Qinghai-Tibetan Plateau
- Concentration determination of gold nanoparticles by flame atomic absorption spectrophotometry
- Evaluating soil erosion by water in a small alpine catchment in Northern Italy:comparison of empirical models
- Pressure calibration and sound velocity measurement to 12 GPa in multi-anvil apparatus
- Olivine and Cr-spinel as indicators of the petrogenesis and partial melting conditions of the high-MgO ultramafic volcanic rocks from NW Ad Dhala Province—Yemen
- Zinc,copper,and strontium isotopic variability in the Baiyangping Cu–Pb–Zn–Ag polymetallic ore field,Lanping Basin,Southwest China
